

Key Insights
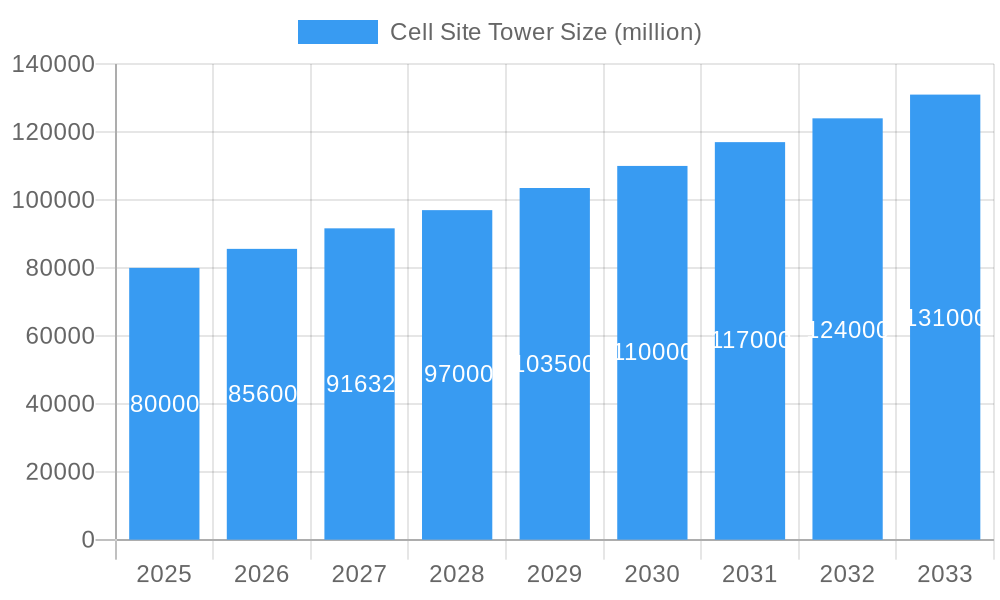
The global cell site tower market is experiencing robust growth, driven by the expanding need for enhanced mobile network infrastructure to support the increasing demand for high-speed data and 5G connectivity. The market, estimated at $80 billion in 2025, is projected to exhibit a Compound Annual Growth Rate (CAGR) of 7% from 2025 to 2033, reaching approximately $130 billion by 2033. This expansion is fueled by several key factors. The proliferation of smartphones and IoT devices necessitates a denser network of cell towers to ensure reliable coverage and service quality. Furthermore, the ongoing rollout of 5G networks globally requires significant investment in new tower infrastructure, as 5G signals require a higher density of smaller cells than previous generations. Government initiatives promoting digital infrastructure development and the increasing adoption of cloud-based services also contribute to market growth. Competition among major players like American Tower, Crown Castle, and Cellnex Telecom is intensifying, driving innovation and efficiency improvements in tower construction and management. However, regulatory hurdles, high initial investment costs, and the need for site acquisition can restrain market growth. The market is segmented based on tower type (macro, micro, small cells), ownership (independent, carrier-owned), and geography.
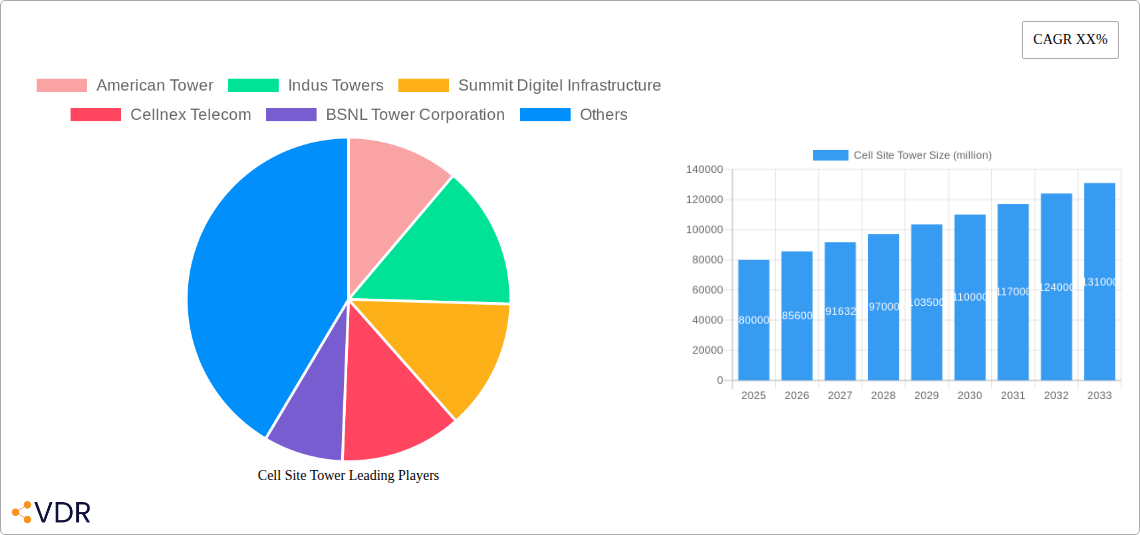
Cell Site Tower Market Size (In Billion)
The competitive landscape is characterized by a mix of large multinational corporations and regional players. Key companies such as American Tower, Crown Castle, and Cellnex Telecom hold significant market share due to their extensive tower portfolios and operational expertise. However, smaller, specialized companies are also emerging, focusing on specific niche markets such as small cell deployment or tower co-location services. The future growth of the market hinges on effective collaboration between telecom operators, tower companies, and technology providers to overcome infrastructural challenges and efficiently deploy the next generation of wireless networks. The ongoing evolution of technologies such as edge computing and the increasing demand for private 5G networks are expected to further drive market expansion in the coming years. Geographical growth will vary, with regions exhibiting strong economic growth and high mobile penetration rates likely experiencing the most significant expansion.
Cell Site Tower Company Market Share
Cell Site Tower Market Report: 2019-2033
This comprehensive report provides an in-depth analysis of the global Cell Site Tower market, encompassing historical data (2019-2024), current estimations (2025), and future forecasts (2025-2033). The study meticulously examines market dynamics, growth trends, regional dominance, product landscape, key players, and emerging opportunities within the parent market of telecommunications infrastructure and its child market of wireless network deployment. This report is essential for industry professionals, investors, and strategic decision-makers seeking a clear understanding of this rapidly evolving sector.
Cell Site Tower Market Dynamics & Structure
The global cell site tower market exhibits a moderately concentrated structure, with key players like American Tower, Crown Castle, and Cellnex Telecom holding significant market share. The market is driven by technological advancements such as 5G rollout, the increasing demand for higher bandwidth, and the proliferation of IoT devices. However, regulatory hurdles, stringent environmental regulations, and the availability of alternative infrastructure solutions like small cells and distributed antenna systems (DAS) pose challenges. M&A activity remains a significant feature, with consolidation expected to continue. The study period (2019-2033) has witnessed several multi-billion-dollar deals.
- Market Concentration: The top 5 players hold approximately xx% of the market share in 2025.
- Technological Innovation: 5G deployment is a primary driver, with xx million new 5G towers projected by 2033.
- Regulatory Framework: Varying regulations across regions impact deployment costs and timelines.
- M&A Activity: Over xx billion USD in M&A deals were recorded between 2019 and 2024. This is projected to increase to xx billion USD in the forecast period.
- Competitive Substitutes: Small cells and DAS present competitive alternatives, but tower infrastructure remains dominant.
Cell Site Tower Growth Trends & Insights
The global cell site tower market is experiencing robust growth, fueled by increasing data consumption, expanding network coverage, and the ongoing deployment of 5G networks. The market size, valued at xx million USD in 2025, is projected to reach xx million USD by 2033, exhibiting a CAGR of xx%. This growth is underpinned by higher adoption rates in developing economies, a shift towards densification strategies in urban areas, and the integration of advanced technologies like AI and machine learning for network optimization. Technological disruptions, such as the introduction of new antenna technologies and virtualization, are accelerating this trend. Consumer behavior shifts towards higher bandwidth consumption for video streaming and other data-intensive applications further bolster market expansion.
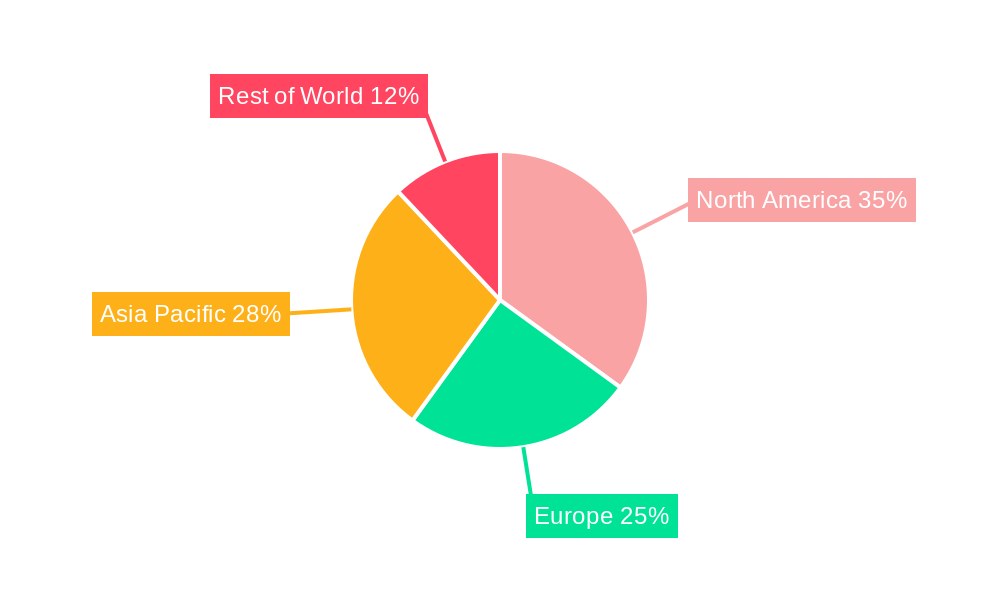
Dominant Regions, Countries, or Segments in Cell Site Tower
North America and Asia-Pacific are leading the market, driven by robust 5G deployments and significant investments in telecommunications infrastructure. Within these regions, countries like the United States, China, and India stand out due to their large populations, expanding digital economies, and favorable regulatory environments.
- North America: Strong regulatory support and high private investment fuel rapid growth. Market share in 2025: xx%.
- Asia-Pacific: High population density and increasing mobile penetration drive demand. Market share in 2025: xx%.
- Europe: Maturing market with steady growth driven by 5G expansion and network modernization. Market share in 2025: xx%.
- Key Drivers: Government initiatives promoting digital infrastructure, rising mobile subscriptions, and increasing investments from telecom operators.
Cell Site Tower Product Landscape
The cell site tower market encompasses various products, including macro towers, co-location sites, and rooftop deployments. Innovation focuses on improved antenna designs for enhanced signal strength and capacity, smart tower technologies for remote monitoring and maintenance, and the integration of energy-efficient solutions to reduce operational costs. The key selling propositions revolve around reliability, scalability, and cost-effectiveness compared to alternative infrastructure solutions.
Key Drivers, Barriers & Challenges in Cell Site Tower
Key Drivers:
- Rapid 5G deployment
- Growing demand for mobile data
- Increasing IoT device connectivity
- Government initiatives promoting digital infrastructure
Key Challenges:
- High initial capital expenditure
- Site acquisition and permitting delays
- Competition from alternative infrastructure solutions (e.g., small cells)
- Supply chain disruptions impacting material availability and costs (estimated impact: xx% increase in tower construction costs in 2024)
Emerging Opportunities in Cell Site Tower
Emerging opportunities include the integration of private 5G networks in industrial settings, the deployment of edge computing infrastructure within towers, and the expansion into underserved rural areas. The increasing adoption of smart city initiatives presents further opportunities for integrating tower infrastructure into broader urban development plans.
Growth Accelerators in the Cell Site Tower Industry
Technological advancements like software-defined networking (SDN) and network function virtualization (NFV) are streamlining network operations and reducing costs, thereby driving growth. Strategic partnerships between tower companies and telecom operators are fostering efficient deployment strategies. Market expansion into emerging economies with growing mobile penetration offers substantial growth potential.
Key Players Shaping the Cell Site Tower Market
- American Tower
- Indus Towers
- Summit Digitel Infrastructure
- Cellnex Telecom
- BSNL Tower Corporation
- Edotco Group (Axiata Group)
- Vantage Towers
- Reliance Infratel
- GD Towers
- Crown Castle
- SBA Communications
- IHS Holding
- Mitratel
- SITES (Sitios Latinoamérica)
- MENA (Ooredoo, Zain, TASC)
- ICOMM
- Insite Towers
- Karamtara
- Rohn Products LLC
- Skipper Limited
- United States Cellular Co.
- Vertical Bridge
- PepperTree Capital
- CTI Towers
- Diamond Communications
- Lendlease/Apollo Infrastructure
- Harmoni Towers
- Phoenix Tower International
Notable Milestones in Cell Site Tower Sector
- 2020: Increased investment in 5G tower infrastructure across multiple regions.
- 2021: Several major M&A deals reshaped the market landscape.
- 2022: Focus on sustainable tower solutions and energy-efficient technologies.
- 2023: Significant growth in private 5G network deployments.
- 2024: Increased adoption of AI and ML for tower management and optimization.
In-Depth Cell Site Tower Market Outlook
The future of the cell site tower market is bright, driven by continued 5G deployment, increasing data consumption, and the emergence of new applications like IoT and edge computing. Strategic partnerships and innovative business models will be key to success in this dynamic sector. The market presents significant opportunities for companies that can adapt to evolving technological advancements and effectively manage regulatory and operational challenges. The focus on sustainability and efficient energy management will also play a crucial role in shaping the future market.
Cell Site Tower Segmentation
-
1. Application
- 1.1. 4G Network
- 1.2. 5G Network
- 1.3. Others
-
2. Types
- 2.1. Macro Cell Site Tower
- 2.2. Micro Cell Site Tower
Cell Site Tower Segmentation By Geography
-
1. North America
- 1.1. United States
- 1.2. Canada
- 1.3. Mexico
-
2. South America
- 2.1. Brazil
- 2.2. Argentina
- 2.3. Rest of South America
-
3. Europe
- 3.1. United Kingdom
- 3.2. Germany
- 3.3. France
- 3.4. Italy
- 3.5. Spain
- 3.6. Russia
- 3.7. Benelux
- 3.8. Nordics
- 3.9. Rest of Europe
-
4. Middle East & Africa
- 4.1. Turkey
- 4.2. Israel
- 4.3. GCC
- 4.4. North Africa
- 4.5. South Africa
- 4.6. Rest of Middle East & Africa
-
5. Asia Pacific
- 5.1. China
- 5.2. India
- 5.3. Japan
- 5.4. South Korea
- 5.5. ASEAN
- 5.6. Oceania
- 5.7. Rest of Asia Pacific
Cell Site Tower Regional Market Share
Geographic Coverage of Cell Site Tower
Cell Site Tower REPORT HIGHLIGHTS
| Aspects | Details |
|---|---|
| Study Period | 2020-2034 |
| Base Year | 2025 |
| Estimated Year | 2026 |
| Forecast Period | 2026-2034 |
| Historical Period | 2020-2025 |
| Growth Rate | CAGR of XX% from 2020-2034 |
| Segmentation |
|
Table of Contents
- 1. Introduction
- 1.1. Research Scope
- 1.2. Market Segmentation
- 1.3. Research Objective
- 1.4. Definitions and Assumptions
- 2. Executive Summary
- 2.1. Market Snapshot
- 3. Market Dynamics
- 3.1. Market Drivers
- 3.2. Market Restrains
- 3.3. Market Trends
- 3.4. Market Opportunities
- 4. Market Factor Analysis
- 4.1. Porters Five Forces
- 4.1.1. Bargaining Power of Suppliers
- 4.1.2. Bargaining Power of Buyers
- 4.1.3. Threat of New Entrants
- 4.1.4. Threat of Substitutes
- 4.1.5. Competitive Rivalry
- 4.2. PESTEL analysis
- 4.3. BCG Analysis
- 4.3.1. Stars (High Growth, High Market Share)
- 4.3.2. Cash Cows (Low Growth, High Market Share)
- 4.3.3. Question Mark (High Growth, Low Market Share)
- 4.3.4. Dogs (Low Growth, Low Market Share)
- 4.4. Ansoff Matrix Analysis
- 4.5. Supply Chain Analysis
- 4.6. Regulatory Landscape
- 4.7. Current Market Potential and Opportunity Assessment (TAM–SAM–SOM Framework)
- 4.8. VDR Analyst Note
- 4.1. Porters Five Forces
- 5. Market Analysis, Insights and Forecast 2021-2033
- 5.1. Market Analysis, Insights and Forecast - by Application
- 5.1.1. 4G Network
- 5.1.2. 5G Network
- 5.1.3. Others
- 5.2. Market Analysis, Insights and Forecast - by Types
- 5.2.1. Macro Cell Site Tower
- 5.2.2. Micro Cell Site Tower
- 5.3. Market Analysis, Insights and Forecast - by Region
- 5.3.1. North America
- 5.3.2. South America
- 5.3.3. Europe
- 5.3.4. Middle East & Africa
- 5.3.5. Asia Pacific
- 5.1. Market Analysis, Insights and Forecast - by Application
- 6. Global Cell Site Tower Analysis, Insights and Forecast, 2021-2033
- 6.1. Market Analysis, Insights and Forecast - by Application
- 6.1.1. 4G Network
- 6.1.2. 5G Network
- 6.1.3. Others
- 6.2. Market Analysis, Insights and Forecast - by Types
- 6.2.1. Macro Cell Site Tower
- 6.2.2. Micro Cell Site Tower
- 6.1. Market Analysis, Insights and Forecast - by Application
- 7. North America Cell Site Tower Analysis, Insights and Forecast, 2021-2033
- 7.1. Market Analysis, Insights and Forecast - by Application
- 7.1.1. 4G Network
- 7.1.2. 5G Network
- 7.1.3. Others
- 7.2. Market Analysis, Insights and Forecast - by Types
- 7.2.1. Macro Cell Site Tower
- 7.2.2. Micro Cell Site Tower
- 7.1. Market Analysis, Insights and Forecast - by Application
- 8. South America Cell Site Tower Analysis, Insights and Forecast, 2021-2033
- 8.1. Market Analysis, Insights and Forecast - by Application
- 8.1.1. 4G Network
- 8.1.2. 5G Network
- 8.1.3. Others
- 8.2. Market Analysis, Insights and Forecast - by Types
- 8.2.1. Macro Cell Site Tower
- 8.2.2. Micro Cell Site Tower
- 8.1. Market Analysis, Insights and Forecast - by Application
- 9. Europe Cell Site Tower Analysis, Insights and Forecast, 2021-2033
- 9.1. Market Analysis, Insights and Forecast - by Application
- 9.1.1. 4G Network
- 9.1.2. 5G Network
- 9.1.3. Others
- 9.2. Market Analysis, Insights and Forecast - by Types
- 9.2.1. Macro Cell Site Tower
- 9.2.2. Micro Cell Site Tower
- 9.1. Market Analysis, Insights and Forecast - by Application
- 10. Middle East & Africa Cell Site Tower Analysis, Insights and Forecast, 2021-2033
- 10.1. Market Analysis, Insights and Forecast - by Application
- 10.1.1. 4G Network
- 10.1.2. 5G Network
- 10.1.3. Others
- 10.2. Market Analysis, Insights and Forecast - by Types
- 10.2.1. Macro Cell Site Tower
- 10.2.2. Micro Cell Site Tower
- 10.1. Market Analysis, Insights and Forecast - by Application
- 11. Asia Pacific Cell Site Tower Analysis, Insights and Forecast, 2021-2033
- 11.1. Market Analysis, Insights and Forecast - by Application
- 11.1.1. 4G Network
- 11.1.2. 5G Network
- 11.1.3. Others
- 11.2. Market Analysis, Insights and Forecast - by Types
- 11.2.1. Macro Cell Site Tower
- 11.2.2. Micro Cell Site Tower
- 11.1. Market Analysis, Insights and Forecast - by Application
- 12. Competitive Analysis
- 12.1. Company Profiles
- 12.1.1 American Tower
- 12.1.1.1. Company Overview
- 12.1.1.2. Products
- 12.1.1.3. Company Financials
- 12.1.1.4. SWOT Analysis
- 12.1.2 Indus Towers
- 12.1.2.1. Company Overview
- 12.1.2.2. Products
- 12.1.2.3. Company Financials
- 12.1.2.4. SWOT Analysis
- 12.1.3 Summit Digitel Infrastructure
- 12.1.3.1. Company Overview
- 12.1.3.2. Products
- 12.1.3.3. Company Financials
- 12.1.3.4. SWOT Analysis
- 12.1.4 Cellnex Telecom
- 12.1.4.1. Company Overview
- 12.1.4.2. Products
- 12.1.4.3. Company Financials
- 12.1.4.4. SWOT Analysis
- 12.1.5 BSNL Tower Corporation
- 12.1.5.1. Company Overview
- 12.1.5.2. Products
- 12.1.5.3. Company Financials
- 12.1.5.4. SWOT Analysis
- 12.1.6 Edotco Group (Axiata Group)
- 12.1.6.1. Company Overview
- 12.1.6.2. Products
- 12.1.6.3. Company Financials
- 12.1.6.4. SWOT Analysis
- 12.1.7 Vantage Towers
- 12.1.7.1. Company Overview
- 12.1.7.2. Products
- 12.1.7.3. Company Financials
- 12.1.7.4. SWOT Analysis
- 12.1.8 Reliance Infratel
- 12.1.8.1. Company Overview
- 12.1.8.2. Products
- 12.1.8.3. Company Financials
- 12.1.8.4. SWOT Analysis
- 12.1.9 GD Towers
- 12.1.9.1. Company Overview
- 12.1.9.2. Products
- 12.1.9.3. Company Financials
- 12.1.9.4. SWOT Analysis
- 12.1.10 Crown Castle
- 12.1.10.1. Company Overview
- 12.1.10.2. Products
- 12.1.10.3. Company Financials
- 12.1.10.4. SWOT Analysis
- 12.1.11 SBA Communications
- 12.1.11.1. Company Overview
- 12.1.11.2. Products
- 12.1.11.3. Company Financials
- 12.1.11.4. SWOT Analysis
- 12.1.12 IHS Holding
- 12.1.12.1. Company Overview
- 12.1.12.2. Products
- 12.1.12.3. Company Financials
- 12.1.12.4. SWOT Analysis
- 12.1.13 Mitratel
- 12.1.13.1. Company Overview
- 12.1.13.2. Products
- 12.1.13.3. Company Financials
- 12.1.13.4. SWOT Analysis
- 12.1.14 SITES (Sitios Latinoamérica)
- 12.1.14.1. Company Overview
- 12.1.14.2. Products
- 12.1.14.3. Company Financials
- 12.1.14.4. SWOT Analysis
- 12.1.15 MENA (Ooredoo
- 12.1.15.1. Company Overview
- 12.1.15.2. Products
- 12.1.15.3. Company Financials
- 12.1.15.4. SWOT Analysis
- 12.1.16 Zain
- 12.1.16.1. Company Overview
- 12.1.16.2. Products
- 12.1.16.3. Company Financials
- 12.1.16.4. SWOT Analysis
- 12.1.17 TASC)
- 12.1.17.1. Company Overview
- 12.1.17.2. Products
- 12.1.17.3. Company Financials
- 12.1.17.4. SWOT Analysis
- 12.1.18 ICOMM
- 12.1.18.1. Company Overview
- 12.1.18.2. Products
- 12.1.18.3. Company Financials
- 12.1.18.4. SWOT Analysis
- 12.1.19 Insite Towers
- 12.1.19.1. Company Overview
- 12.1.19.2. Products
- 12.1.19.3. Company Financials
- 12.1.19.4. SWOT Analysis
- 12.1.20 Karamtara
- 12.1.20.1. Company Overview
- 12.1.20.2. Products
- 12.1.20.3. Company Financials
- 12.1.20.4. SWOT Analysis
- 12.1.21 Rohn Products LLC
- 12.1.21.1. Company Overview
- 12.1.21.2. Products
- 12.1.21.3. Company Financials
- 12.1.21.4. SWOT Analysis
- 12.1.22 Skipper Limited
- 12.1.22.1. Company Overview
- 12.1.22.2. Products
- 12.1.22.3. Company Financials
- 12.1.22.4. SWOT Analysis
- 12.1.23 United States Cellular Co.
- 12.1.23.1. Company Overview
- 12.1.23.2. Products
- 12.1.23.3. Company Financials
- 12.1.23.4. SWOT Analysis
- 12.1.24 Vertical Bridge
- 12.1.24.1. Company Overview
- 12.1.24.2. Products
- 12.1.24.3. Company Financials
- 12.1.24.4. SWOT Analysis
- 12.1.25 PepperTree Capital
- 12.1.25.1. Company Overview
- 12.1.25.2. Products
- 12.1.25.3. Company Financials
- 12.1.25.4. SWOT Analysis
- 12.1.26 CTI Towers
- 12.1.26.1. Company Overview
- 12.1.26.2. Products
- 12.1.26.3. Company Financials
- 12.1.26.4. SWOT Analysis
- 12.1.27 Diamond Communications
- 12.1.27.1. Company Overview
- 12.1.27.2. Products
- 12.1.27.3. Company Financials
- 12.1.27.4. SWOT Analysis
- 12.1.28 Lendlease/Apollo Infrastructure
- 12.1.28.1. Company Overview
- 12.1.28.2. Products
- 12.1.28.3. Company Financials
- 12.1.28.4. SWOT Analysis
- 12.1.29 Harmoni Towers
- 12.1.29.1. Company Overview
- 12.1.29.2. Products
- 12.1.29.3. Company Financials
- 12.1.29.4. SWOT Analysis
- 12.1.30 Phoenix Tower International
- 12.1.30.1. Company Overview
- 12.1.30.2. Products
- 12.1.30.3. Company Financials
- 12.1.30.4. SWOT Analysis
- 12.1.1 American Tower
- 12.2. Market Entropy
- 12.2.1 Company's Key Areas Served
- 12.2.2 Recent Developments
- 12.3. Company Market Share Analysis 2025
- 12.3.1 Top 5 Companies Market Share Analysis
- 12.3.2 Top 3 Companies Market Share Analysis
- 12.4. List of Potential Customers
- 13. Research Methodology
List of Figures
- Figure 1: Global Cell Site Tower Revenue Breakdown (million, %) by Region 2025 & 2033
- Figure 2: Global Cell Site Tower Volume Breakdown (K, %) by Region 2025 & 2033
- Figure 3: North America Cell Site Tower Revenue (million), by Application 2025 & 2033
- Figure 4: North America Cell Site Tower Volume (K), by Application 2025 & 2033
- Figure 5: North America Cell Site Tower Revenue Share (%), by Application 2025 & 2033
- Figure 6: North America Cell Site Tower Volume Share (%), by Application 2025 & 2033
- Figure 7: North America Cell Site Tower Revenue (million), by Types 2025 & 2033
- Figure 8: North America Cell Site Tower Volume (K), by Types 2025 & 2033
- Figure 9: North America Cell Site Tower Revenue Share (%), by Types 2025 & 2033
- Figure 10: North America Cell Site Tower Volume Share (%), by Types 2025 & 2033
- Figure 11: North America Cell Site Tower Revenue (million), by Country 2025 & 2033
- Figure 12: North America Cell Site Tower Volume (K), by Country 2025 & 2033
- Figure 13: North America Cell Site Tower Revenue Share (%), by Country 2025 & 2033
- Figure 14: North America Cell Site Tower Volume Share (%), by Country 2025 & 2033
- Figure 15: South America Cell Site Tower Revenue (million), by Application 2025 & 2033
- Figure 16: South America Cell Site Tower Volume (K), by Application 2025 & 2033
- Figure 17: South America Cell Site Tower Revenue Share (%), by Application 2025 & 2033
- Figure 18: South America Cell Site Tower Volume Share (%), by Application 2025 & 2033
- Figure 19: South America Cell Site Tower Revenue (million), by Types 2025 & 2033
- Figure 20: South America Cell Site Tower Volume (K), by Types 2025 & 2033
- Figure 21: South America Cell Site Tower Revenue Share (%), by Types 2025 & 2033
- Figure 22: South America Cell Site Tower Volume Share (%), by Types 2025 & 2033
- Figure 23: South America Cell Site Tower Revenue (million), by Country 2025 & 2033
- Figure 24: South America Cell Site Tower Volume (K), by Country 2025 & 2033
- Figure 25: South America Cell Site Tower Revenue Share (%), by Country 2025 & 2033
- Figure 26: South America Cell Site Tower Volume Share (%), by Country 2025 & 2033
- Figure 27: Europe Cell Site Tower Revenue (million), by Application 2025 & 2033
- Figure 28: Europe Cell Site Tower Volume (K), by Application 2025 & 2033
- Figure 29: Europe Cell Site Tower Revenue Share (%), by Application 2025 & 2033
- Figure 30: Europe Cell Site Tower Volume Share (%), by Application 2025 & 2033
- Figure 31: Europe Cell Site Tower Revenue (million), by Types 2025 & 2033
- Figure 32: Europe Cell Site Tower Volume (K), by Types 2025 & 2033
- Figure 33: Europe Cell Site Tower Revenue Share (%), by Types 2025 & 2033
- Figure 34: Europe Cell Site Tower Volume Share (%), by Types 2025 & 2033
- Figure 35: Europe Cell Site Tower Revenue (million), by Country 2025 & 2033
- Figure 36: Europe Cell Site Tower Volume (K), by Country 2025 & 2033
- Figure 37: Europe Cell Site Tower Revenue Share (%), by Country 2025 & 2033
- Figure 38: Europe Cell Site Tower Volume Share (%), by Country 2025 & 2033
- Figure 39: Middle East & Africa Cell Site Tower Revenue (million), by Application 2025 & 2033
- Figure 40: Middle East & Africa Cell Site Tower Volume (K), by Application 2025 & 2033
- Figure 41: Middle East & Africa Cell Site Tower Revenue Share (%), by Application 2025 & 2033
- Figure 42: Middle East & Africa Cell Site Tower Volume Share (%), by Application 2025 & 2033
- Figure 43: Middle East & Africa Cell Site Tower Revenue (million), by Types 2025 & 2033
- Figure 44: Middle East & Africa Cell Site Tower Volume (K), by Types 2025 & 2033
- Figure 45: Middle East & Africa Cell Site Tower Revenue Share (%), by Types 2025 & 2033
- Figure 46: Middle East & Africa Cell Site Tower Volume Share (%), by Types 2025 & 2033
- Figure 47: Middle East & Africa Cell Site Tower Revenue (million), by Country 2025 & 2033
- Figure 48: Middle East & Africa Cell Site Tower Volume (K), by Country 2025 & 2033
- Figure 49: Middle East & Africa Cell Site Tower Revenue Share (%), by Country 2025 & 2033
- Figure 50: Middle East & Africa Cell Site Tower Volume Share (%), by Country 2025 & 2033
- Figure 51: Asia Pacific Cell Site Tower Revenue (million), by Application 2025 & 2033
- Figure 52: Asia Pacific Cell Site Tower Volume (K), by Application 2025 & 2033
- Figure 53: Asia Pacific Cell Site Tower Revenue Share (%), by Application 2025 & 2033
- Figure 54: Asia Pacific Cell Site Tower Volume Share (%), by Application 2025 & 2033
- Figure 55: Asia Pacific Cell Site Tower Revenue (million), by Types 2025 & 2033
- Figure 56: Asia Pacific Cell Site Tower Volume (K), by Types 2025 & 2033
- Figure 57: Asia Pacific Cell Site Tower Revenue Share (%), by Types 2025 & 2033
- Figure 58: Asia Pacific Cell Site Tower Volume Share (%), by Types 2025 & 2033
- Figure 59: Asia Pacific Cell Site Tower Revenue (million), by Country 2025 & 2033
- Figure 60: Asia Pacific Cell Site Tower Volume (K), by Country 2025 & 2033
- Figure 61: Asia Pacific Cell Site Tower Revenue Share (%), by Country 2025 & 2033
- Figure 62: Asia Pacific Cell Site Tower Volume Share (%), by Country 2025 & 2033
List of Tables
- Table 1: Global Cell Site Tower Revenue million Forecast, by Application 2020 & 2033
- Table 2: Global Cell Site Tower Volume K Forecast, by Application 2020 & 2033
- Table 3: Global Cell Site Tower Revenue million Forecast, by Types 2020 & 2033
- Table 4: Global Cell Site Tower Volume K Forecast, by Types 2020 & 2033
- Table 5: Global Cell Site Tower Revenue million Forecast, by Region 2020 & 2033
- Table 6: Global Cell Site Tower Volume K Forecast, by Region 2020 & 2033
- Table 7: Global Cell Site Tower Revenue million Forecast, by Application 2020 & 2033
- Table 8: Global Cell Site Tower Volume K Forecast, by Application 2020 & 2033
- Table 9: Global Cell Site Tower Revenue million Forecast, by Types 2020 & 2033
- Table 10: Global Cell Site Tower Volume K Forecast, by Types 2020 & 2033
- Table 11: Global Cell Site Tower Revenue million Forecast, by Country 2020 & 2033
- Table 12: Global Cell Site Tower Volume K Forecast, by Country 2020 & 2033
- Table 13: United States Cell Site Tower Revenue (million) Forecast, by Application 2020 & 2033
- Table 14: United States Cell Site Tower Volume (K) Forecast, by Application 2020 & 2033
- Table 15: Canada Cell Site Tower Revenue (million) Forecast, by Application 2020 & 2033
- Table 16: Canada Cell Site Tower Volume (K) Forecast, by Application 2020 & 2033
- Table 17: Mexico Cell Site Tower Revenue (million) Forecast, by Application 2020 & 2033
- Table 18: Mexico Cell Site Tower Volume (K) Forecast, by Application 2020 & 2033
- Table 19: Global Cell Site Tower Revenue million Forecast, by Application 2020 & 2033
- Table 20: Global Cell Site Tower Volume K Forecast, by Application 2020 & 2033
- Table 21: Global Cell Site Tower Revenue million Forecast, by Types 2020 & 2033
- Table 22: Global Cell Site Tower Volume K Forecast, by Types 2020 & 2033
- Table 23: Global Cell Site Tower Revenue million Forecast, by Country 2020 & 2033
- Table 24: Global Cell Site Tower Volume K Forecast, by Country 2020 & 2033
- Table 25: Brazil Cell Site Tower Revenue (million) Forecast, by Application 2020 & 2033
- Table 26: Brazil Cell Site Tower Volume (K) Forecast, by Application 2020 & 2033
- Table 27: Argentina Cell Site Tower Revenue (million) Forecast, by Application 2020 & 2033
- Table 28: Argentina Cell Site Tower Volume (K) Forecast, by Application 2020 & 2033
- Table 29: Rest of South America Cell Site Tower Revenue (million) Forecast, by Application 2020 & 2033
- Table 30: Rest of South America Cell Site Tower Volume (K) Forecast, by Application 2020 & 2033
- Table 31: Global Cell Site Tower Revenue million Forecast, by Application 2020 & 2033
- Table 32: Global Cell Site Tower Volume K Forecast, by Application 2020 & 2033
- Table 33: Global Cell Site Tower Revenue million Forecast, by Types 2020 & 2033
- Table 34: Global Cell Site Tower Volume K Forecast, by Types 2020 & 2033
- Table 35: Global Cell Site Tower Revenue million Forecast, by Country 2020 & 2033
- Table 36: Global Cell Site Tower Volume K Forecast, by Country 2020 & 2033
- Table 37: United Kingdom Cell Site Tower Revenue (million) Forecast, by Application 2020 & 2033
- Table 38: United Kingdom Cell Site Tower Volume (K) Forecast, by Application 2020 & 2033
- Table 39: Germany Cell Site Tower Revenue (million) Forecast, by Application 2020 & 2033
- Table 40: Germany Cell Site Tower Volume (K) Forecast, by Application 2020 & 2033
- Table 41: France Cell Site Tower Revenue (million) Forecast, by Application 2020 & 2033
- Table 42: France Cell Site Tower Volume (K) Forecast, by Application 2020 & 2033
- Table 43: Italy Cell Site Tower Revenue (million) Forecast, by Application 2020 & 2033
- Table 44: Italy Cell Site Tower Volume (K) Forecast, by Application 2020 & 2033
- Table 45: Spain Cell Site Tower Revenue (million) Forecast, by Application 2020 & 2033
- Table 46: Spain Cell Site Tower Volume (K) Forecast, by Application 2020 & 2033
- Table 47: Russia Cell Site Tower Revenue (million) Forecast, by Application 2020 & 2033
- Table 48: Russia Cell Site Tower Volume (K) Forecast, by Application 2020 & 2033
- Table 49: Benelux Cell Site Tower Revenue (million) Forecast, by Application 2020 & 2033
- Table 50: Benelux Cell Site Tower Volume (K) Forecast, by Application 2020 & 2033
- Table 51: Nordics Cell Site Tower Revenue (million) Forecast, by Application 2020 & 2033
- Table 52: Nordics Cell Site Tower Volume (K) Forecast, by Application 2020 & 2033
- Table 53: Rest of Europe Cell Site Tower Revenue (million) Forecast, by Application 2020 & 2033
- Table 54: Rest of Europe Cell Site Tower Volume (K) Forecast, by Application 2020 & 2033
- Table 55: Global Cell Site Tower Revenue million Forecast, by Application 2020 & 2033
- Table 56: Global Cell Site Tower Volume K Forecast, by Application 2020 & 2033
- Table 57: Global Cell Site Tower Revenue million Forecast, by Types 2020 & 2033
- Table 58: Global Cell Site Tower Volume K Forecast, by Types 2020 & 2033
- Table 59: Global Cell Site Tower Revenue million Forecast, by Country 2020 & 2033
- Table 60: Global Cell Site Tower Volume K Forecast, by Country 2020 & 2033
- Table 61: Turkey Cell Site Tower Revenue (million) Forecast, by Application 2020 & 2033
- Table 62: Turkey Cell Site Tower Volume (K) Forecast, by Application 2020 & 2033
- Table 63: Israel Cell Site Tower Revenue (million) Forecast, by Application 2020 & 2033
- Table 64: Israel Cell Site Tower Volume (K) Forecast, by Application 2020 & 2033
- Table 65: GCC Cell Site Tower Revenue (million) Forecast, by Application 2020 & 2033
- Table 66: GCC Cell Site Tower Volume (K) Forecast, by Application 2020 & 2033
- Table 67: North Africa Cell Site Tower Revenue (million) Forecast, by Application 2020 & 2033
- Table 68: North Africa Cell Site Tower Volume (K) Forecast, by Application 2020 & 2033
- Table 69: South Africa Cell Site Tower Revenue (million) Forecast, by Application 2020 & 2033
- Table 70: South Africa Cell Site Tower Volume (K) Forecast, by Application 2020 & 2033
- Table 71: Rest of Middle East & Africa Cell Site Tower Revenue (million) Forecast, by Application 2020 & 2033
- Table 72: Rest of Middle East & Africa Cell Site Tower Volume (K) Forecast, by Application 2020 & 2033
- Table 73: Global Cell Site Tower Revenue million Forecast, by Application 2020 & 2033
- Table 74: Global Cell Site Tower Volume K Forecast, by Application 2020 & 2033
- Table 75: Global Cell Site Tower Revenue million Forecast, by Types 2020 & 2033
- Table 76: Global Cell Site Tower Volume K Forecast, by Types 2020 & 2033
- Table 77: Global Cell Site Tower Revenue million Forecast, by Country 2020 & 2033
- Table 78: Global Cell Site Tower Volume K Forecast, by Country 2020 & 2033
- Table 79: China Cell Site Tower Revenue (million) Forecast, by Application 2020 & 2033
- Table 80: China Cell Site Tower Volume (K) Forecast, by Application 2020 & 2033
- Table 81: India Cell Site Tower Revenue (million) Forecast, by Application 2020 & 2033
- Table 82: India Cell Site Tower Volume (K) Forecast, by Application 2020 & 2033
- Table 83: Japan Cell Site Tower Revenue (million) Forecast, by Application 2020 & 2033
- Table 84: Japan Cell Site Tower Volume (K) Forecast, by Application 2020 & 2033
- Table 85: South Korea Cell Site Tower Revenue (million) Forecast, by Application 2020 & 2033
- Table 86: South Korea Cell Site Tower Volume (K) Forecast, by Application 2020 & 2033
- Table 87: ASEAN Cell Site Tower Revenue (million) Forecast, by Application 2020 & 2033
- Table 88: ASEAN Cell Site Tower Volume (K) Forecast, by Application 2020 & 2033
- Table 89: Oceania Cell Site Tower Revenue (million) Forecast, by Application 2020 & 2033
- Table 90: Oceania Cell Site Tower Volume (K) Forecast, by Application 2020 & 2033
- Table 91: Rest of Asia Pacific Cell Site Tower Revenue (million) Forecast, by Application 2020 & 2033
- Table 92: Rest of Asia Pacific Cell Site Tower Volume (K) Forecast, by Application 2020 & 2033
Frequently Asked Questions
1. What is the projected Compound Annual Growth Rate (CAGR) of the Cell Site Tower?
The projected CAGR is approximately XX%.
2. Which companies are prominent players in the Cell Site Tower?
Key companies in the market include American Tower, Indus Towers, Summit Digitel Infrastructure, Cellnex Telecom, BSNL Tower Corporation, Edotco Group (Axiata Group), Vantage Towers, Reliance Infratel, GD Towers, Crown Castle, SBA Communications, IHS Holding, Mitratel, SITES (Sitios Latinoamérica), MENA (Ooredoo, Zain, TASC), ICOMM, Insite Towers, Karamtara, Rohn Products LLC, Skipper Limited, United States Cellular Co., Vertical Bridge, PepperTree Capital, CTI Towers, Diamond Communications, Lendlease/Apollo Infrastructure, Harmoni Towers, Phoenix Tower International.
3. What are the main segments of the Cell Site Tower?
The market segments include Application, Types.
4. Can you provide details about the market size?
The market size is estimated to be USD XXX million as of 2022.
5. What are some drivers contributing to market growth?
N/A
6. What are the notable trends driving market growth?
N/A
7. Are there any restraints impacting market growth?
N/A
8. Can you provide examples of recent developments in the market?
N/A
9. What pricing options are available for accessing the report?
Pricing options include single-user, multi-user, and enterprise licenses priced at USD 3350.00, USD 5025.00, and USD 6700.00 respectively.
10. Is the market size provided in terms of value or volume?
The market size is provided in terms of value, measured in million and volume, measured in K.
11. Are there any specific market keywords associated with the report?
Yes, the market keyword associated with the report is "Cell Site Tower," which aids in identifying and referencing the specific market segment covered.
12. How do I determine which pricing option suits my needs best?
The pricing options vary based on user requirements and access needs. Individual users may opt for single-user licenses, while businesses requiring broader access may choose multi-user or enterprise licenses for cost-effective access to the report.
13. Are there any additional resources or data provided in the Cell Site Tower report?
While the report offers comprehensive insights, it's advisable to review the specific contents or supplementary materials provided to ascertain if additional resources or data are available.
14. How can I stay updated on further developments or reports in the Cell Site Tower?
To stay informed about further developments, trends, and reports in the Cell Site Tower, consider subscribing to industry newsletters, following relevant companies and organizations, or regularly checking reputable industry news sources and publications.
Methodology
Step 1 - Identification of Relevant Samples Size from Population Database


Step 2 - Approaches for Defining Global Market Size (Value, Volume* & Price*)

Note*: In applicable scenarios
Step 3 - Data Sources
Primary Research
- Web Analytics
- Survey Reports
- Research Institute
- Latest Research Reports
- Opinion Leaders
Secondary Research
- Annual Reports
- White Paper
- Latest Press Release
- Industry Association
- Paid Database
- Investor Presentations

Step 4 - Data Triangulation
Involves using different sources of information in order to increase the validity of a study
These sources are likely to be stakeholders in a program - participants, other researchers, program staff, other community members, and so on.
Then we put all data in single framework & apply various statistical tools to find out the dynamic on the market.
During the analysis stage, feedback from the stakeholder groups would be compared to determine areas of agreement as well as areas of divergence