
Key Insights
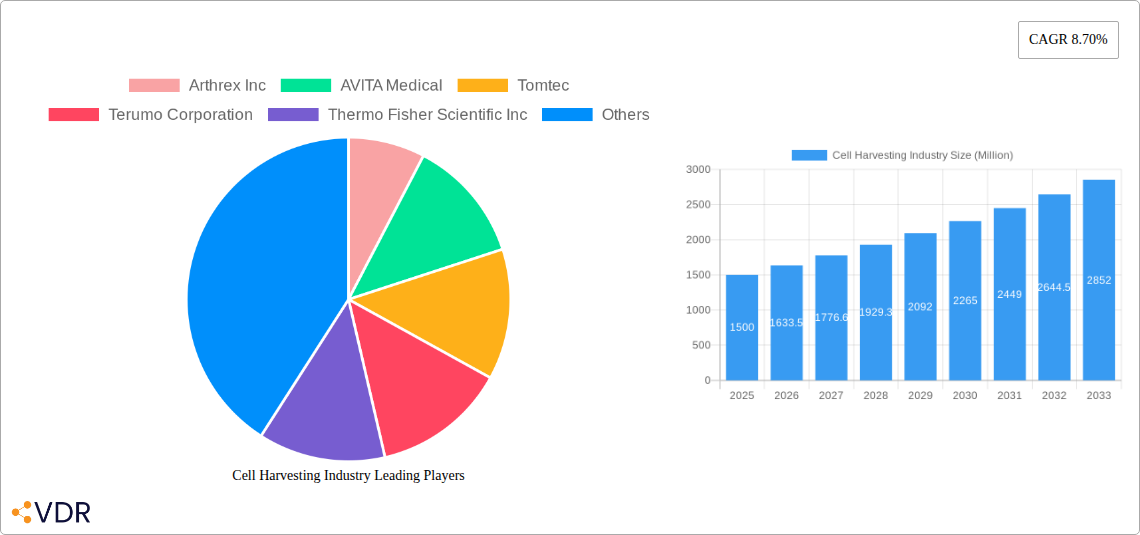
The global cell harvesting market is experiencing robust growth, projected to reach a substantial size by 2033. Driven by the expanding biopharmaceutical and stem cell research sectors, the market is witnessing significant demand for both manual and automated cell harvesting systems. The increasing prevalence of chronic diseases and the consequent surge in demand for cell-based therapies are key factors fueling this growth. Furthermore, technological advancements leading to improved efficiency, automation, and reduced costs associated with cell harvesting are contributing to market expansion. The rise in personalized medicine, along with the growing adoption of regenerative medicine approaches, is further strengthening the market's trajectory. North America and Europe currently dominate the market, benefiting from well-established research infrastructure and regulatory frameworks. However, the Asia-Pacific region is anticipated to demonstrate substantial growth in the coming years, driven by rising investments in healthcare infrastructure and a growing awareness of advanced therapeutic modalities. Competition in this market is intense, with a diverse range of established players and emerging companies vying for market share. This competition is driving innovation and improving the quality and affordability of cell harvesting technologies.
While the manual cell harvesting segment currently holds a larger market share due to its lower initial investment cost, the automated cell harvesting segment is experiencing faster growth due to its higher throughput and reduced risk of contamination. This trend is expected to continue as advancements in automation and the growing need for high-volume cell processing drive adoption in large-scale biopharmaceutical manufacturing. The application of cell harvesting in biopharmaceutical applications remains the most significant driver, followed by stem cell research. However, expansion into other applications, such as regenerative medicine and cancer treatment, is expected to contribute significantly to market growth in the forecast period. Regulatory challenges and the high cost of equipment and consumables remain potential restraints, but ongoing technological advancements and the expanding application areas are expected to mitigate these challenges over the long term. The continued focus on improving the efficiency and scalability of cell harvesting technologies promises to further unlock the therapeutic potential of cell-based therapies and drive market growth.
Cell Harvesting Industry Market Report: 2019-2033
This comprehensive report provides an in-depth analysis of the Cell Harvesting Industry, encompassing market dynamics, growth trends, regional segmentation, product landscape, key players, and future outlook. The report covers the period from 2019 to 2033, with a focus on the forecast period from 2025 to 2033 and a base year of 2025. The market is segmented by end-user (Biotechnology and Biopharmaceutical Companies, Research Institutes, Other End-Users), type of cell harvesting (Manual Cell Harvesters, Automated Cell Harvesters), and application (Biopharmaceutical Application, Stem Cell Research, Other Applications). Key players analyzed include Arthrex Inc, AVITA Medical, Tomtec, Terumo Corporation, Thermo Fisher Scientific Inc, Esco Lifesciences Group, Eurofins Scientific, Sartorius AG, Danaher Corporation, Cox Scientific Ltd, Alcami Corporation, and Perkin Elmer Inc. The report projects a market size of xx Million units in 2025, demonstrating significant growth potential across various segments.
Cell Harvesting Industry Market Dynamics & Structure
The global cell harvesting market is characterized by moderate concentration, with a few major players dominating the automated cell harvester segment while a larger number of smaller companies compete in the manual cell harvester segment. Technological innovation, particularly in automation and single-use technologies, is a key driver. Stringent regulatory frameworks governing the use of cell-based therapies impact market growth and necessitate compliance. Competitive substitutes include alternative cell processing methods, posing a challenge to market expansion. The end-user demographic is expanding with increased investment in biopharmaceutical research and development, as well as the growing popularity of regenerative medicine. M&A activity within the industry has been moderate in recent years, with a focus on strengthening capabilities and expanding market reach.
- Market Concentration: Moderately concentrated, with leading players holding xx% market share in 2025.
- Technological Innovation: Driven by advancements in automation, single-use systems, and microfluidics.
- Regulatory Landscape: Stringent regulations in major markets, impacting product development and market entry.
- Competitive Substitutes: Alternative cell processing methods, posing a competitive threat.
- M&A Activity: Moderate level of mergers and acquisitions, focused on technology integration and market expansion. XX major deals recorded in the past five years.
- Innovation Barriers: High regulatory hurdles and substantial R&D investment required.
Cell Harvesting Industry Growth Trends & Insights
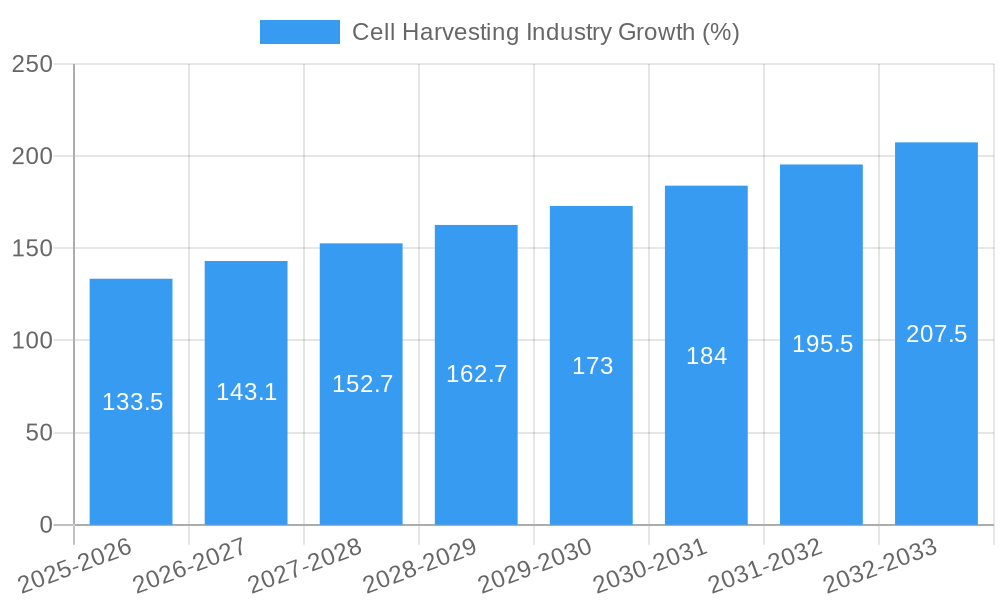
The cell harvesting market exhibits robust growth, driven by the increasing demand for cell-based therapies, rising research and development activities in the biopharmaceutical industry, and ongoing advancements in cell harvesting technologies. The market size is projected to grow at a CAGR of xx% during the forecast period (2025-2033), reaching xx Million units by 2033. This growth is fueled by rising adoption of automated cell harvesting systems, increasing prevalence of chronic diseases requiring cell-based therapies, and substantial investments in research and development of novel cell therapies. Technological disruptions such as the introduction of single-use systems and microfluidic devices are accelerating market adoption and improving efficiency. The market is witnessing a shift towards automated solutions due to the increasing demand for high-throughput and consistent cell harvesting.
- Market Size Evolution: Significant growth from 2019 to 2024, with projected accelerated growth during 2025-2033.
- Adoption Rate: Growing adoption of automated systems, particularly in large-scale bioprocessing.
- Technological Disruptions: Single-use systems and microfluidic technologies are transforming market dynamics.
- Consumer Behavior Shifts: Increased preference for automated, high-throughput solutions, driven by efficiency and consistency.
Dominant Regions, Countries, or Segments in Cell Harvesting Industry
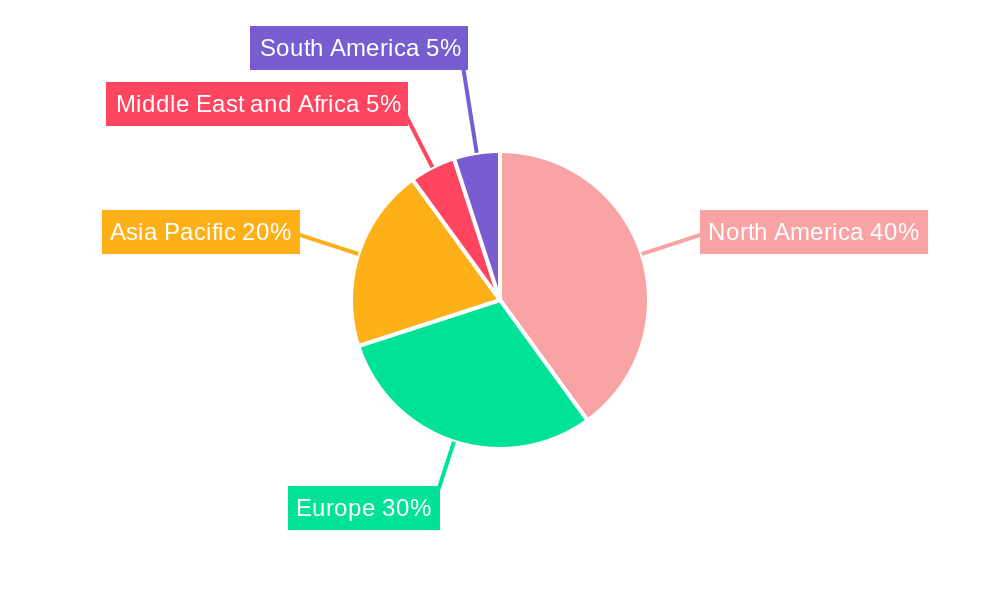
North America currently dominates the cell harvesting market, driven by strong investments in biotechnology and biopharmaceutical research, favorable regulatory environments, and a high concentration of key players. Europe follows as a significant market, fueled by government initiatives supporting cell therapy research and development. The Biopharmaceutical Application segment shows the highest growth potential, followed by Stem Cell Research. Automated cell harvesters hold a larger market share compared to manual harvesters due to higher throughput and efficiency.
- Key Drivers: High R&D investment, favorable regulatory environments, and growing prevalence of chronic diseases (North America).
- Market Share: North America holds the largest market share (xx%), followed by Europe (xx%).
- Growth Potential: Highest growth potential observed in the Biopharmaceutical Application segment, driven by increasing demand for cell-based therapies.
- Dominant Segments: Automated cell harvesters and the biopharmaceutical application segment.
Cell Harvesting Industry Product Landscape
The cell harvesting market offers a range of products, including manual and automated cell harvesters, along with ancillary equipment and consumables. Recent advancements focus on single-use systems to minimize contamination risks and streamline the harvesting process. Automated systems offer high throughput, precision, and reproducibility, while manual systems are often preferred for smaller-scale operations or specialized applications. Key performance metrics include processing speed, yield, cell viability, and sterility. Unique selling propositions include enhanced automation, reduced processing times, improved cell viability, and ease of use.
Key Drivers, Barriers & Challenges in Cell Harvesting Industry
Key Drivers:
- Increasing demand for cell-based therapies.
- Rising investments in biopharmaceutical R&D.
- Technological advancements in automation and single-use systems.
- Favorable regulatory environments in key markets.
Key Challenges:
- High initial investment costs for automated systems.
- Stringent regulatory hurdles for product approval and market access.
- Potential supply chain disruptions affecting the availability of consumables and components.
- Intense competition among established players and emerging companies. This leads to price pressures and impacts profit margins by approximately xx%.
Emerging Opportunities in Cell Harvesting Industry
- Expanding applications of cell harvesting in personalized medicine.
- Growing demand for point-of-care cell harvesting solutions.
- Development of novel harvesting technologies for specific cell types.
- Increasing adoption of artificial intelligence (AI) and machine learning (ML) in cell harvesting processes.
Growth Accelerators in the Cell Harvesting Industry
Technological breakthroughs, such as the development of advanced automation and single-use systems, are significantly accelerating the growth of the cell harvesting industry. Strategic partnerships between technology providers and biopharmaceutical companies facilitate innovation and market penetration. Expanding into emerging markets with unmet medical needs also offers substantial growth opportunities.
Key Players Shaping the Cell Harvesting Industry Market
- Arthrex Inc
- AVITA Medical
- Tomtec
- Terumo Corporation
- Thermo Fisher Scientific Inc
- Esco Lifesciences Group
- Eurofins Scientific
- Sartorius AG
- Danaher Corporation
- Cox Scientific Ltd
- Alcami Corporation
- Perkin Elmer Inc
Notable Milestones in Cell Harvesting Industry Sector
- October 2022: Thermo Fisher Scientific launched the DynaSpin Single-Use Centrifuge system, improving large-scale cell culture harvesting efficiency.
- June 2022: Researchers developed a 3D-printed microfluidic stem cell harvester, offering a scalable and cost-effective solution for stem cell processing.
In-Depth Cell Harvesting Industry Market Outlook
The cell harvesting market is poised for sustained growth, driven by technological advancements, increasing adoption of cell-based therapies, and expansion into new applications. Strategic partnerships and investments in R&D will continue to shape market dynamics. The focus on automation and single-use technologies will further drive efficiency and reduce costs, making cell harvesting accessible to a broader range of end-users. The market's future potential lies in personalized medicine, point-of-care diagnostics, and the development of advanced cell processing techniques.
Cell Harvesting Industry Segmentation
-
1. Type of Cell Harvesting
- 1.1. Manual Cell Harvesters
- 1.2. Automated Cell Harvesters
-
2. Application
- 2.1. Biopharmaceutical Application
- 2.2. Stem Cell Research
- 2.3. Other Applications
-
3. End User
- 3.1. Biotechnology and Biopharmaceutical Companies
- 3.2. Research Institutes
- 3.3. Other End Users
Cell Harvesting Industry Segmentation By Geography
-
1. North America
- 1.1. United States
- 1.2. Canada
- 1.3. Mexico
-
2. Europe
- 2.1. Germany
- 2.2. United Kingdom
- 2.3. France
- 2.4. Italy
- 2.5. Spain
- 2.6. Rest of Europe
-
3. Asia Pacific
- 3.1. China
- 3.2. Japan
- 3.3. India
- 3.4. Australia
- 3.5. South Korea
- 3.6. Rest of Asia Pacific
-
4. Middle East and Africa
- 4.1. GCC
- 4.2. South Africa
- 4.3. Rest of Middle East and Africa
-
5. South America
- 5.1. Brazil
- 5.2. Argentina
- 5.3. Rest of South America
Cell Harvesting Industry REPORT HIGHLIGHTS
| Aspects | Details |
|---|---|
| Study Period | 2019-2033 |
| Base Year | 2024 |
| Estimated Year | 2025 |
| Forecast Period | 2025-2033 |
| Historical Period | 2019-2024 |
| Growth Rate | CAGR of 8.70% from 2019-2033 |
| Segmentation |
|
Table of Contents
- 1. Introduction
- 1.1. Research Scope
- 1.2. Market Segmentation
- 1.3. Research Methodology
- 1.4. Definitions and Assumptions
- 2. Executive Summary
- 2.1. Introduction
- 3. Market Dynamics
- 3.1. Introduction
- 3.2. Market Drivers
- 3.2.1. Rising Investments in Regenerative Medicine and Cell-based Research; Growth of the Biotechnology and Biopharmaceutical Industries; Increasing Incidence of Chronic and Infectious Diseases
- 3.3. Market Restrains
- 3.3.1. Ethical Issues pertaining to Embryonic Stem Cell Research
- 3.4. Market Trends
- 3.4.1. Stem Cell Research Segment Expects to Register a Significant CAGR Over the Forecast Period
- 4. Market Factor Analysis
- 4.1. Porters Five Forces
- 4.2. Supply/Value Chain
- 4.3. PESTEL analysis
- 4.4. Market Entropy
- 4.5. Patent/Trademark Analysis
- 5. Global Cell Harvesting Industry Analysis, Insights and Forecast, 2019-2031
- 5.1. Market Analysis, Insights and Forecast - by Type of Cell Harvesting
- 5.1.1. Manual Cell Harvesters
- 5.1.2. Automated Cell Harvesters
- 5.2. Market Analysis, Insights and Forecast - by Application
- 5.2.1. Biopharmaceutical Application
- 5.2.2. Stem Cell Research
- 5.2.3. Other Applications
- 5.3. Market Analysis, Insights and Forecast - by End User
- 5.3.1. Biotechnology and Biopharmaceutical Companies
- 5.3.2. Research Institutes
- 5.3.3. Other End Users
- 5.4. Market Analysis, Insights and Forecast - by Region
- 5.4.1. North America
- 5.4.2. Europe
- 5.4.3. Asia Pacific
- 5.4.4. Middle East and Africa
- 5.4.5. South America
- 5.1. Market Analysis, Insights and Forecast - by Type of Cell Harvesting
- 6. North America Cell Harvesting Industry Analysis, Insights and Forecast, 2019-2031
- 6.1. Market Analysis, Insights and Forecast - by Type of Cell Harvesting
- 6.1.1. Manual Cell Harvesters
- 6.1.2. Automated Cell Harvesters
- 6.2. Market Analysis, Insights and Forecast - by Application
- 6.2.1. Biopharmaceutical Application
- 6.2.2. Stem Cell Research
- 6.2.3. Other Applications
- 6.3. Market Analysis, Insights and Forecast - by End User
- 6.3.1. Biotechnology and Biopharmaceutical Companies
- 6.3.2. Research Institutes
- 6.3.3. Other End Users
- 6.1. Market Analysis, Insights and Forecast - by Type of Cell Harvesting
- 7. Europe Cell Harvesting Industry Analysis, Insights and Forecast, 2019-2031
- 7.1. Market Analysis, Insights and Forecast - by Type of Cell Harvesting
- 7.1.1. Manual Cell Harvesters
- 7.1.2. Automated Cell Harvesters
- 7.2. Market Analysis, Insights and Forecast - by Application
- 7.2.1. Biopharmaceutical Application
- 7.2.2. Stem Cell Research
- 7.2.3. Other Applications
- 7.3. Market Analysis, Insights and Forecast - by End User
- 7.3.1. Biotechnology and Biopharmaceutical Companies
- 7.3.2. Research Institutes
- 7.3.3. Other End Users
- 7.1. Market Analysis, Insights and Forecast - by Type of Cell Harvesting
- 8. Asia Pacific Cell Harvesting Industry Analysis, Insights and Forecast, 2019-2031
- 8.1. Market Analysis, Insights and Forecast - by Type of Cell Harvesting
- 8.1.1. Manual Cell Harvesters
- 8.1.2. Automated Cell Harvesters
- 8.2. Market Analysis, Insights and Forecast - by Application
- 8.2.1. Biopharmaceutical Application
- 8.2.2. Stem Cell Research
- 8.2.3. Other Applications
- 8.3. Market Analysis, Insights and Forecast - by End User
- 8.3.1. Biotechnology and Biopharmaceutical Companies
- 8.3.2. Research Institutes
- 8.3.3. Other End Users
- 8.1. Market Analysis, Insights and Forecast - by Type of Cell Harvesting
- 9. Middle East and Africa Cell Harvesting Industry Analysis, Insights and Forecast, 2019-2031
- 9.1. Market Analysis, Insights and Forecast - by Type of Cell Harvesting
- 9.1.1. Manual Cell Harvesters
- 9.1.2. Automated Cell Harvesters
- 9.2. Market Analysis, Insights and Forecast - by Application
- 9.2.1. Biopharmaceutical Application
- 9.2.2. Stem Cell Research
- 9.2.3. Other Applications
- 9.3. Market Analysis, Insights and Forecast - by End User
- 9.3.1. Biotechnology and Biopharmaceutical Companies
- 9.3.2. Research Institutes
- 9.3.3. Other End Users
- 9.1. Market Analysis, Insights and Forecast - by Type of Cell Harvesting
- 10. South America Cell Harvesting Industry Analysis, Insights and Forecast, 2019-2031
- 10.1. Market Analysis, Insights and Forecast - by Type of Cell Harvesting
- 10.1.1. Manual Cell Harvesters
- 10.1.2. Automated Cell Harvesters
- 10.2. Market Analysis, Insights and Forecast - by Application
- 10.2.1. Biopharmaceutical Application
- 10.2.2. Stem Cell Research
- 10.2.3. Other Applications
- 10.3. Market Analysis, Insights and Forecast - by End User
- 10.3.1. Biotechnology and Biopharmaceutical Companies
- 10.3.2. Research Institutes
- 10.3.3. Other End Users
- 10.1. Market Analysis, Insights and Forecast - by Type of Cell Harvesting
- 11. North America Cell Harvesting Industry Analysis, Insights and Forecast, 2019-2031
- 11.1. Market Analysis, Insights and Forecast - By Country/Sub-region
- 11.1.1. undefined
- 12. Europe Cell Harvesting Industry Analysis, Insights and Forecast, 2019-2031
- 12.1. Market Analysis, Insights and Forecast - By Country/Sub-region
- 12.1.1. undefined
- 13. Asia Pacific Cell Harvesting Industry Analysis, Insights and Forecast, 2019-2031
- 13.1. Market Analysis, Insights and Forecast - By Country/Sub-region
- 13.1.1. undefined
- 14. Middle East and Africa Cell Harvesting Industry Analysis, Insights and Forecast, 2019-2031
- 14.1. Market Analysis, Insights and Forecast - By Country/Sub-region
- 14.1.1. undefined
- 15. South America Cell Harvesting Industry Analysis, Insights and Forecast, 2019-2031
- 15.1. Market Analysis, Insights and Forecast - By Country/Sub-region
- 15.1.1. undefined
- 16. Competitive Analysis
- 16.1. Global Market Share Analysis 2024
- 16.2. Company Profiles
- 16.2.1 Arthrex Inc
- 16.2.1.1. Overview
- 16.2.1.2. Products
- 16.2.1.3. SWOT Analysis
- 16.2.1.4. Recent Developments
- 16.2.1.5. Financials (Based on Availability)
- 16.2.2 AVITA Medical
- 16.2.2.1. Overview
- 16.2.2.2. Products
- 16.2.2.3. SWOT Analysis
- 16.2.2.4. Recent Developments
- 16.2.2.5. Financials (Based on Availability)
- 16.2.3 Tomtec
- 16.2.3.1. Overview
- 16.2.3.2. Products
- 16.2.3.3. SWOT Analysis
- 16.2.3.4. Recent Developments
- 16.2.3.5. Financials (Based on Availability)
- 16.2.4 Terumo Corporation
- 16.2.4.1. Overview
- 16.2.4.2. Products
- 16.2.4.3. SWOT Analysis
- 16.2.4.4. Recent Developments
- 16.2.4.5. Financials (Based on Availability)
- 16.2.5 Thermo Fisher Scientific Inc
- 16.2.5.1. Overview
- 16.2.5.2. Products
- 16.2.5.3. SWOT Analysis
- 16.2.5.4. Recent Developments
- 16.2.5.5. Financials (Based on Availability)
- 16.2.6 Esco Lifesciences Group
- 16.2.6.1. Overview
- 16.2.6.2. Products
- 16.2.6.3. SWOT Analysis
- 16.2.6.4. Recent Developments
- 16.2.6.5. Financials (Based on Availability)
- 16.2.7 Eurofins Scientific
- 16.2.7.1. Overview
- 16.2.7.2. Products
- 16.2.7.3. SWOT Analysis
- 16.2.7.4. Recent Developments
- 16.2.7.5. Financials (Based on Availability)
- 16.2.8 Sartorius AG
- 16.2.8.1. Overview
- 16.2.8.2. Products
- 16.2.8.3. SWOT Analysis
- 16.2.8.4. Recent Developments
- 16.2.8.5. Financials (Based on Availability)
- 16.2.9 Danaher Corporation
- 16.2.9.1. Overview
- 16.2.9.2. Products
- 16.2.9.3. SWOT Analysis
- 16.2.9.4. Recent Developments
- 16.2.9.5. Financials (Based on Availability)
- 16.2.10 Cox Scientific Ltd
- 16.2.10.1. Overview
- 16.2.10.2. Products
- 16.2.10.3. SWOT Analysis
- 16.2.10.4. Recent Developments
- 16.2.10.5. Financials (Based on Availability)
- 16.2.11 Alcami Corporation
- 16.2.11.1. Overview
- 16.2.11.2. Products
- 16.2.11.3. SWOT Analysis
- 16.2.11.4. Recent Developments
- 16.2.11.5. Financials (Based on Availability)
- 16.2.12 Perkin Elmer Inc
- 16.2.12.1. Overview
- 16.2.12.2. Products
- 16.2.12.3. SWOT Analysis
- 16.2.12.4. Recent Developments
- 16.2.12.5. Financials (Based on Availability)
- 16.2.1 Arthrex Inc
List of Figures
- Figure 1: Global Cell Harvesting Industry Revenue Breakdown (Million, %) by Region 2024 & 2032
- Figure 2: Global Cell Harvesting Industry Volume Breakdown (K Unit, %) by Region 2024 & 2032
- Figure 3: North America Cell Harvesting Industry Revenue (Million), by Country 2024 & 2032
- Figure 4: North America Cell Harvesting Industry Volume (K Unit), by Country 2024 & 2032
- Figure 5: North America Cell Harvesting Industry Revenue Share (%), by Country 2024 & 2032
- Figure 6: North America Cell Harvesting Industry Volume Share (%), by Country 2024 & 2032
- Figure 7: Europe Cell Harvesting Industry Revenue (Million), by Country 2024 & 2032
- Figure 8: Europe Cell Harvesting Industry Volume (K Unit), by Country 2024 & 2032
- Figure 9: Europe Cell Harvesting Industry Revenue Share (%), by Country 2024 & 2032
- Figure 10: Europe Cell Harvesting Industry Volume Share (%), by Country 2024 & 2032
- Figure 11: Asia Pacific Cell Harvesting Industry Revenue (Million), by Country 2024 & 2032
- Figure 12: Asia Pacific Cell Harvesting Industry Volume (K Unit), by Country 2024 & 2032
- Figure 13: Asia Pacific Cell Harvesting Industry Revenue Share (%), by Country 2024 & 2032
- Figure 14: Asia Pacific Cell Harvesting Industry Volume Share (%), by Country 2024 & 2032
- Figure 15: Middle East and Africa Cell Harvesting Industry Revenue (Million), by Country 2024 & 2032
- Figure 16: Middle East and Africa Cell Harvesting Industry Volume (K Unit), by Country 2024 & 2032
- Figure 17: Middle East and Africa Cell Harvesting Industry Revenue Share (%), by Country 2024 & 2032
- Figure 18: Middle East and Africa Cell Harvesting Industry Volume Share (%), by Country 2024 & 2032
- Figure 19: South America Cell Harvesting Industry Revenue (Million), by Country 2024 & 2032
- Figure 20: South America Cell Harvesting Industry Volume (K Unit), by Country 2024 & 2032
- Figure 21: South America Cell Harvesting Industry Revenue Share (%), by Country 2024 & 2032
- Figure 22: South America Cell Harvesting Industry Volume Share (%), by Country 2024 & 2032
- Figure 23: North America Cell Harvesting Industry Revenue (Million), by Type of Cell Harvesting 2024 & 2032
- Figure 24: North America Cell Harvesting Industry Volume (K Unit), by Type of Cell Harvesting 2024 & 2032
- Figure 25: North America Cell Harvesting Industry Revenue Share (%), by Type of Cell Harvesting 2024 & 2032
- Figure 26: North America Cell Harvesting Industry Volume Share (%), by Type of Cell Harvesting 2024 & 2032
- Figure 27: North America Cell Harvesting Industry Revenue (Million), by Application 2024 & 2032
- Figure 28: North America Cell Harvesting Industry Volume (K Unit), by Application 2024 & 2032
- Figure 29: North America Cell Harvesting Industry Revenue Share (%), by Application 2024 & 2032
- Figure 30: North America Cell Harvesting Industry Volume Share (%), by Application 2024 & 2032
- Figure 31: North America Cell Harvesting Industry Revenue (Million), by End User 2024 & 2032
- Figure 32: North America Cell Harvesting Industry Volume (K Unit), by End User 2024 & 2032
- Figure 33: North America Cell Harvesting Industry Revenue Share (%), by End User 2024 & 2032
- Figure 34: North America Cell Harvesting Industry Volume Share (%), by End User 2024 & 2032
- Figure 35: North America Cell Harvesting Industry Revenue (Million), by Country 2024 & 2032
- Figure 36: North America Cell Harvesting Industry Volume (K Unit), by Country 2024 & 2032
- Figure 37: North America Cell Harvesting Industry Revenue Share (%), by Country 2024 & 2032
- Figure 38: North America Cell Harvesting Industry Volume Share (%), by Country 2024 & 2032
- Figure 39: Europe Cell Harvesting Industry Revenue (Million), by Type of Cell Harvesting 2024 & 2032
- Figure 40: Europe Cell Harvesting Industry Volume (K Unit), by Type of Cell Harvesting 2024 & 2032
- Figure 41: Europe Cell Harvesting Industry Revenue Share (%), by Type of Cell Harvesting 2024 & 2032
- Figure 42: Europe Cell Harvesting Industry Volume Share (%), by Type of Cell Harvesting 2024 & 2032
- Figure 43: Europe Cell Harvesting Industry Revenue (Million), by Application 2024 & 2032
- Figure 44: Europe Cell Harvesting Industry Volume (K Unit), by Application 2024 & 2032
- Figure 45: Europe Cell Harvesting Industry Revenue Share (%), by Application 2024 & 2032
- Figure 46: Europe Cell Harvesting Industry Volume Share (%), by Application 2024 & 2032
- Figure 47: Europe Cell Harvesting Industry Revenue (Million), by End User 2024 & 2032
- Figure 48: Europe Cell Harvesting Industry Volume (K Unit), by End User 2024 & 2032
- Figure 49: Europe Cell Harvesting Industry Revenue Share (%), by End User 2024 & 2032
- Figure 50: Europe Cell Harvesting Industry Volume Share (%), by End User 2024 & 2032
- Figure 51: Europe Cell Harvesting Industry Revenue (Million), by Country 2024 & 2032
- Figure 52: Europe Cell Harvesting Industry Volume (K Unit), by Country 2024 & 2032
- Figure 53: Europe Cell Harvesting Industry Revenue Share (%), by Country 2024 & 2032
- Figure 54: Europe Cell Harvesting Industry Volume Share (%), by Country 2024 & 2032
- Figure 55: Asia Pacific Cell Harvesting Industry Revenue (Million), by Type of Cell Harvesting 2024 & 2032
- Figure 56: Asia Pacific Cell Harvesting Industry Volume (K Unit), by Type of Cell Harvesting 2024 & 2032
- Figure 57: Asia Pacific Cell Harvesting Industry Revenue Share (%), by Type of Cell Harvesting 2024 & 2032
- Figure 58: Asia Pacific Cell Harvesting Industry Volume Share (%), by Type of Cell Harvesting 2024 & 2032
- Figure 59: Asia Pacific Cell Harvesting Industry Revenue (Million), by Application 2024 & 2032
- Figure 60: Asia Pacific Cell Harvesting Industry Volume (K Unit), by Application 2024 & 2032
- Figure 61: Asia Pacific Cell Harvesting Industry Revenue Share (%), by Application 2024 & 2032
- Figure 62: Asia Pacific Cell Harvesting Industry Volume Share (%), by Application 2024 & 2032
- Figure 63: Asia Pacific Cell Harvesting Industry Revenue (Million), by End User 2024 & 2032
- Figure 64: Asia Pacific Cell Harvesting Industry Volume (K Unit), by End User 2024 & 2032
- Figure 65: Asia Pacific Cell Harvesting Industry Revenue Share (%), by End User 2024 & 2032
- Figure 66: Asia Pacific Cell Harvesting Industry Volume Share (%), by End User 2024 & 2032
- Figure 67: Asia Pacific Cell Harvesting Industry Revenue (Million), by Country 2024 & 2032
- Figure 68: Asia Pacific Cell Harvesting Industry Volume (K Unit), by Country 2024 & 2032
- Figure 69: Asia Pacific Cell Harvesting Industry Revenue Share (%), by Country 2024 & 2032
- Figure 70: Asia Pacific Cell Harvesting Industry Volume Share (%), by Country 2024 & 2032
- Figure 71: Middle East and Africa Cell Harvesting Industry Revenue (Million), by Type of Cell Harvesting 2024 & 2032
- Figure 72: Middle East and Africa Cell Harvesting Industry Volume (K Unit), by Type of Cell Harvesting 2024 & 2032
- Figure 73: Middle East and Africa Cell Harvesting Industry Revenue Share (%), by Type of Cell Harvesting 2024 & 2032
- Figure 74: Middle East and Africa Cell Harvesting Industry Volume Share (%), by Type of Cell Harvesting 2024 & 2032
- Figure 75: Middle East and Africa Cell Harvesting Industry Revenue (Million), by Application 2024 & 2032
- Figure 76: Middle East and Africa Cell Harvesting Industry Volume (K Unit), by Application 2024 & 2032
- Figure 77: Middle East and Africa Cell Harvesting Industry Revenue Share (%), by Application 2024 & 2032
- Figure 78: Middle East and Africa Cell Harvesting Industry Volume Share (%), by Application 2024 & 2032
- Figure 79: Middle East and Africa Cell Harvesting Industry Revenue (Million), by End User 2024 & 2032
- Figure 80: Middle East and Africa Cell Harvesting Industry Volume (K Unit), by End User 2024 & 2032
- Figure 81: Middle East and Africa Cell Harvesting Industry Revenue Share (%), by End User 2024 & 2032
- Figure 82: Middle East and Africa Cell Harvesting Industry Volume Share (%), by End User 2024 & 2032
- Figure 83: Middle East and Africa Cell Harvesting Industry Revenue (Million), by Country 2024 & 2032
- Figure 84: Middle East and Africa Cell Harvesting Industry Volume (K Unit), by Country 2024 & 2032
- Figure 85: Middle East and Africa Cell Harvesting Industry Revenue Share (%), by Country 2024 & 2032
- Figure 86: Middle East and Africa Cell Harvesting Industry Volume Share (%), by Country 2024 & 2032
- Figure 87: South America Cell Harvesting Industry Revenue (Million), by Type of Cell Harvesting 2024 & 2032
- Figure 88: South America Cell Harvesting Industry Volume (K Unit), by Type of Cell Harvesting 2024 & 2032
- Figure 89: South America Cell Harvesting Industry Revenue Share (%), by Type of Cell Harvesting 2024 & 2032
- Figure 90: South America Cell Harvesting Industry Volume Share (%), by Type of Cell Harvesting 2024 & 2032
- Figure 91: South America Cell Harvesting Industry Revenue (Million), by Application 2024 & 2032
- Figure 92: South America Cell Harvesting Industry Volume (K Unit), by Application 2024 & 2032
- Figure 93: South America Cell Harvesting Industry Revenue Share (%), by Application 2024 & 2032
- Figure 94: South America Cell Harvesting Industry Volume Share (%), by Application 2024 & 2032
- Figure 95: South America Cell Harvesting Industry Revenue (Million), by End User 2024 & 2032
- Figure 96: South America Cell Harvesting Industry Volume (K Unit), by End User 2024 & 2032
- Figure 97: South America Cell Harvesting Industry Revenue Share (%), by End User 2024 & 2032
- Figure 98: South America Cell Harvesting Industry Volume Share (%), by End User 2024 & 2032
- Figure 99: South America Cell Harvesting Industry Revenue (Million), by Country 2024 & 2032
- Figure 100: South America Cell Harvesting Industry Volume (K Unit), by Country 2024 & 2032
- Figure 101: South America Cell Harvesting Industry Revenue Share (%), by Country 2024 & 2032
- Figure 102: South America Cell Harvesting Industry Volume Share (%), by Country 2024 & 2032
List of Tables
- Table 1: Global Cell Harvesting Industry Revenue Million Forecast, by Region 2019 & 2032
- Table 2: Global Cell Harvesting Industry Volume K Unit Forecast, by Region 2019 & 2032
- Table 3: Global Cell Harvesting Industry Revenue Million Forecast, by Type of Cell Harvesting 2019 & 2032
- Table 4: Global Cell Harvesting Industry Volume K Unit Forecast, by Type of Cell Harvesting 2019 & 2032
- Table 5: Global Cell Harvesting Industry Revenue Million Forecast, by Application 2019 & 2032
- Table 6: Global Cell Harvesting Industry Volume K Unit Forecast, by Application 2019 & 2032
- Table 7: Global Cell Harvesting Industry Revenue Million Forecast, by End User 2019 & 2032
- Table 8: Global Cell Harvesting Industry Volume K Unit Forecast, by End User 2019 & 2032
- Table 9: Global Cell Harvesting Industry Revenue Million Forecast, by Region 2019 & 2032
- Table 10: Global Cell Harvesting Industry Volume K Unit Forecast, by Region 2019 & 2032
- Table 11: Global Cell Harvesting Industry Revenue Million Forecast, by Country 2019 & 2032
- Table 12: Global Cell Harvesting Industry Volume K Unit Forecast, by Country 2019 & 2032
- Table 13: Global Cell Harvesting Industry Revenue Million Forecast, by Country 2019 & 2032
- Table 14: Global Cell Harvesting Industry Volume K Unit Forecast, by Country 2019 & 2032
- Table 15: Global Cell Harvesting Industry Revenue Million Forecast, by Country 2019 & 2032
- Table 16: Global Cell Harvesting Industry Volume K Unit Forecast, by Country 2019 & 2032
- Table 17: Global Cell Harvesting Industry Revenue Million Forecast, by Country 2019 & 2032
- Table 18: Global Cell Harvesting Industry Volume K Unit Forecast, by Country 2019 & 2032
- Table 19: Global Cell Harvesting Industry Revenue Million Forecast, by Country 2019 & 2032
- Table 20: Global Cell Harvesting Industry Volume K Unit Forecast, by Country 2019 & 2032
- Table 21: Global Cell Harvesting Industry Revenue Million Forecast, by Type of Cell Harvesting 2019 & 2032
- Table 22: Global Cell Harvesting Industry Volume K Unit Forecast, by Type of Cell Harvesting 2019 & 2032
- Table 23: Global Cell Harvesting Industry Revenue Million Forecast, by Application 2019 & 2032
- Table 24: Global Cell Harvesting Industry Volume K Unit Forecast, by Application 2019 & 2032
- Table 25: Global Cell Harvesting Industry Revenue Million Forecast, by End User 2019 & 2032
- Table 26: Global Cell Harvesting Industry Volume K Unit Forecast, by End User 2019 & 2032
- Table 27: Global Cell Harvesting Industry Revenue Million Forecast, by Country 2019 & 2032
- Table 28: Global Cell Harvesting Industry Volume K Unit Forecast, by Country 2019 & 2032
- Table 29: United States Cell Harvesting Industry Revenue (Million) Forecast, by Application 2019 & 2032
- Table 30: United States Cell Harvesting Industry Volume (K Unit) Forecast, by Application 2019 & 2032
- Table 31: Canada Cell Harvesting Industry Revenue (Million) Forecast, by Application 2019 & 2032
- Table 32: Canada Cell Harvesting Industry Volume (K Unit) Forecast, by Application 2019 & 2032
- Table 33: Mexico Cell Harvesting Industry Revenue (Million) Forecast, by Application 2019 & 2032
- Table 34: Mexico Cell Harvesting Industry Volume (K Unit) Forecast, by Application 2019 & 2032
- Table 35: Global Cell Harvesting Industry Revenue Million Forecast, by Type of Cell Harvesting 2019 & 2032
- Table 36: Global Cell Harvesting Industry Volume K Unit Forecast, by Type of Cell Harvesting 2019 & 2032
- Table 37: Global Cell Harvesting Industry Revenue Million Forecast, by Application 2019 & 2032
- Table 38: Global Cell Harvesting Industry Volume K Unit Forecast, by Application 2019 & 2032
- Table 39: Global Cell Harvesting Industry Revenue Million Forecast, by End User 2019 & 2032
- Table 40: Global Cell Harvesting Industry Volume K Unit Forecast, by End User 2019 & 2032
- Table 41: Global Cell Harvesting Industry Revenue Million Forecast, by Country 2019 & 2032
- Table 42: Global Cell Harvesting Industry Volume K Unit Forecast, by Country 2019 & 2032
- Table 43: Germany Cell Harvesting Industry Revenue (Million) Forecast, by Application 2019 & 2032
- Table 44: Germany Cell Harvesting Industry Volume (K Unit) Forecast, by Application 2019 & 2032
- Table 45: United Kingdom Cell Harvesting Industry Revenue (Million) Forecast, by Application 2019 & 2032
- Table 46: United Kingdom Cell Harvesting Industry Volume (K Unit) Forecast, by Application 2019 & 2032
- Table 47: France Cell Harvesting Industry Revenue (Million) Forecast, by Application 2019 & 2032
- Table 48: France Cell Harvesting Industry Volume (K Unit) Forecast, by Application 2019 & 2032
- Table 49: Italy Cell Harvesting Industry Revenue (Million) Forecast, by Application 2019 & 2032
- Table 50: Italy Cell Harvesting Industry Volume (K Unit) Forecast, by Application 2019 & 2032
- Table 51: Spain Cell Harvesting Industry Revenue (Million) Forecast, by Application 2019 & 2032
- Table 52: Spain Cell Harvesting Industry Volume (K Unit) Forecast, by Application 2019 & 2032
- Table 53: Rest of Europe Cell Harvesting Industry Revenue (Million) Forecast, by Application 2019 & 2032
- Table 54: Rest of Europe Cell Harvesting Industry Volume (K Unit) Forecast, by Application 2019 & 2032
- Table 55: Global Cell Harvesting Industry Revenue Million Forecast, by Type of Cell Harvesting 2019 & 2032
- Table 56: Global Cell Harvesting Industry Volume K Unit Forecast, by Type of Cell Harvesting 2019 & 2032
- Table 57: Global Cell Harvesting Industry Revenue Million Forecast, by Application 2019 & 2032
- Table 58: Global Cell Harvesting Industry Volume K Unit Forecast, by Application 2019 & 2032
- Table 59: Global Cell Harvesting Industry Revenue Million Forecast, by End User 2019 & 2032
- Table 60: Global Cell Harvesting Industry Volume K Unit Forecast, by End User 2019 & 2032
- Table 61: Global Cell Harvesting Industry Revenue Million Forecast, by Country 2019 & 2032
- Table 62: Global Cell Harvesting Industry Volume K Unit Forecast, by Country 2019 & 2032
- Table 63: China Cell Harvesting Industry Revenue (Million) Forecast, by Application 2019 & 2032
- Table 64: China Cell Harvesting Industry Volume (K Unit) Forecast, by Application 2019 & 2032
- Table 65: Japan Cell Harvesting Industry Revenue (Million) Forecast, by Application 2019 & 2032
- Table 66: Japan Cell Harvesting Industry Volume (K Unit) Forecast, by Application 2019 & 2032
- Table 67: India Cell Harvesting Industry Revenue (Million) Forecast, by Application 2019 & 2032
- Table 68: India Cell Harvesting Industry Volume (K Unit) Forecast, by Application 2019 & 2032
- Table 69: Australia Cell Harvesting Industry Revenue (Million) Forecast, by Application 2019 & 2032
- Table 70: Australia Cell Harvesting Industry Volume (K Unit) Forecast, by Application 2019 & 2032
- Table 71: South Korea Cell Harvesting Industry Revenue (Million) Forecast, by Application 2019 & 2032
- Table 72: South Korea Cell Harvesting Industry Volume (K Unit) Forecast, by Application 2019 & 2032
- Table 73: Rest of Asia Pacific Cell Harvesting Industry Revenue (Million) Forecast, by Application 2019 & 2032
- Table 74: Rest of Asia Pacific Cell Harvesting Industry Volume (K Unit) Forecast, by Application 2019 & 2032
- Table 75: Global Cell Harvesting Industry Revenue Million Forecast, by Type of Cell Harvesting 2019 & 2032
- Table 76: Global Cell Harvesting Industry Volume K Unit Forecast, by Type of Cell Harvesting 2019 & 2032
- Table 77: Global Cell Harvesting Industry Revenue Million Forecast, by Application 2019 & 2032
- Table 78: Global Cell Harvesting Industry Volume K Unit Forecast, by Application 2019 & 2032
- Table 79: Global Cell Harvesting Industry Revenue Million Forecast, by End User 2019 & 2032
- Table 80: Global Cell Harvesting Industry Volume K Unit Forecast, by End User 2019 & 2032
- Table 81: Global Cell Harvesting Industry Revenue Million Forecast, by Country 2019 & 2032
- Table 82: Global Cell Harvesting Industry Volume K Unit Forecast, by Country 2019 & 2032
- Table 83: GCC Cell Harvesting Industry Revenue (Million) Forecast, by Application 2019 & 2032
- Table 84: GCC Cell Harvesting Industry Volume (K Unit) Forecast, by Application 2019 & 2032
- Table 85: South Africa Cell Harvesting Industry Revenue (Million) Forecast, by Application 2019 & 2032
- Table 86: South Africa Cell Harvesting Industry Volume (K Unit) Forecast, by Application 2019 & 2032
- Table 87: Rest of Middle East and Africa Cell Harvesting Industry Revenue (Million) Forecast, by Application 2019 & 2032
- Table 88: Rest of Middle East and Africa Cell Harvesting Industry Volume (K Unit) Forecast, by Application 2019 & 2032
- Table 89: Global Cell Harvesting Industry Revenue Million Forecast, by Type of Cell Harvesting 2019 & 2032
- Table 90: Global Cell Harvesting Industry Volume K Unit Forecast, by Type of Cell Harvesting 2019 & 2032
- Table 91: Global Cell Harvesting Industry Revenue Million Forecast, by Application 2019 & 2032
- Table 92: Global Cell Harvesting Industry Volume K Unit Forecast, by Application 2019 & 2032
- Table 93: Global Cell Harvesting Industry Revenue Million Forecast, by End User 2019 & 2032
- Table 94: Global Cell Harvesting Industry Volume K Unit Forecast, by End User 2019 & 2032
- Table 95: Global Cell Harvesting Industry Revenue Million Forecast, by Country 2019 & 2032
- Table 96: Global Cell Harvesting Industry Volume K Unit Forecast, by Country 2019 & 2032
- Table 97: Brazil Cell Harvesting Industry Revenue (Million) Forecast, by Application 2019 & 2032
- Table 98: Brazil Cell Harvesting Industry Volume (K Unit) Forecast, by Application 2019 & 2032
- Table 99: Argentina Cell Harvesting Industry Revenue (Million) Forecast, by Application 2019 & 2032
- Table 100: Argentina Cell Harvesting Industry Volume (K Unit) Forecast, by Application 2019 & 2032
- Table 101: Rest of South America Cell Harvesting Industry Revenue (Million) Forecast, by Application 2019 & 2032
- Table 102: Rest of South America Cell Harvesting Industry Volume (K Unit) Forecast, by Application 2019 & 2032
Frequently Asked Questions
1. What is the projected Compound Annual Growth Rate (CAGR) of the Cell Harvesting Industry?
The projected CAGR is approximately 8.70%.
2. Which companies are prominent players in the Cell Harvesting Industry?
Key companies in the market include Arthrex Inc, AVITA Medical, Tomtec, Terumo Corporation, Thermo Fisher Scientific Inc, Esco Lifesciences Group, Eurofins Scientific, Sartorius AG, Danaher Corporation, Cox Scientific Ltd, Alcami Corporation, Perkin Elmer Inc.
3. What are the main segments of the Cell Harvesting Industry?
The market segments include Type of Cell Harvesting, Application, End User.
4. Can you provide details about the market size?
The market size is estimated to be USD XX Million as of 2022.
5. What are some drivers contributing to market growth?
Rising Investments in Regenerative Medicine and Cell-based Research; Growth of the Biotechnology and Biopharmaceutical Industries; Increasing Incidence of Chronic and Infectious Diseases.
6. What are the notable trends driving market growth?
Stem Cell Research Segment Expects to Register a Significant CAGR Over the Forecast Period.
7. Are there any restraints impacting market growth?
Ethical Issues pertaining to Embryonic Stem Cell Research.
8. Can you provide examples of recent developments in the market?
October 2022: Thermo Fisher Scientific launched the DynaSpin Single-Use Centrifuge system, a centrifuge designed to provide an optimal single-use solution for large-scale cell culture harvesting. The system improves and streamlines the process by reducing the number of depth filtration cartridges required to complete the harvest process.
9. What pricing options are available for accessing the report?
Pricing options include single-user, multi-user, and enterprise licenses priced at USD 4750, USD 5250, and USD 8750 respectively.
10. Is the market size provided in terms of value or volume?
The market size is provided in terms of value, measured in Million and volume, measured in K Unit.
11. Are there any specific market keywords associated with the report?
Yes, the market keyword associated with the report is "Cell Harvesting Industry," which aids in identifying and referencing the specific market segment covered.
12. How do I determine which pricing option suits my needs best?
The pricing options vary based on user requirements and access needs. Individual users may opt for single-user licenses, while businesses requiring broader access may choose multi-user or enterprise licenses for cost-effective access to the report.
13. Are there any additional resources or data provided in the Cell Harvesting Industry report?
While the report offers comprehensive insights, it's advisable to review the specific contents or supplementary materials provided to ascertain if additional resources or data are available.
14. How can I stay updated on further developments or reports in the Cell Harvesting Industry?
To stay informed about further developments, trends, and reports in the Cell Harvesting Industry, consider subscribing to industry newsletters, following relevant companies and organizations, or regularly checking reputable industry news sources and publications.
Methodology
Step 1 - Identification of Relevant Samples Size from Population Database


Step 2 - Approaches for Defining Global Market Size (Value, Volume* & Price*)

Note*: In applicable scenarios
Step 3 - Data Sources
Primary Research
- Web Analytics
- Survey Reports
- Research Institute
- Latest Research Reports
- Opinion Leaders
Secondary Research
- Annual Reports
- White Paper
- Latest Press Release
- Industry Association
- Paid Database
- Investor Presentations

Step 4 - Data Triangulation
Involves using different sources of information in order to increase the validity of a study
These sources are likely to be stakeholders in a program - participants, other researchers, program staff, other community members, and so on.
Then we put all data in single framework & apply various statistical tools to find out the dynamic on the market.
During the analysis stage, feedback from the stakeholder groups would be compared to determine areas of agreement as well as areas of divergence


