
Key Insights
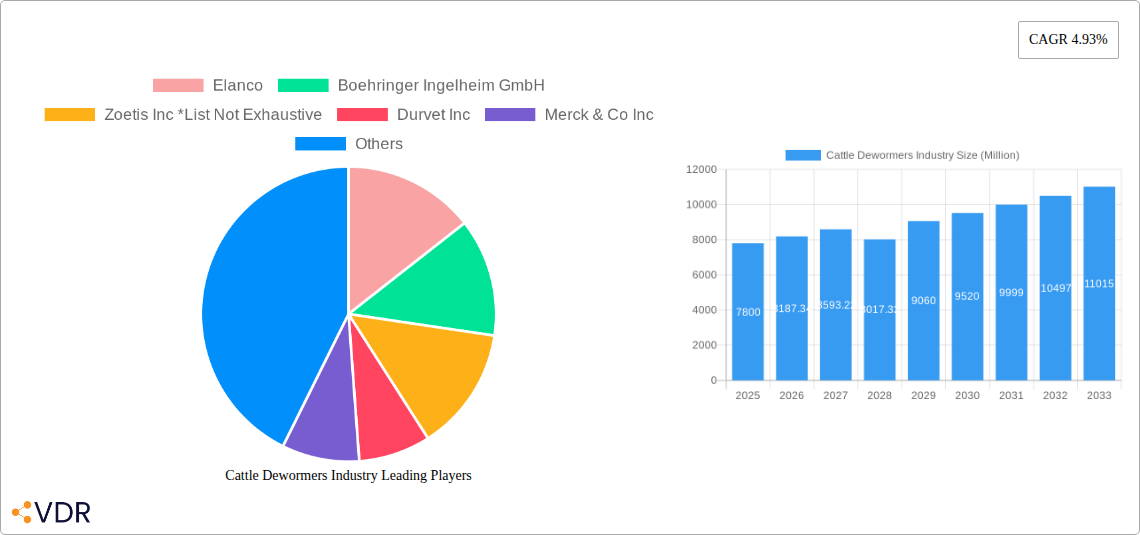
The global cattle dewormer market, valued at $7.80 billion in 2025, is projected to experience robust growth, driven by a compound annual growth rate (CAGR) of 4.93% from 2025 to 2033. This expansion is fueled by several key factors. Firstly, the increasing global demand for beef and dairy products necessitates effective parasite control in cattle herds to maintain productivity and animal health. Secondly, advancements in dewormer formulations, including the development of novel drugs with improved efficacy and reduced environmental impact, are boosting market adoption. Thirdly, the rising awareness among farmers regarding the economic consequences of parasitic infections and the implementation of effective parasite control programs are contributing to market growth. Furthermore, the expanding veterinary services sector and increased access to veterinary expertise in developing economies are facilitating wider usage of dewormers. However, the market faces challenges such as the growing prevalence of drug resistance in parasites, requiring the development of new and innovative solutions. Stringent regulatory frameworks governing the use and registration of veterinary pharmaceuticals also pose constraints.
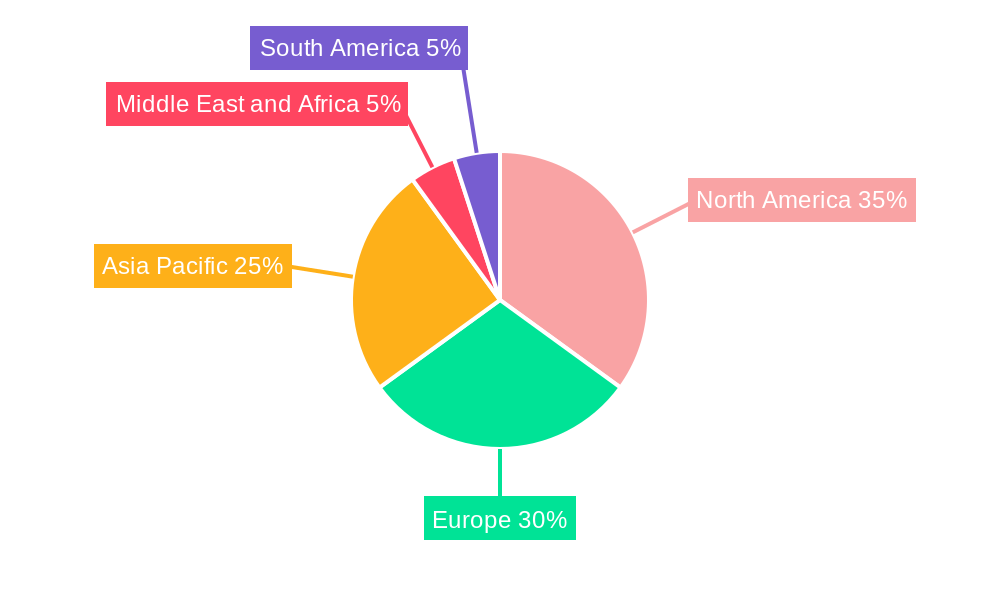
Segment-wise, the oral administration mode currently dominates the market due to its ease of use and cost-effectiveness. However, topical applications are gaining traction, driven by advancements in formulation technology leading to improved efficacy and reduced risks of drug residues in meat. Cattle remain the largest animal segment due to their substantial economic importance. Geographically, North America and Europe currently hold significant market shares, primarily due to established veterinary practices and high livestock populations. However, the Asia-Pacific region is anticipated to show substantial growth over the forecast period, driven by rising livestock production and increasing adoption of modern farming techniques. The competitive landscape is characterized by several key players, including Elanco, Boehringer Ingelheim, Zoetis, and Merck, who are continually investing in research and development to strengthen their market position. The market's future trajectory will largely depend on the success of ongoing research initiatives aimed at overcoming drug resistance, improving product efficacy, and ensuring sustainable livestock farming practices.
Cattle Dewormers Industry Market Report: 2019-2033
This comprehensive report provides a detailed analysis of the Cattle Dewormers industry, encompassing market dynamics, growth trends, regional dominance, product landscape, challenges, opportunities, and key players. The report covers the period 2019-2033, with a focus on the forecast period 2025-2033 (Base Year: 2025, Estimated Year: 2025). Market values are presented in Million units.
Cattle Dewormers Industry Market Dynamics & Structure
The global cattle dewormers market is characterized by moderate concentration, with key players like Elanco, Boehringer Ingelheim GmbH, and Zoetis Inc. holding significant market share (xx%). However, the presence of numerous smaller players, including Durvet Inc, Merck & Co Inc, Bayer AG, Manna Pro Products LLC, Virbac, First Priority Inc, and Jeffers Inc, indicates a competitive landscape. Technological innovation, driven by the need for more effective and safer dewormers, is a key driver. Regulatory frameworks, varying across regions, impact product approvals and market access. The market also faces pressure from the development of parasite resistance and the increasing adoption of integrated pest management strategies. Mergers and acquisitions (M&A) activity has been moderate (xx deals in the past 5 years), primarily focused on strengthening product portfolios and expanding geographical reach. Innovation barriers include the high cost of R&D and the stringent regulatory requirements for new drug approvals.
- Market Concentration: Moderate, with top 3 players holding xx% market share.
- Technological Innovation: Focus on novel formulations, improved efficacy, and reduced environmental impact.
- Regulatory Frameworks: Vary across geographies, impacting market access and product approvals.
- Competitive Substitutes: Integrated pest management strategies and alternative deworming methods.
- End-User Demographics: Predominantly large-scale commercial cattle farms, with increasing adoption among smaller farms.
- M&A Trends: Moderate activity, primarily for portfolio diversification and expansion.
Cattle Dewormers Industry Growth Trends & Insights
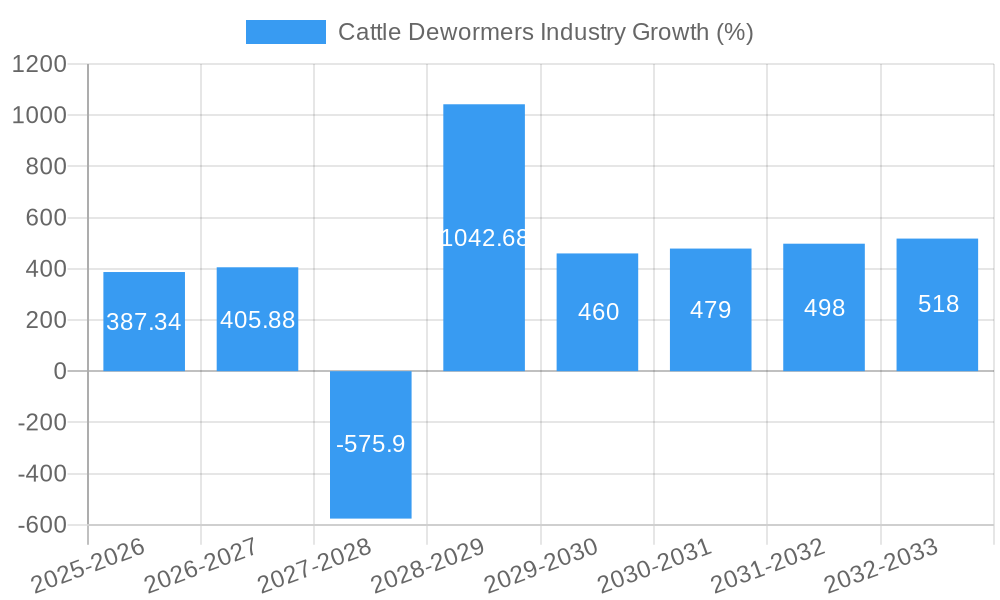
The global cattle dewormers market witnessed steady growth during the historical period (2019-2024), driven by factors such as increasing livestock populations, rising awareness of parasite control, and advancements in deworming technologies. The market size reached xx Million units in 2024, and is projected to grow at a Compound Annual Growth Rate (CAGR) of xx% during the forecast period (2025-2033), reaching xx Million units by 2033. This growth is fueled by the increasing adoption of effective and safe deworming practices and the expanding global cattle population. Technological disruptions, such as the development of novel deworming agents and improved delivery systems, are also contributing to market expansion. Consumer behavior is shifting towards products with enhanced efficacy, reduced environmental impact, and improved animal welfare. Market penetration is highest in developed regions, but is increasing rapidly in developing economies with growing livestock sectors.
Dominant Regions, Countries, or Segments in Cattle Dewormers Industry
The cattle dewormers market is geographically diverse, with North America and Europe currently holding the largest market shares due to high cattle populations and well-established veterinary practices. However, Asia-Pacific is expected to witness the fastest growth rate over the forecast period, driven by increasing livestock production and rising awareness of animal health.
By Animal Type: The cattle segment dominates the market, accounting for xx% of total sales, due to the high prevalence of internal and external parasites in cattle. Swine and poultry segments also contribute significantly, while the "other animal types" segment represents a smaller portion of the overall market.
By Mode of Administration: Oral dewormers hold the largest market share, owing to ease of administration and cost-effectiveness. However, topical and other modes of administration are gaining traction due to their improved efficacy and reduced environmental impact.
- Key Drivers: Increasing livestock populations, rising awareness of parasite control, technological advancements, and government initiatives promoting animal health.
- Dominance Factors: High cattle populations, well-established veterinary infrastructure, and higher purchasing power in developed regions.
- Growth Potential: Significant potential in developing countries with rising livestock production.
Cattle Dewormers Industry Product Landscape
The cattle dewormers market offers a wide range of products, including oral drench, injectables, pour-ons, and boluses, each with varying formulations and active ingredients. Recent innovations focus on improved efficacy against resistant parasites, reduced withdrawal times, and better animal safety profiles. Unique selling propositions include broad-spectrum activity, fast acting formulations, and user-friendly application methods. Technological advancements involve the development of new active ingredients, improved drug delivery systems, and advanced diagnostic tools for parasite detection.
Key Drivers, Barriers & Challenges in Cattle Dewormers Industry
Key Drivers: Increasing livestock populations globally, growing awareness of animal health and welfare, stringent regulations promoting responsible parasite control, and technological advancements in deworming technologies.
Challenges: Development of parasite resistance to existing dewormers, stringent regulatory hurdles for new product approvals, fluctuating raw material costs, and competitive pressures from generic products, and supply chain disruptions. The impact of these challenges can translate to delays in product launches, increased production costs, and potentially reduced profitability for companies. For example, xx% of farms experienced supply chain disruptions in the past year resulting in xx% increase in costs.
Emerging Opportunities in Cattle Dewormers Industry
Emerging opportunities include the development of novel dewormers with improved efficacy against resistant parasites, the expansion into untapped markets in developing economies, and the growing demand for sustainable and environmentally friendly deworming solutions. The increasing focus on precision livestock farming offers opportunities for targeted deworming strategies based on individual animal needs, leading to reduced drug usage and minimized environmental impact.
Growth Accelerators in the Cattle Dewormers Industry Industry
Long-term growth will be driven by technological breakthroughs, particularly the development of new active ingredients with enhanced efficacy and reduced environmental impact. Strategic partnerships between pharmaceutical companies and livestock producers will play a vital role in ensuring the availability of effective and accessible deworming solutions. Market expansion into emerging economies with growing livestock sectors presents significant growth potential.
Key Players Shaping the Cattle Dewormers Industry Market
- Elanco
- Boehringer Ingelheim GmbH
- Zoetis Inc
- Durvet Inc
- Merck & Co Inc
- Bayer AG
- Manna Pro Products LLC
- Virbac
- First Priority Inc
- Jeffers Inc
Notable Milestones in Cattle Dewormers Industry Sector
- February 2022: Sharana NGO, in collaboration with the Tamil Nadu Government Animal Husbandry Department, organized a Cattle Health and Awareness Camp, providing support to over 250 cattle. This highlights the growing awareness of cattle health and the role of deworming in improving livestock productivity.
- June 2021: Ceva Animal Health's Eprecis received a regulatory change, impacting veterinary involvement in parasite control plans. This signifies regulatory shifts and their influence on market dynamics.
In-Depth Cattle Dewormers Industry Market Outlook
The future of the cattle dewormers market is bright, driven by the continuing need for effective parasite control and the ongoing development of innovative products. Strategic opportunities lie in expanding into high-growth regions, leveraging technological advancements to improve product efficacy and sustainability, and fostering collaborations across the value chain to ensure responsible deworming practices. The market's long-term growth trajectory is poised to be robust, with significant potential for companies that can adapt to evolving regulatory landscapes and consumer demands.
Cattle Dewormers Industry Segmentation
-
1. Animal Type
- 1.1. Cattle
- 1.2. Swine
- 1.3. Poultry
- 1.4. Other Animal Types
-
2. Mode of Administration
- 2.1. Oral
- 2.2. Topical
- 2.3. Other Modes of Administration
Cattle Dewormers Industry Segmentation By Geography
-
1. North America
- 1.1. United States
- 1.2. Canada
- 1.3. Mexico
-
2. Europe
- 2.1. Germany
- 2.2. United Kingdom
- 2.3. France
- 2.4. Italy
- 2.5. Spain
- 2.6. Rest of Europe
-
3. Asia Pacific
- 3.1. China
- 3.2. Japan
- 3.3. India
- 3.4. Australia
- 3.5. South Korea
- 3.6. Rest of Asia Pacific
-
4. Middle East and Africa
- 4.1. GCC
- 4.2. South Africa
- 4.3. Rest of Middle East and Africa
-
5. South America
- 5.1. Brazil
- 5.2. Argentina
- 5.3. Rest of South America
Cattle Dewormers Industry REPORT HIGHLIGHTS
| Aspects | Details |
|---|---|
| Study Period | 2019-2033 |
| Base Year | 2024 |
| Estimated Year | 2025 |
| Forecast Period | 2025-2033 |
| Historical Period | 2019-2024 |
| Growth Rate | CAGR of 4.93% from 2019-2033 |
| Segmentation |
|
Table of Contents
- 1. Introduction
- 1.1. Research Scope
- 1.2. Market Segmentation
- 1.3. Research Methodology
- 1.4. Definitions and Assumptions
- 2. Executive Summary
- 2.1. Introduction
- 3. Market Dynamics
- 3.1. Introduction
- 3.2. Market Drivers
- 3.2.1. Rise in Prevalence of Parasitic Diseases in Livestock Animals; Growth in Demand for Animal-based Food Products
- 3.3. Market Restrains
- 3.3.1. Side Effects Associated with Dewormers
- 3.4. Market Trends
- 3.4.1. The Cattle Segment is Expected to Show Better Growth Over the Forecast Years
- 4. Market Factor Analysis
- 4.1. Porters Five Forces
- 4.2. Supply/Value Chain
- 4.3. PESTEL analysis
- 4.4. Market Entropy
- 4.5. Patent/Trademark Analysis
- 5. Global Cattle Dewormers Industry Analysis, Insights and Forecast, 2019-2031
- 5.1. Market Analysis, Insights and Forecast - by Animal Type
- 5.1.1. Cattle
- 5.1.2. Swine
- 5.1.3. Poultry
- 5.1.4. Other Animal Types
- 5.2. Market Analysis, Insights and Forecast - by Mode of Administration
- 5.2.1. Oral
- 5.2.2. Topical
- 5.2.3. Other Modes of Administration
- 5.3. Market Analysis, Insights and Forecast - by Region
- 5.3.1. North America
- 5.3.2. Europe
- 5.3.3. Asia Pacific
- 5.3.4. Middle East and Africa
- 5.3.5. South America
- 5.1. Market Analysis, Insights and Forecast - by Animal Type
- 6. North America Cattle Dewormers Industry Analysis, Insights and Forecast, 2019-2031
- 6.1. Market Analysis, Insights and Forecast - by Animal Type
- 6.1.1. Cattle
- 6.1.2. Swine
- 6.1.3. Poultry
- 6.1.4. Other Animal Types
- 6.2. Market Analysis, Insights and Forecast - by Mode of Administration
- 6.2.1. Oral
- 6.2.2. Topical
- 6.2.3. Other Modes of Administration
- 6.1. Market Analysis, Insights and Forecast - by Animal Type
- 7. Europe Cattle Dewormers Industry Analysis, Insights and Forecast, 2019-2031
- 7.1. Market Analysis, Insights and Forecast - by Animal Type
- 7.1.1. Cattle
- 7.1.2. Swine
- 7.1.3. Poultry
- 7.1.4. Other Animal Types
- 7.2. Market Analysis, Insights and Forecast - by Mode of Administration
- 7.2.1. Oral
- 7.2.2. Topical
- 7.2.3. Other Modes of Administration
- 7.1. Market Analysis, Insights and Forecast - by Animal Type
- 8. Asia Pacific Cattle Dewormers Industry Analysis, Insights and Forecast, 2019-2031
- 8.1. Market Analysis, Insights and Forecast - by Animal Type
- 8.1.1. Cattle
- 8.1.2. Swine
- 8.1.3. Poultry
- 8.1.4. Other Animal Types
- 8.2. Market Analysis, Insights and Forecast - by Mode of Administration
- 8.2.1. Oral
- 8.2.2. Topical
- 8.2.3. Other Modes of Administration
- 8.1. Market Analysis, Insights and Forecast - by Animal Type
- 9. Middle East and Africa Cattle Dewormers Industry Analysis, Insights and Forecast, 2019-2031
- 9.1. Market Analysis, Insights and Forecast - by Animal Type
- 9.1.1. Cattle
- 9.1.2. Swine
- 9.1.3. Poultry
- 9.1.4. Other Animal Types
- 9.2. Market Analysis, Insights and Forecast - by Mode of Administration
- 9.2.1. Oral
- 9.2.2. Topical
- 9.2.3. Other Modes of Administration
- 9.1. Market Analysis, Insights and Forecast - by Animal Type
- 10. South America Cattle Dewormers Industry Analysis, Insights and Forecast, 2019-2031
- 10.1. Market Analysis, Insights and Forecast - by Animal Type
- 10.1.1. Cattle
- 10.1.2. Swine
- 10.1.3. Poultry
- 10.1.4. Other Animal Types
- 10.2. Market Analysis, Insights and Forecast - by Mode of Administration
- 10.2.1. Oral
- 10.2.2. Topical
- 10.2.3. Other Modes of Administration
- 10.1. Market Analysis, Insights and Forecast - by Animal Type
- 11. North America Cattle Dewormers Industry Analysis, Insights and Forecast, 2019-2031
- 11.1. Market Analysis, Insights and Forecast - By Country/Sub-region
- 11.1.1 United States
- 11.1.2 Canada
- 11.1.3 Mexico
- 12. Europe Cattle Dewormers Industry Analysis, Insights and Forecast, 2019-2031
- 12.1. Market Analysis, Insights and Forecast - By Country/Sub-region
- 12.1.1 Germany
- 12.1.2 United Kingdom
- 12.1.3 France
- 12.1.4 Italy
- 12.1.5 Spain
- 12.1.6 Rest of Europe
- 13. Asia Pacific Cattle Dewormers Industry Analysis, Insights and Forecast, 2019-2031
- 13.1. Market Analysis, Insights and Forecast - By Country/Sub-region
- 13.1.1 China
- 13.1.2 Japan
- 13.1.3 India
- 13.1.4 Australia
- 13.1.5 South Korea
- 13.1.6 Rest of Asia Pacific
- 14. Middle East and Africa Cattle Dewormers Industry Analysis, Insights and Forecast, 2019-2031
- 14.1. Market Analysis, Insights and Forecast - By Country/Sub-region
- 14.1.1 GCC
- 14.1.2 South Africa
- 14.1.3 Rest of Middle East and Africa
- 15. South America Cattle Dewormers Industry Analysis, Insights and Forecast, 2019-2031
- 15.1. Market Analysis, Insights and Forecast - By Country/Sub-region
- 15.1.1 Brazil
- 15.1.2 Argentina
- 15.1.3 Rest of South America
- 16. Competitive Analysis
- 16.1. Global Market Share Analysis 2024
- 16.2. Company Profiles
- 16.2.1 Elanco
- 16.2.1.1. Overview
- 16.2.1.2. Products
- 16.2.1.3. SWOT Analysis
- 16.2.1.4. Recent Developments
- 16.2.1.5. Financials (Based on Availability)
- 16.2.2 Boehringer Ingelheim GmbH
- 16.2.2.1. Overview
- 16.2.2.2. Products
- 16.2.2.3. SWOT Analysis
- 16.2.2.4. Recent Developments
- 16.2.2.5. Financials (Based on Availability)
- 16.2.3 Zoetis Inc *List Not Exhaustive
- 16.2.3.1. Overview
- 16.2.3.2. Products
- 16.2.3.3. SWOT Analysis
- 16.2.3.4. Recent Developments
- 16.2.3.5. Financials (Based on Availability)
- 16.2.4 Durvet Inc
- 16.2.4.1. Overview
- 16.2.4.2. Products
- 16.2.4.3. SWOT Analysis
- 16.2.4.4. Recent Developments
- 16.2.4.5. Financials (Based on Availability)
- 16.2.5 Merck & Co Inc
- 16.2.5.1. Overview
- 16.2.5.2. Products
- 16.2.5.3. SWOT Analysis
- 16.2.5.4. Recent Developments
- 16.2.5.5. Financials (Based on Availability)
- 16.2.6 Bayer AG
- 16.2.6.1. Overview
- 16.2.6.2. Products
- 16.2.6.3. SWOT Analysis
- 16.2.6.4. Recent Developments
- 16.2.6.5. Financials (Based on Availability)
- 16.2.7 Manna Pro Products LLC
- 16.2.7.1. Overview
- 16.2.7.2. Products
- 16.2.7.3. SWOT Analysis
- 16.2.7.4. Recent Developments
- 16.2.7.5. Financials (Based on Availability)
- 16.2.8 Virbac
- 16.2.8.1. Overview
- 16.2.8.2. Products
- 16.2.8.3. SWOT Analysis
- 16.2.8.4. Recent Developments
- 16.2.8.5. Financials (Based on Availability)
- 16.2.9 First Priority Inc
- 16.2.9.1. Overview
- 16.2.9.2. Products
- 16.2.9.3. SWOT Analysis
- 16.2.9.4. Recent Developments
- 16.2.9.5. Financials (Based on Availability)
- 16.2.10 Jeffers Inc
- 16.2.10.1. Overview
- 16.2.10.2. Products
- 16.2.10.3. SWOT Analysis
- 16.2.10.4. Recent Developments
- 16.2.10.5. Financials (Based on Availability)
- 16.2.1 Elanco
List of Figures
- Figure 1: Global Cattle Dewormers Industry Revenue Breakdown (Million, %) by Region 2024 & 2032
- Figure 2: North America Cattle Dewormers Industry Revenue (Million), by Country 2024 & 2032
- Figure 3: North America Cattle Dewormers Industry Revenue Share (%), by Country 2024 & 2032
- Figure 4: Europe Cattle Dewormers Industry Revenue (Million), by Country 2024 & 2032
- Figure 5: Europe Cattle Dewormers Industry Revenue Share (%), by Country 2024 & 2032
- Figure 6: Asia Pacific Cattle Dewormers Industry Revenue (Million), by Country 2024 & 2032
- Figure 7: Asia Pacific Cattle Dewormers Industry Revenue Share (%), by Country 2024 & 2032
- Figure 8: Middle East and Africa Cattle Dewormers Industry Revenue (Million), by Country 2024 & 2032
- Figure 9: Middle East and Africa Cattle Dewormers Industry Revenue Share (%), by Country 2024 & 2032
- Figure 10: South America Cattle Dewormers Industry Revenue (Million), by Country 2024 & 2032
- Figure 11: South America Cattle Dewormers Industry Revenue Share (%), by Country 2024 & 2032
- Figure 12: North America Cattle Dewormers Industry Revenue (Million), by Animal Type 2024 & 2032
- Figure 13: North America Cattle Dewormers Industry Revenue Share (%), by Animal Type 2024 & 2032
- Figure 14: North America Cattle Dewormers Industry Revenue (Million), by Mode of Administration 2024 & 2032
- Figure 15: North America Cattle Dewormers Industry Revenue Share (%), by Mode of Administration 2024 & 2032
- Figure 16: North America Cattle Dewormers Industry Revenue (Million), by Country 2024 & 2032
- Figure 17: North America Cattle Dewormers Industry Revenue Share (%), by Country 2024 & 2032
- Figure 18: Europe Cattle Dewormers Industry Revenue (Million), by Animal Type 2024 & 2032
- Figure 19: Europe Cattle Dewormers Industry Revenue Share (%), by Animal Type 2024 & 2032
- Figure 20: Europe Cattle Dewormers Industry Revenue (Million), by Mode of Administration 2024 & 2032
- Figure 21: Europe Cattle Dewormers Industry Revenue Share (%), by Mode of Administration 2024 & 2032
- Figure 22: Europe Cattle Dewormers Industry Revenue (Million), by Country 2024 & 2032
- Figure 23: Europe Cattle Dewormers Industry Revenue Share (%), by Country 2024 & 2032
- Figure 24: Asia Pacific Cattle Dewormers Industry Revenue (Million), by Animal Type 2024 & 2032
- Figure 25: Asia Pacific Cattle Dewormers Industry Revenue Share (%), by Animal Type 2024 & 2032
- Figure 26: Asia Pacific Cattle Dewormers Industry Revenue (Million), by Mode of Administration 2024 & 2032
- Figure 27: Asia Pacific Cattle Dewormers Industry Revenue Share (%), by Mode of Administration 2024 & 2032
- Figure 28: Asia Pacific Cattle Dewormers Industry Revenue (Million), by Country 2024 & 2032
- Figure 29: Asia Pacific Cattle Dewormers Industry Revenue Share (%), by Country 2024 & 2032
- Figure 30: Middle East and Africa Cattle Dewormers Industry Revenue (Million), by Animal Type 2024 & 2032
- Figure 31: Middle East and Africa Cattle Dewormers Industry Revenue Share (%), by Animal Type 2024 & 2032
- Figure 32: Middle East and Africa Cattle Dewormers Industry Revenue (Million), by Mode of Administration 2024 & 2032
- Figure 33: Middle East and Africa Cattle Dewormers Industry Revenue Share (%), by Mode of Administration 2024 & 2032
- Figure 34: Middle East and Africa Cattle Dewormers Industry Revenue (Million), by Country 2024 & 2032
- Figure 35: Middle East and Africa Cattle Dewormers Industry Revenue Share (%), by Country 2024 & 2032
- Figure 36: South America Cattle Dewormers Industry Revenue (Million), by Animal Type 2024 & 2032
- Figure 37: South America Cattle Dewormers Industry Revenue Share (%), by Animal Type 2024 & 2032
- Figure 38: South America Cattle Dewormers Industry Revenue (Million), by Mode of Administration 2024 & 2032
- Figure 39: South America Cattle Dewormers Industry Revenue Share (%), by Mode of Administration 2024 & 2032
- Figure 40: South America Cattle Dewormers Industry Revenue (Million), by Country 2024 & 2032
- Figure 41: South America Cattle Dewormers Industry Revenue Share (%), by Country 2024 & 2032
List of Tables
- Table 1: Global Cattle Dewormers Industry Revenue Million Forecast, by Region 2019 & 2032
- Table 2: Global Cattle Dewormers Industry Revenue Million Forecast, by Animal Type 2019 & 2032
- Table 3: Global Cattle Dewormers Industry Revenue Million Forecast, by Mode of Administration 2019 & 2032
- Table 4: Global Cattle Dewormers Industry Revenue Million Forecast, by Region 2019 & 2032
- Table 5: Global Cattle Dewormers Industry Revenue Million Forecast, by Country 2019 & 2032
- Table 6: United States Cattle Dewormers Industry Revenue (Million) Forecast, by Application 2019 & 2032
- Table 7: Canada Cattle Dewormers Industry Revenue (Million) Forecast, by Application 2019 & 2032
- Table 8: Mexico Cattle Dewormers Industry Revenue (Million) Forecast, by Application 2019 & 2032
- Table 9: Global Cattle Dewormers Industry Revenue Million Forecast, by Country 2019 & 2032
- Table 10: Germany Cattle Dewormers Industry Revenue (Million) Forecast, by Application 2019 & 2032
- Table 11: United Kingdom Cattle Dewormers Industry Revenue (Million) Forecast, by Application 2019 & 2032
- Table 12: France Cattle Dewormers Industry Revenue (Million) Forecast, by Application 2019 & 2032
- Table 13: Italy Cattle Dewormers Industry Revenue (Million) Forecast, by Application 2019 & 2032
- Table 14: Spain Cattle Dewormers Industry Revenue (Million) Forecast, by Application 2019 & 2032
- Table 15: Rest of Europe Cattle Dewormers Industry Revenue (Million) Forecast, by Application 2019 & 2032
- Table 16: Global Cattle Dewormers Industry Revenue Million Forecast, by Country 2019 & 2032
- Table 17: China Cattle Dewormers Industry Revenue (Million) Forecast, by Application 2019 & 2032
- Table 18: Japan Cattle Dewormers Industry Revenue (Million) Forecast, by Application 2019 & 2032
- Table 19: India Cattle Dewormers Industry Revenue (Million) Forecast, by Application 2019 & 2032
- Table 20: Australia Cattle Dewormers Industry Revenue (Million) Forecast, by Application 2019 & 2032
- Table 21: South Korea Cattle Dewormers Industry Revenue (Million) Forecast, by Application 2019 & 2032
- Table 22: Rest of Asia Pacific Cattle Dewormers Industry Revenue (Million) Forecast, by Application 2019 & 2032
- Table 23: Global Cattle Dewormers Industry Revenue Million Forecast, by Country 2019 & 2032
- Table 24: GCC Cattle Dewormers Industry Revenue (Million) Forecast, by Application 2019 & 2032
- Table 25: South Africa Cattle Dewormers Industry Revenue (Million) Forecast, by Application 2019 & 2032
- Table 26: Rest of Middle East and Africa Cattle Dewormers Industry Revenue (Million) Forecast, by Application 2019 & 2032
- Table 27: Global Cattle Dewormers Industry Revenue Million Forecast, by Country 2019 & 2032
- Table 28: Brazil Cattle Dewormers Industry Revenue (Million) Forecast, by Application 2019 & 2032
- Table 29: Argentina Cattle Dewormers Industry Revenue (Million) Forecast, by Application 2019 & 2032
- Table 30: Rest of South America Cattle Dewormers Industry Revenue (Million) Forecast, by Application 2019 & 2032
- Table 31: Global Cattle Dewormers Industry Revenue Million Forecast, by Animal Type 2019 & 2032
- Table 32: Global Cattle Dewormers Industry Revenue Million Forecast, by Mode of Administration 2019 & 2032
- Table 33: Global Cattle Dewormers Industry Revenue Million Forecast, by Country 2019 & 2032
- Table 34: United States Cattle Dewormers Industry Revenue (Million) Forecast, by Application 2019 & 2032
- Table 35: Canada Cattle Dewormers Industry Revenue (Million) Forecast, by Application 2019 & 2032
- Table 36: Mexico Cattle Dewormers Industry Revenue (Million) Forecast, by Application 2019 & 2032
- Table 37: Global Cattle Dewormers Industry Revenue Million Forecast, by Animal Type 2019 & 2032
- Table 38: Global Cattle Dewormers Industry Revenue Million Forecast, by Mode of Administration 2019 & 2032
- Table 39: Global Cattle Dewormers Industry Revenue Million Forecast, by Country 2019 & 2032
- Table 40: Germany Cattle Dewormers Industry Revenue (Million) Forecast, by Application 2019 & 2032
- Table 41: United Kingdom Cattle Dewormers Industry Revenue (Million) Forecast, by Application 2019 & 2032
- Table 42: France Cattle Dewormers Industry Revenue (Million) Forecast, by Application 2019 & 2032
- Table 43: Italy Cattle Dewormers Industry Revenue (Million) Forecast, by Application 2019 & 2032
- Table 44: Spain Cattle Dewormers Industry Revenue (Million) Forecast, by Application 2019 & 2032
- Table 45: Rest of Europe Cattle Dewormers Industry Revenue (Million) Forecast, by Application 2019 & 2032
- Table 46: Global Cattle Dewormers Industry Revenue Million Forecast, by Animal Type 2019 & 2032
- Table 47: Global Cattle Dewormers Industry Revenue Million Forecast, by Mode of Administration 2019 & 2032
- Table 48: Global Cattle Dewormers Industry Revenue Million Forecast, by Country 2019 & 2032
- Table 49: China Cattle Dewormers Industry Revenue (Million) Forecast, by Application 2019 & 2032
- Table 50: Japan Cattle Dewormers Industry Revenue (Million) Forecast, by Application 2019 & 2032
- Table 51: India Cattle Dewormers Industry Revenue (Million) Forecast, by Application 2019 & 2032
- Table 52: Australia Cattle Dewormers Industry Revenue (Million) Forecast, by Application 2019 & 2032
- Table 53: South Korea Cattle Dewormers Industry Revenue (Million) Forecast, by Application 2019 & 2032
- Table 54: Rest of Asia Pacific Cattle Dewormers Industry Revenue (Million) Forecast, by Application 2019 & 2032
- Table 55: Global Cattle Dewormers Industry Revenue Million Forecast, by Animal Type 2019 & 2032
- Table 56: Global Cattle Dewormers Industry Revenue Million Forecast, by Mode of Administration 2019 & 2032
- Table 57: Global Cattle Dewormers Industry Revenue Million Forecast, by Country 2019 & 2032
- Table 58: GCC Cattle Dewormers Industry Revenue (Million) Forecast, by Application 2019 & 2032
- Table 59: South Africa Cattle Dewormers Industry Revenue (Million) Forecast, by Application 2019 & 2032
- Table 60: Rest of Middle East and Africa Cattle Dewormers Industry Revenue (Million) Forecast, by Application 2019 & 2032
- Table 61: Global Cattle Dewormers Industry Revenue Million Forecast, by Animal Type 2019 & 2032
- Table 62: Global Cattle Dewormers Industry Revenue Million Forecast, by Mode of Administration 2019 & 2032
- Table 63: Global Cattle Dewormers Industry Revenue Million Forecast, by Country 2019 & 2032
- Table 64: Brazil Cattle Dewormers Industry Revenue (Million) Forecast, by Application 2019 & 2032
- Table 65: Argentina Cattle Dewormers Industry Revenue (Million) Forecast, by Application 2019 & 2032
- Table 66: Rest of South America Cattle Dewormers Industry Revenue (Million) Forecast, by Application 2019 & 2032
Frequently Asked Questions
1. What is the projected Compound Annual Growth Rate (CAGR) of the Cattle Dewormers Industry?
The projected CAGR is approximately 4.93%.
2. Which companies are prominent players in the Cattle Dewormers Industry?
Key companies in the market include Elanco, Boehringer Ingelheim GmbH, Zoetis Inc *List Not Exhaustive, Durvet Inc, Merck & Co Inc, Bayer AG, Manna Pro Products LLC, Virbac, First Priority Inc, Jeffers Inc.
3. What are the main segments of the Cattle Dewormers Industry?
The market segments include Animal Type, Mode of Administration.
4. Can you provide details about the market size?
The market size is estimated to be USD 7.80 Million as of 2022.
5. What are some drivers contributing to market growth?
Rise in Prevalence of Parasitic Diseases in Livestock Animals; Growth in Demand for Animal-based Food Products.
6. What are the notable trends driving market growth?
The Cattle Segment is Expected to Show Better Growth Over the Forecast Years.
7. Are there any restraints impacting market growth?
Side Effects Associated with Dewormers.
8. Can you provide examples of recent developments in the market?
In February 2022, Sharana, NGO registered in Pondicherry, India, organized a Cattle Health and Awareness Camp in Angalakuppam in collaboration with the Tamil Nadu Government Animal Husbandry Department. In total, over 250 cattle received support in this camp.
9. What pricing options are available for accessing the report?
Pricing options include single-user, multi-user, and enterprise licenses priced at USD 4750, USD 5250, and USD 8750 respectively.
10. Is the market size provided in terms of value or volume?
The market size is provided in terms of value, measured in Million.
11. Are there any specific market keywords associated with the report?
Yes, the market keyword associated with the report is "Cattle Dewormers Industry," which aids in identifying and referencing the specific market segment covered.
12. How do I determine which pricing option suits my needs best?
The pricing options vary based on user requirements and access needs. Individual users may opt for single-user licenses, while businesses requiring broader access may choose multi-user or enterprise licenses for cost-effective access to the report.
13. Are there any additional resources or data provided in the Cattle Dewormers Industry report?
While the report offers comprehensive insights, it's advisable to review the specific contents or supplementary materials provided to ascertain if additional resources or data are available.
14. How can I stay updated on further developments or reports in the Cattle Dewormers Industry?
To stay informed about further developments, trends, and reports in the Cattle Dewormers Industry, consider subscribing to industry newsletters, following relevant companies and organizations, or regularly checking reputable industry news sources and publications.
Methodology
Step 1 - Identification of Relevant Samples Size from Population Database


Step 2 - Approaches for Defining Global Market Size (Value, Volume* & Price*)

Note*: In applicable scenarios
Step 3 - Data Sources
Primary Research
- Web Analytics
- Survey Reports
- Research Institute
- Latest Research Reports
- Opinion Leaders
Secondary Research
- Annual Reports
- White Paper
- Latest Press Release
- Industry Association
- Paid Database
- Investor Presentations

Step 4 - Data Triangulation
Involves using different sources of information in order to increase the validity of a study
These sources are likely to be stakeholders in a program - participants, other researchers, program staff, other community members, and so on.
Then we put all data in single framework & apply various statistical tools to find out the dynamic on the market.
During the analysis stage, feedback from the stakeholder groups would be compared to determine areas of agreement as well as areas of divergence


