
Key Insights
The global carrier screening market, valued at $5.12 billion in 2025, is projected to experience robust growth, driven by several key factors. Rising awareness of genetic disorders and advancements in screening technologies, particularly molecular screening tests, are significantly boosting market expansion. The increasing prevalence of autosomal recessive genetic disorders like cystic fibrosis, Tay-Sachs, and sickle cell disease is creating a greater demand for accurate and timely carrier screening. Furthermore, the expanding accessibility of genetic testing, coupled with decreasing costs, is making these tests more affordable and accessible to a wider population, fueling market growth. Government initiatives promoting genetic screening programs and the increasing integration of carrier screening into routine prenatal care also contribute positively to the market's trajectory. Geographic expansion, particularly in developing regions with rising healthcare infrastructure and awareness, presents significant opportunities. However, challenges such as ethical concerns surrounding genetic information, variations in reimbursement policies across different healthcare systems, and the need for ongoing education and counseling around test results represent potential restraints.
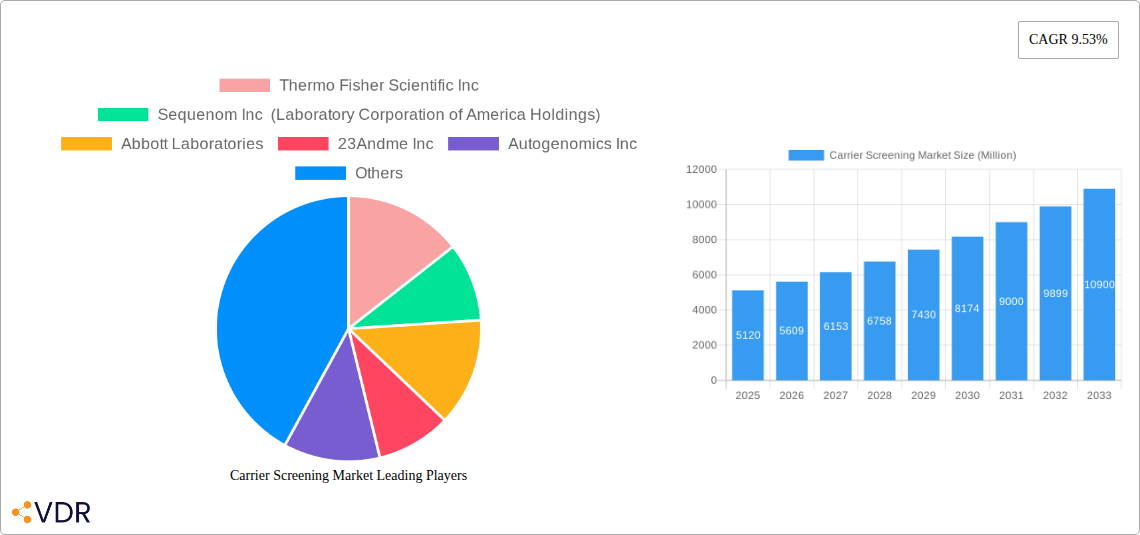
The market segmentation reveals a strong preference for molecular screening tests due to their superior accuracy and ability to detect a wider range of genetic mutations. Within disease types, cystic fibrosis and sickle cell disease currently hold a larger market share due to their higher prevalence and established screening protocols. However, growing awareness of rarer disorders like Tay-Sachs and Gaucher disease is expected to fuel segment growth in the forecast period. Key players like Thermo Fisher Scientific, Illumina, and Abbott Laboratories are driving innovation in this space through the development of advanced testing platforms and improved analytical tools. Competition is fierce, characterized by a focus on improving test accuracy, reducing costs, and expanding test accessibility. The projected CAGR of 9.53% indicates consistent growth throughout the forecast period (2025-2033), with significant market expansion expected across all regions, particularly in North America and Asia-Pacific.
Carrier Screening Market Report: 2019-2033
This comprehensive report provides a detailed analysis of the Carrier Screening Market, encompassing market dynamics, growth trends, regional segmentation, product landscape, key players, and future outlook. The report covers the period from 2019 to 2033, with a base year of 2025 and a forecast period from 2025 to 2033. The market is segmented by Test Type (Molecular Screening Test, Biochemical Screening Test) and Disease Type (Cystic Fibrosis, Tay-Sachs, Gaucher Disease, Sickle Cell Disease, Spinal Muscular Atrophy, Other Autosomal Recessive Genetic Disorders). The estimated market size in 2025 is xx Million.
Carrier Screening Market Dynamics & Structure
The Carrier Screening market is characterized by a moderately consolidated structure, with key players like Thermo Fisher Scientific Inc, Illumina Inc, and Myriad Genetics holding significant market share. However, the market also exhibits a considerable presence of smaller, specialized companies driving innovation. Technological advancements, particularly in next-generation sequencing (NGS) and microarrays, are major growth drivers. Stringent regulatory frameworks, including those governing diagnostic testing, significantly influence market dynamics. The market faces competition from alternative diagnostic methods but benefits from increasing awareness of genetic disorders and the growing demand for prenatal and preconception carrier screening. Mergers and acquisitions (M&A) activity within the sector reflects ongoing consolidation and expansion strategies, with an estimated xx M&A deals concluded between 2019 and 2024.
- Market Concentration: Moderately consolidated, with a few major players dominating.
- Technological Innovation: NGS and microarray technologies are key drivers.
- Regulatory Landscape: Stringent regulations governing diagnostic tests.
- Competitive Substitutes: Alternative diagnostic methods pose some competition.
- End-User Demographics: Growing awareness among prospective parents and couples.
- M&A Trends: Consistent M&A activity, indicating market consolidation.
Carrier Screening Market Growth Trends & Insights
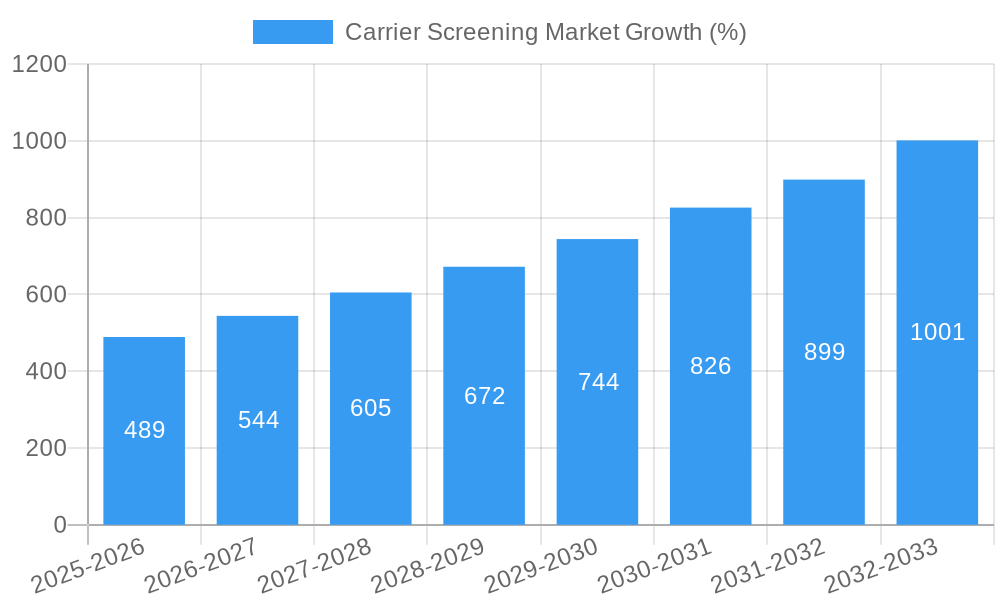
The Carrier Screening market has witnessed robust growth between 2019 and 2024, driven by increasing awareness of genetic disorders, advancements in screening technologies, and expanding access to healthcare. The market is expected to maintain a significant Compound Annual Growth Rate (CAGR) of xx% during the forecast period (2025-2033), reaching an estimated xx Million by 2033. This growth is fueled by factors such as technological advancements, increasing adoption of carrier screening tests, expanding genetic testing reimbursement policies, and rising disposable incomes. Changing consumer behavior, with greater emphasis on proactive healthcare and family planning, also contributes significantly. Market penetration is expected to increase from xx% in 2024 to xx% by 2033.
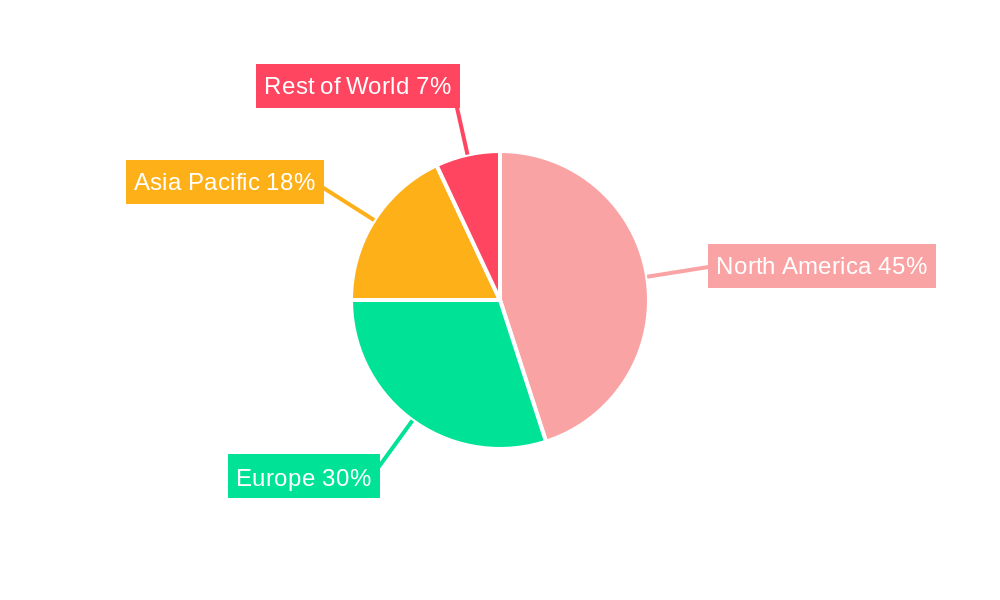
Dominant Regions, Countries, or Segments in Carrier Screening Market
North America currently holds the largest market share in carrier screening, driven by high healthcare expenditure, advanced infrastructure, and strong regulatory support. Within the test types, Molecular Screening Tests dominate due to their higher accuracy and efficiency, representing approximately xx% of the market in 2025. Among disease types, Cystic Fibrosis and Sickle Cell Disease screening contribute significantly to market growth, driven by widespread awareness and established screening programs.
- North America: High healthcare expenditure, advanced infrastructure, strong regulatory support.
- Europe: Growing adoption of carrier screening and increasing government funding.
- Asia-Pacific: Expanding awareness and rising disposable incomes driving growth.
- Molecular Screening Tests: Dominates due to superior accuracy and efficiency.
- Cystic Fibrosis & Sickle Cell Disease: High prevalence and established screening programs fuel growth.
Carrier Screening Market Product Landscape
The Carrier Screening market offers a range of products, including panels screening for multiple genetic disorders and individual tests targeting specific diseases. Key innovations include the integration of NGS for higher throughput and cost-effectiveness, along with the development of user-friendly home testing kits. The unique selling propositions often include accuracy, speed, and comprehensive reporting.
Key Drivers, Barriers & Challenges in Carrier Screening Market
Key Drivers: Technological advancements (NGS, microarrays), increased awareness of genetic disorders, rising disposable incomes, expanding healthcare coverage.
Challenges: High cost of testing, limited access in certain regions, regulatory hurdles, ethical concerns related to genetic information, and competition from alternative screening methods. The cost of NGS testing, for example, can be a significant barrier to access, impacting market growth in price-sensitive regions.
Emerging Opportunities in Carrier Screening Market
Expanding into untapped markets (developing countries), development of personalized carrier screening panels based on ethnicity and family history, integration with telehealth platforms for enhanced access, and the development of non-invasive prenatal testing (NIPT) for expanded applications represent key emerging opportunities.
Growth Accelerators in the Carrier Screening Market Industry
Strategic partnerships, such as the one between Oxford Nanopore Technologies and Bio-Techne, are accelerating growth by enhancing technological capabilities and expanding market reach. Continued investment in research and development, leading to more accurate and cost-effective technologies, will drive the market forward.
Key Players Shaping the Carrier Screening Market Market
- Thermo Fisher Scientific Inc
- Sequenom Inc (Laboratory Corporation of America Holdings)
- Abbott Laboratories
- 23Andme Inc
- Autogenomics Inc
- F Hoffmann-La Roche AG
- Myriad Genetics
- Illumina Inc
- Luminex Corporation
- Cepheid (Danaher Corporation)
Notable Milestones in Carrier Screening Market Sector
- December 2022: Oxford Nanopore Technologies and Bio-Techne formed a strategic partnership to develop an integrated wet- and dry-lab kit for genotyping 11 genes essential for carrier screening.
- March 2022: BillionToOne raised USD 125 million in Series C funding, highlighting significant investor confidence in the sector.
In-Depth Carrier Screening Market Market Outlook
The Carrier Screening market is poised for continued growth, driven by ongoing technological innovation, expanding access to healthcare, and rising awareness of genetic disorders. Strategic partnerships and investments in research and development will further fuel market expansion, creating significant opportunities for players in the coming years. The market's future potential lies in personalized medicine and the integration of carrier screening with broader genetic health assessments.
Carrier Screening Market Segmentation
-
1. Test Type
- 1.1. Molecular Screening Test
- 1.2. Biochemical Screening Test
-
2. Disease Type
- 2.1. Cystic Fibrosis
- 2.2. Tay-Sachs
- 2.3. Gaucher Disease
- 2.4. Sickle Cell Disease
- 2.5. Spinal Muscular Atrophy
- 2.6. Other Autosomal Recessive Genetic Disorders
Carrier Screening Market Segmentation By Geography
-
1. North America
- 1.1. United States
- 1.2. Canada
- 1.3. Mexico
-
2. Europe
- 2.1. Germany
- 2.2. United Kingdom
- 2.3. France
- 2.4. Italy
- 2.5. Spain
- 2.6. Rest of Europe
-
3. Asia Pacific
- 3.1. China
- 3.2. Japan
- 3.3. India
- 3.4. Australia
- 3.5. South Korea
- 3.6. Rest of Asia Pacific
-
4. Middle East and Africa
- 4.1. GCC
- 4.2. South Africa
- 4.3. Rest of Middle East and Africa
-
5. South America
- 5.1. Brazil
- 5.2. Argentina
- 5.3. Rest of South America
Carrier Screening Market REPORT HIGHLIGHTS
| Aspects | Details |
|---|---|
| Study Period | 2019-2033 |
| Base Year | 2024 |
| Estimated Year | 2025 |
| Forecast Period | 2025-2033 |
| Historical Period | 2019-2024 |
| Growth Rate | CAGR of 9.53% from 2019-2033 |
| Segmentation |
|
Table of Contents
- 1. Introduction
- 1.1. Research Scope
- 1.2. Market Segmentation
- 1.3. Research Methodology
- 1.4. Definitions and Assumptions
- 2. Executive Summary
- 2.1. Introduction
- 3. Market Dynamics
- 3.1. Introduction
- 3.2. Market Drivers
- 3.2.1. Increasing Emphasis on Early Disease Detection and Prevention; Rising Demand for Personalized Medicine; Increasing Application of Screening Tests in Genetic Disorders
- 3.3. Market Restrains
- 3.3.1. Social and Ethical Implications of Carrier Screening; High Costs and Reimbursement Issues of Carrier Testing
- 3.4. Market Trends
- 3.4.1. Molecular Screening Test Segment is Expected to Register Significant Growth during the Forecast Period
- 4. Market Factor Analysis
- 4.1. Porters Five Forces
- 4.2. Supply/Value Chain
- 4.3. PESTEL analysis
- 4.4. Market Entropy
- 4.5. Patent/Trademark Analysis
- 5. Global Carrier Screening Market Analysis, Insights and Forecast, 2019-2031
- 5.1. Market Analysis, Insights and Forecast - by Test Type
- 5.1.1. Molecular Screening Test
- 5.1.2. Biochemical Screening Test
- 5.2. Market Analysis, Insights and Forecast - by Disease Type
- 5.2.1. Cystic Fibrosis
- 5.2.2. Tay-Sachs
- 5.2.3. Gaucher Disease
- 5.2.4. Sickle Cell Disease
- 5.2.5. Spinal Muscular Atrophy
- 5.2.6. Other Autosomal Recessive Genetic Disorders
- 5.3. Market Analysis, Insights and Forecast - by Region
- 5.3.1. North America
- 5.3.2. Europe
- 5.3.3. Asia Pacific
- 5.3.4. Middle East and Africa
- 5.3.5. South America
- 5.1. Market Analysis, Insights and Forecast - by Test Type
- 6. North America Carrier Screening Market Analysis, Insights and Forecast, 2019-2031
- 6.1. Market Analysis, Insights and Forecast - by Test Type
- 6.1.1. Molecular Screening Test
- 6.1.2. Biochemical Screening Test
- 6.2. Market Analysis, Insights and Forecast - by Disease Type
- 6.2.1. Cystic Fibrosis
- 6.2.2. Tay-Sachs
- 6.2.3. Gaucher Disease
- 6.2.4. Sickle Cell Disease
- 6.2.5. Spinal Muscular Atrophy
- 6.2.6. Other Autosomal Recessive Genetic Disorders
- 6.1. Market Analysis, Insights and Forecast - by Test Type
- 7. Europe Carrier Screening Market Analysis, Insights and Forecast, 2019-2031
- 7.1. Market Analysis, Insights and Forecast - by Test Type
- 7.1.1. Molecular Screening Test
- 7.1.2. Biochemical Screening Test
- 7.2. Market Analysis, Insights and Forecast - by Disease Type
- 7.2.1. Cystic Fibrosis
- 7.2.2. Tay-Sachs
- 7.2.3. Gaucher Disease
- 7.2.4. Sickle Cell Disease
- 7.2.5. Spinal Muscular Atrophy
- 7.2.6. Other Autosomal Recessive Genetic Disorders
- 7.1. Market Analysis, Insights and Forecast - by Test Type
- 8. Asia Pacific Carrier Screening Market Analysis, Insights and Forecast, 2019-2031
- 8.1. Market Analysis, Insights and Forecast - by Test Type
- 8.1.1. Molecular Screening Test
- 8.1.2. Biochemical Screening Test
- 8.2. Market Analysis, Insights and Forecast - by Disease Type
- 8.2.1. Cystic Fibrosis
- 8.2.2. Tay-Sachs
- 8.2.3. Gaucher Disease
- 8.2.4. Sickle Cell Disease
- 8.2.5. Spinal Muscular Atrophy
- 8.2.6. Other Autosomal Recessive Genetic Disorders
- 8.1. Market Analysis, Insights and Forecast - by Test Type
- 9. Middle East and Africa Carrier Screening Market Analysis, Insights and Forecast, 2019-2031
- 9.1. Market Analysis, Insights and Forecast - by Test Type
- 9.1.1. Molecular Screening Test
- 9.1.2. Biochemical Screening Test
- 9.2. Market Analysis, Insights and Forecast - by Disease Type
- 9.2.1. Cystic Fibrosis
- 9.2.2. Tay-Sachs
- 9.2.3. Gaucher Disease
- 9.2.4. Sickle Cell Disease
- 9.2.5. Spinal Muscular Atrophy
- 9.2.6. Other Autosomal Recessive Genetic Disorders
- 9.1. Market Analysis, Insights and Forecast - by Test Type
- 10. South America Carrier Screening Market Analysis, Insights and Forecast, 2019-2031
- 10.1. Market Analysis, Insights and Forecast - by Test Type
- 10.1.1. Molecular Screening Test
- 10.1.2. Biochemical Screening Test
- 10.2. Market Analysis, Insights and Forecast - by Disease Type
- 10.2.1. Cystic Fibrosis
- 10.2.2. Tay-Sachs
- 10.2.3. Gaucher Disease
- 10.2.4. Sickle Cell Disease
- 10.2.5. Spinal Muscular Atrophy
- 10.2.6. Other Autosomal Recessive Genetic Disorders
- 10.1. Market Analysis, Insights and Forecast - by Test Type
- 11. North Americ Carrier Screening Market Analysis, Insights and Forecast, 2019-2031
- 11.1. Market Analysis, Insights and Forecast - By Country/Sub-region
- 11.1.1 United States
- 11.1.2 Canada
- 11.1.3 Mexico
- 12. South America Carrier Screening Market Analysis, Insights and Forecast, 2019-2031
- 12.1. Market Analysis, Insights and Forecast - By Country/Sub-region
- 12.1.1 Brazil
- 12.1.2 Mexico
- 12.1.3 Rest of South America
- 13. Europe Carrier Screening Market Analysis, Insights and Forecast, 2019-2031
- 13.1. Market Analysis, Insights and Forecast - By Country/Sub-region
- 13.1.1 Germany
- 13.1.2 United Kingdom
- 13.1.3 France
- 13.1.4 Italy
- 13.1.5 Spain
- 13.1.6 Rest of Europe
- 14. Asia Pacific Carrier Screening Market Analysis, Insights and Forecast, 2019-2031
- 14.1. Market Analysis, Insights and Forecast - By Country/Sub-region
- 14.1.1 China
- 14.1.2 Japan
- 14.1.3 India
- 14.1.4 South Korea
- 14.1.5 Taiwan
- 14.1.6 Australia
- 14.1.7 Rest of Asia-Pacific
- 15. MEA Carrier Screening Market Analysis, Insights and Forecast, 2019-2031
- 15.1. Market Analysis, Insights and Forecast - By Country/Sub-region
- 15.1.1 Middle East
- 15.1.2 Africa
- 16. Competitive Analysis
- 16.1. Global Market Share Analysis 2024
- 16.2. Company Profiles
- 16.2.1 Thermo Fisher Scientific Inc
- 16.2.1.1. Overview
- 16.2.1.2. Products
- 16.2.1.3. SWOT Analysis
- 16.2.1.4. Recent Developments
- 16.2.1.5. Financials (Based on Availability)
- 16.2.2 Sequenom Inc (Laboratory Corporation of America Holdings)
- 16.2.2.1. Overview
- 16.2.2.2. Products
- 16.2.2.3. SWOT Analysis
- 16.2.2.4. Recent Developments
- 16.2.2.5. Financials (Based on Availability)
- 16.2.3 Abbott Laboratories
- 16.2.3.1. Overview
- 16.2.3.2. Products
- 16.2.3.3. SWOT Analysis
- 16.2.3.4. Recent Developments
- 16.2.3.5. Financials (Based on Availability)
- 16.2.4 23Andme Inc
- 16.2.4.1. Overview
- 16.2.4.2. Products
- 16.2.4.3. SWOT Analysis
- 16.2.4.4. Recent Developments
- 16.2.4.5. Financials (Based on Availability)
- 16.2.5 Autogenomics Inc
- 16.2.5.1. Overview
- 16.2.5.2. Products
- 16.2.5.3. SWOT Analysis
- 16.2.5.4. Recent Developments
- 16.2.5.5. Financials (Based on Availability)
- 16.2.6 F Hoffmann-La Roche AG
- 16.2.6.1. Overview
- 16.2.6.2. Products
- 16.2.6.3. SWOT Analysis
- 16.2.6.4. Recent Developments
- 16.2.6.5. Financials (Based on Availability)
- 16.2.7 Myriad Genetics
- 16.2.7.1. Overview
- 16.2.7.2. Products
- 16.2.7.3. SWOT Analysis
- 16.2.7.4. Recent Developments
- 16.2.7.5. Financials (Based on Availability)
- 16.2.8 Illumina Inc
- 16.2.8.1. Overview
- 16.2.8.2. Products
- 16.2.8.3. SWOT Analysis
- 16.2.8.4. Recent Developments
- 16.2.8.5. Financials (Based on Availability)
- 16.2.9 Luminex Corporation
- 16.2.9.1. Overview
- 16.2.9.2. Products
- 16.2.9.3. SWOT Analysis
- 16.2.9.4. Recent Developments
- 16.2.9.5. Financials (Based on Availability)
- 16.2.10 Cepheid (Danaher Corporation)
- 16.2.10.1. Overview
- 16.2.10.2. Products
- 16.2.10.3. SWOT Analysis
- 16.2.10.4. Recent Developments
- 16.2.10.5. Financials (Based on Availability)
- 16.2.1 Thermo Fisher Scientific Inc
List of Figures
- Figure 1: Global Carrier Screening Market Revenue Breakdown (Million, %) by Region 2024 & 2032
- Figure 2: Global Carrier Screening Market Volume Breakdown (K Units, %) by Region 2024 & 2032
- Figure 3: North Americ Carrier Screening Market Revenue (Million), by Country 2024 & 2032
- Figure 4: North Americ Carrier Screening Market Volume (K Units), by Country 2024 & 2032
- Figure 5: North Americ Carrier Screening Market Revenue Share (%), by Country 2024 & 2032
- Figure 6: North Americ Carrier Screening Market Volume Share (%), by Country 2024 & 2032
- Figure 7: South America Carrier Screening Market Revenue (Million), by Country 2024 & 2032
- Figure 8: South America Carrier Screening Market Volume (K Units), by Country 2024 & 2032
- Figure 9: South America Carrier Screening Market Revenue Share (%), by Country 2024 & 2032
- Figure 10: South America Carrier Screening Market Volume Share (%), by Country 2024 & 2032
- Figure 11: Europe Carrier Screening Market Revenue (Million), by Country 2024 & 2032
- Figure 12: Europe Carrier Screening Market Volume (K Units), by Country 2024 & 2032
- Figure 13: Europe Carrier Screening Market Revenue Share (%), by Country 2024 & 2032
- Figure 14: Europe Carrier Screening Market Volume Share (%), by Country 2024 & 2032
- Figure 15: Asia Pacific Carrier Screening Market Revenue (Million), by Country 2024 & 2032
- Figure 16: Asia Pacific Carrier Screening Market Volume (K Units), by Country 2024 & 2032
- Figure 17: Asia Pacific Carrier Screening Market Revenue Share (%), by Country 2024 & 2032
- Figure 18: Asia Pacific Carrier Screening Market Volume Share (%), by Country 2024 & 2032
- Figure 19: MEA Carrier Screening Market Revenue (Million), by Country 2024 & 2032
- Figure 20: MEA Carrier Screening Market Volume (K Units), by Country 2024 & 2032
- Figure 21: MEA Carrier Screening Market Revenue Share (%), by Country 2024 & 2032
- Figure 22: MEA Carrier Screening Market Volume Share (%), by Country 2024 & 2032
- Figure 23: North America Carrier Screening Market Revenue (Million), by Test Type 2024 & 2032
- Figure 24: North America Carrier Screening Market Volume (K Units), by Test Type 2024 & 2032
- Figure 25: North America Carrier Screening Market Revenue Share (%), by Test Type 2024 & 2032
- Figure 26: North America Carrier Screening Market Volume Share (%), by Test Type 2024 & 2032
- Figure 27: North America Carrier Screening Market Revenue (Million), by Disease Type 2024 & 2032
- Figure 28: North America Carrier Screening Market Volume (K Units), by Disease Type 2024 & 2032
- Figure 29: North America Carrier Screening Market Revenue Share (%), by Disease Type 2024 & 2032
- Figure 30: North America Carrier Screening Market Volume Share (%), by Disease Type 2024 & 2032
- Figure 31: North America Carrier Screening Market Revenue (Million), by Country 2024 & 2032
- Figure 32: North America Carrier Screening Market Volume (K Units), by Country 2024 & 2032
- Figure 33: North America Carrier Screening Market Revenue Share (%), by Country 2024 & 2032
- Figure 34: North America Carrier Screening Market Volume Share (%), by Country 2024 & 2032
- Figure 35: Europe Carrier Screening Market Revenue (Million), by Test Type 2024 & 2032
- Figure 36: Europe Carrier Screening Market Volume (K Units), by Test Type 2024 & 2032
- Figure 37: Europe Carrier Screening Market Revenue Share (%), by Test Type 2024 & 2032
- Figure 38: Europe Carrier Screening Market Volume Share (%), by Test Type 2024 & 2032
- Figure 39: Europe Carrier Screening Market Revenue (Million), by Disease Type 2024 & 2032
- Figure 40: Europe Carrier Screening Market Volume (K Units), by Disease Type 2024 & 2032
- Figure 41: Europe Carrier Screening Market Revenue Share (%), by Disease Type 2024 & 2032
- Figure 42: Europe Carrier Screening Market Volume Share (%), by Disease Type 2024 & 2032
- Figure 43: Europe Carrier Screening Market Revenue (Million), by Country 2024 & 2032
- Figure 44: Europe Carrier Screening Market Volume (K Units), by Country 2024 & 2032
- Figure 45: Europe Carrier Screening Market Revenue Share (%), by Country 2024 & 2032
- Figure 46: Europe Carrier Screening Market Volume Share (%), by Country 2024 & 2032
- Figure 47: Asia Pacific Carrier Screening Market Revenue (Million), by Test Type 2024 & 2032
- Figure 48: Asia Pacific Carrier Screening Market Volume (K Units), by Test Type 2024 & 2032
- Figure 49: Asia Pacific Carrier Screening Market Revenue Share (%), by Test Type 2024 & 2032
- Figure 50: Asia Pacific Carrier Screening Market Volume Share (%), by Test Type 2024 & 2032
- Figure 51: Asia Pacific Carrier Screening Market Revenue (Million), by Disease Type 2024 & 2032
- Figure 52: Asia Pacific Carrier Screening Market Volume (K Units), by Disease Type 2024 & 2032
- Figure 53: Asia Pacific Carrier Screening Market Revenue Share (%), by Disease Type 2024 & 2032
- Figure 54: Asia Pacific Carrier Screening Market Volume Share (%), by Disease Type 2024 & 2032
- Figure 55: Asia Pacific Carrier Screening Market Revenue (Million), by Country 2024 & 2032
- Figure 56: Asia Pacific Carrier Screening Market Volume (K Units), by Country 2024 & 2032
- Figure 57: Asia Pacific Carrier Screening Market Revenue Share (%), by Country 2024 & 2032
- Figure 58: Asia Pacific Carrier Screening Market Volume Share (%), by Country 2024 & 2032
- Figure 59: Middle East and Africa Carrier Screening Market Revenue (Million), by Test Type 2024 & 2032
- Figure 60: Middle East and Africa Carrier Screening Market Volume (K Units), by Test Type 2024 & 2032
- Figure 61: Middle East and Africa Carrier Screening Market Revenue Share (%), by Test Type 2024 & 2032
- Figure 62: Middle East and Africa Carrier Screening Market Volume Share (%), by Test Type 2024 & 2032
- Figure 63: Middle East and Africa Carrier Screening Market Revenue (Million), by Disease Type 2024 & 2032
- Figure 64: Middle East and Africa Carrier Screening Market Volume (K Units), by Disease Type 2024 & 2032
- Figure 65: Middle East and Africa Carrier Screening Market Revenue Share (%), by Disease Type 2024 & 2032
- Figure 66: Middle East and Africa Carrier Screening Market Volume Share (%), by Disease Type 2024 & 2032
- Figure 67: Middle East and Africa Carrier Screening Market Revenue (Million), by Country 2024 & 2032
- Figure 68: Middle East and Africa Carrier Screening Market Volume (K Units), by Country 2024 & 2032
- Figure 69: Middle East and Africa Carrier Screening Market Revenue Share (%), by Country 2024 & 2032
- Figure 70: Middle East and Africa Carrier Screening Market Volume Share (%), by Country 2024 & 2032
- Figure 71: South America Carrier Screening Market Revenue (Million), by Test Type 2024 & 2032
- Figure 72: South America Carrier Screening Market Volume (K Units), by Test Type 2024 & 2032
- Figure 73: South America Carrier Screening Market Revenue Share (%), by Test Type 2024 & 2032
- Figure 74: South America Carrier Screening Market Volume Share (%), by Test Type 2024 & 2032
- Figure 75: South America Carrier Screening Market Revenue (Million), by Disease Type 2024 & 2032
- Figure 76: South America Carrier Screening Market Volume (K Units), by Disease Type 2024 & 2032
- Figure 77: South America Carrier Screening Market Revenue Share (%), by Disease Type 2024 & 2032
- Figure 78: South America Carrier Screening Market Volume Share (%), by Disease Type 2024 & 2032
- Figure 79: South America Carrier Screening Market Revenue (Million), by Country 2024 & 2032
- Figure 80: South America Carrier Screening Market Volume (K Units), by Country 2024 & 2032
- Figure 81: South America Carrier Screening Market Revenue Share (%), by Country 2024 & 2032
- Figure 82: South America Carrier Screening Market Volume Share (%), by Country 2024 & 2032
List of Tables
- Table 1: Global Carrier Screening Market Revenue Million Forecast, by Region 2019 & 2032
- Table 2: Global Carrier Screening Market Volume K Units Forecast, by Region 2019 & 2032
- Table 3: Global Carrier Screening Market Revenue Million Forecast, by Test Type 2019 & 2032
- Table 4: Global Carrier Screening Market Volume K Units Forecast, by Test Type 2019 & 2032
- Table 5: Global Carrier Screening Market Revenue Million Forecast, by Disease Type 2019 & 2032
- Table 6: Global Carrier Screening Market Volume K Units Forecast, by Disease Type 2019 & 2032
- Table 7: Global Carrier Screening Market Revenue Million Forecast, by Region 2019 & 2032
- Table 8: Global Carrier Screening Market Volume K Units Forecast, by Region 2019 & 2032
- Table 9: Global Carrier Screening Market Revenue Million Forecast, by Country 2019 & 2032
- Table 10: Global Carrier Screening Market Volume K Units Forecast, by Country 2019 & 2032
- Table 11: United States Carrier Screening Market Revenue (Million) Forecast, by Application 2019 & 2032
- Table 12: United States Carrier Screening Market Volume (K Units) Forecast, by Application 2019 & 2032
- Table 13: Canada Carrier Screening Market Revenue (Million) Forecast, by Application 2019 & 2032
- Table 14: Canada Carrier Screening Market Volume (K Units) Forecast, by Application 2019 & 2032
- Table 15: Mexico Carrier Screening Market Revenue (Million) Forecast, by Application 2019 & 2032
- Table 16: Mexico Carrier Screening Market Volume (K Units) Forecast, by Application 2019 & 2032
- Table 17: Global Carrier Screening Market Revenue Million Forecast, by Country 2019 & 2032
- Table 18: Global Carrier Screening Market Volume K Units Forecast, by Country 2019 & 2032
- Table 19: Brazil Carrier Screening Market Revenue (Million) Forecast, by Application 2019 & 2032
- Table 20: Brazil Carrier Screening Market Volume (K Units) Forecast, by Application 2019 & 2032
- Table 21: Mexico Carrier Screening Market Revenue (Million) Forecast, by Application 2019 & 2032
- Table 22: Mexico Carrier Screening Market Volume (K Units) Forecast, by Application 2019 & 2032
- Table 23: Rest of South America Carrier Screening Market Revenue (Million) Forecast, by Application 2019 & 2032
- Table 24: Rest of South America Carrier Screening Market Volume (K Units) Forecast, by Application 2019 & 2032
- Table 25: Global Carrier Screening Market Revenue Million Forecast, by Country 2019 & 2032
- Table 26: Global Carrier Screening Market Volume K Units Forecast, by Country 2019 & 2032
- Table 27: Germany Carrier Screening Market Revenue (Million) Forecast, by Application 2019 & 2032
- Table 28: Germany Carrier Screening Market Volume (K Units) Forecast, by Application 2019 & 2032
- Table 29: United Kingdom Carrier Screening Market Revenue (Million) Forecast, by Application 2019 & 2032
- Table 30: United Kingdom Carrier Screening Market Volume (K Units) Forecast, by Application 2019 & 2032
- Table 31: France Carrier Screening Market Revenue (Million) Forecast, by Application 2019 & 2032
- Table 32: France Carrier Screening Market Volume (K Units) Forecast, by Application 2019 & 2032
- Table 33: Italy Carrier Screening Market Revenue (Million) Forecast, by Application 2019 & 2032
- Table 34: Italy Carrier Screening Market Volume (K Units) Forecast, by Application 2019 & 2032
- Table 35: Spain Carrier Screening Market Revenue (Million) Forecast, by Application 2019 & 2032
- Table 36: Spain Carrier Screening Market Volume (K Units) Forecast, by Application 2019 & 2032
- Table 37: Rest of Europe Carrier Screening Market Revenue (Million) Forecast, by Application 2019 & 2032
- Table 38: Rest of Europe Carrier Screening Market Volume (K Units) Forecast, by Application 2019 & 2032
- Table 39: Global Carrier Screening Market Revenue Million Forecast, by Country 2019 & 2032
- Table 40: Global Carrier Screening Market Volume K Units Forecast, by Country 2019 & 2032
- Table 41: China Carrier Screening Market Revenue (Million) Forecast, by Application 2019 & 2032
- Table 42: China Carrier Screening Market Volume (K Units) Forecast, by Application 2019 & 2032
- Table 43: Japan Carrier Screening Market Revenue (Million) Forecast, by Application 2019 & 2032
- Table 44: Japan Carrier Screening Market Volume (K Units) Forecast, by Application 2019 & 2032
- Table 45: India Carrier Screening Market Revenue (Million) Forecast, by Application 2019 & 2032
- Table 46: India Carrier Screening Market Volume (K Units) Forecast, by Application 2019 & 2032
- Table 47: South Korea Carrier Screening Market Revenue (Million) Forecast, by Application 2019 & 2032
- Table 48: South Korea Carrier Screening Market Volume (K Units) Forecast, by Application 2019 & 2032
- Table 49: Taiwan Carrier Screening Market Revenue (Million) Forecast, by Application 2019 & 2032
- Table 50: Taiwan Carrier Screening Market Volume (K Units) Forecast, by Application 2019 & 2032
- Table 51: Australia Carrier Screening Market Revenue (Million) Forecast, by Application 2019 & 2032
- Table 52: Australia Carrier Screening Market Volume (K Units) Forecast, by Application 2019 & 2032
- Table 53: Rest of Asia-Pacific Carrier Screening Market Revenue (Million) Forecast, by Application 2019 & 2032
- Table 54: Rest of Asia-Pacific Carrier Screening Market Volume (K Units) Forecast, by Application 2019 & 2032
- Table 55: Global Carrier Screening Market Revenue Million Forecast, by Country 2019 & 2032
- Table 56: Global Carrier Screening Market Volume K Units Forecast, by Country 2019 & 2032
- Table 57: Middle East Carrier Screening Market Revenue (Million) Forecast, by Application 2019 & 2032
- Table 58: Middle East Carrier Screening Market Volume (K Units) Forecast, by Application 2019 & 2032
- Table 59: Africa Carrier Screening Market Revenue (Million) Forecast, by Application 2019 & 2032
- Table 60: Africa Carrier Screening Market Volume (K Units) Forecast, by Application 2019 & 2032
- Table 61: Global Carrier Screening Market Revenue Million Forecast, by Test Type 2019 & 2032
- Table 62: Global Carrier Screening Market Volume K Units Forecast, by Test Type 2019 & 2032
- Table 63: Global Carrier Screening Market Revenue Million Forecast, by Disease Type 2019 & 2032
- Table 64: Global Carrier Screening Market Volume K Units Forecast, by Disease Type 2019 & 2032
- Table 65: Global Carrier Screening Market Revenue Million Forecast, by Country 2019 & 2032
- Table 66: Global Carrier Screening Market Volume K Units Forecast, by Country 2019 & 2032
- Table 67: United States Carrier Screening Market Revenue (Million) Forecast, by Application 2019 & 2032
- Table 68: United States Carrier Screening Market Volume (K Units) Forecast, by Application 2019 & 2032
- Table 69: Canada Carrier Screening Market Revenue (Million) Forecast, by Application 2019 & 2032
- Table 70: Canada Carrier Screening Market Volume (K Units) Forecast, by Application 2019 & 2032
- Table 71: Mexico Carrier Screening Market Revenue (Million) Forecast, by Application 2019 & 2032
- Table 72: Mexico Carrier Screening Market Volume (K Units) Forecast, by Application 2019 & 2032
- Table 73: Global Carrier Screening Market Revenue Million Forecast, by Test Type 2019 & 2032
- Table 74: Global Carrier Screening Market Volume K Units Forecast, by Test Type 2019 & 2032
- Table 75: Global Carrier Screening Market Revenue Million Forecast, by Disease Type 2019 & 2032
- Table 76: Global Carrier Screening Market Volume K Units Forecast, by Disease Type 2019 & 2032
- Table 77: Global Carrier Screening Market Revenue Million Forecast, by Country 2019 & 2032
- Table 78: Global Carrier Screening Market Volume K Units Forecast, by Country 2019 & 2032
- Table 79: Germany Carrier Screening Market Revenue (Million) Forecast, by Application 2019 & 2032
- Table 80: Germany Carrier Screening Market Volume (K Units) Forecast, by Application 2019 & 2032
- Table 81: United Kingdom Carrier Screening Market Revenue (Million) Forecast, by Application 2019 & 2032
- Table 82: United Kingdom Carrier Screening Market Volume (K Units) Forecast, by Application 2019 & 2032
- Table 83: France Carrier Screening Market Revenue (Million) Forecast, by Application 2019 & 2032
- Table 84: France Carrier Screening Market Volume (K Units) Forecast, by Application 2019 & 2032
- Table 85: Italy Carrier Screening Market Revenue (Million) Forecast, by Application 2019 & 2032
- Table 86: Italy Carrier Screening Market Volume (K Units) Forecast, by Application 2019 & 2032
- Table 87: Spain Carrier Screening Market Revenue (Million) Forecast, by Application 2019 & 2032
- Table 88: Spain Carrier Screening Market Volume (K Units) Forecast, by Application 2019 & 2032
- Table 89: Rest of Europe Carrier Screening Market Revenue (Million) Forecast, by Application 2019 & 2032
- Table 90: Rest of Europe Carrier Screening Market Volume (K Units) Forecast, by Application 2019 & 2032
- Table 91: Global Carrier Screening Market Revenue Million Forecast, by Test Type 2019 & 2032
- Table 92: Global Carrier Screening Market Volume K Units Forecast, by Test Type 2019 & 2032
- Table 93: Global Carrier Screening Market Revenue Million Forecast, by Disease Type 2019 & 2032
- Table 94: Global Carrier Screening Market Volume K Units Forecast, by Disease Type 2019 & 2032
- Table 95: Global Carrier Screening Market Revenue Million Forecast, by Country 2019 & 2032
- Table 96: Global Carrier Screening Market Volume K Units Forecast, by Country 2019 & 2032
- Table 97: China Carrier Screening Market Revenue (Million) Forecast, by Application 2019 & 2032
- Table 98: China Carrier Screening Market Volume (K Units) Forecast, by Application 2019 & 2032
- Table 99: Japan Carrier Screening Market Revenue (Million) Forecast, by Application 2019 & 2032
- Table 100: Japan Carrier Screening Market Volume (K Units) Forecast, by Application 2019 & 2032
- Table 101: India Carrier Screening Market Revenue (Million) Forecast, by Application 2019 & 2032
- Table 102: India Carrier Screening Market Volume (K Units) Forecast, by Application 2019 & 2032
- Table 103: Australia Carrier Screening Market Revenue (Million) Forecast, by Application 2019 & 2032
- Table 104: Australia Carrier Screening Market Volume (K Units) Forecast, by Application 2019 & 2032
- Table 105: South Korea Carrier Screening Market Revenue (Million) Forecast, by Application 2019 & 2032
- Table 106: South Korea Carrier Screening Market Volume (K Units) Forecast, by Application 2019 & 2032
- Table 107: Rest of Asia Pacific Carrier Screening Market Revenue (Million) Forecast, by Application 2019 & 2032
- Table 108: Rest of Asia Pacific Carrier Screening Market Volume (K Units) Forecast, by Application 2019 & 2032
- Table 109: Global Carrier Screening Market Revenue Million Forecast, by Test Type 2019 & 2032
- Table 110: Global Carrier Screening Market Volume K Units Forecast, by Test Type 2019 & 2032
- Table 111: Global Carrier Screening Market Revenue Million Forecast, by Disease Type 2019 & 2032
- Table 112: Global Carrier Screening Market Volume K Units Forecast, by Disease Type 2019 & 2032
- Table 113: Global Carrier Screening Market Revenue Million Forecast, by Country 2019 & 2032
- Table 114: Global Carrier Screening Market Volume K Units Forecast, by Country 2019 & 2032
- Table 115: GCC Carrier Screening Market Revenue (Million) Forecast, by Application 2019 & 2032
- Table 116: GCC Carrier Screening Market Volume (K Units) Forecast, by Application 2019 & 2032
- Table 117: South Africa Carrier Screening Market Revenue (Million) Forecast, by Application 2019 & 2032
- Table 118: South Africa Carrier Screening Market Volume (K Units) Forecast, by Application 2019 & 2032
- Table 119: Rest of Middle East and Africa Carrier Screening Market Revenue (Million) Forecast, by Application 2019 & 2032
- Table 120: Rest of Middle East and Africa Carrier Screening Market Volume (K Units) Forecast, by Application 2019 & 2032
- Table 121: Global Carrier Screening Market Revenue Million Forecast, by Test Type 2019 & 2032
- Table 122: Global Carrier Screening Market Volume K Units Forecast, by Test Type 2019 & 2032
- Table 123: Global Carrier Screening Market Revenue Million Forecast, by Disease Type 2019 & 2032
- Table 124: Global Carrier Screening Market Volume K Units Forecast, by Disease Type 2019 & 2032
- Table 125: Global Carrier Screening Market Revenue Million Forecast, by Country 2019 & 2032
- Table 126: Global Carrier Screening Market Volume K Units Forecast, by Country 2019 & 2032
- Table 127: Brazil Carrier Screening Market Revenue (Million) Forecast, by Application 2019 & 2032
- Table 128: Brazil Carrier Screening Market Volume (K Units) Forecast, by Application 2019 & 2032
- Table 129: Argentina Carrier Screening Market Revenue (Million) Forecast, by Application 2019 & 2032
- Table 130: Argentina Carrier Screening Market Volume (K Units) Forecast, by Application 2019 & 2032
- Table 131: Rest of South America Carrier Screening Market Revenue (Million) Forecast, by Application 2019 & 2032
- Table 132: Rest of South America Carrier Screening Market Volume (K Units) Forecast, by Application 2019 & 2032
Frequently Asked Questions
1. What is the projected Compound Annual Growth Rate (CAGR) of the Carrier Screening Market?
The projected CAGR is approximately 9.53%.
2. Which companies are prominent players in the Carrier Screening Market?
Key companies in the market include Thermo Fisher Scientific Inc, Sequenom Inc (Laboratory Corporation of America Holdings), Abbott Laboratories, 23Andme Inc, Autogenomics Inc, F Hoffmann-La Roche AG, Myriad Genetics, Illumina Inc, Luminex Corporation, Cepheid (Danaher Corporation).
3. What are the main segments of the Carrier Screening Market?
The market segments include Test Type, Disease Type.
4. Can you provide details about the market size?
The market size is estimated to be USD 5.12 Million as of 2022.
5. What are some drivers contributing to market growth?
Increasing Emphasis on Early Disease Detection and Prevention; Rising Demand for Personalized Medicine; Increasing Application of Screening Tests in Genetic Disorders.
6. What are the notable trends driving market growth?
Molecular Screening Test Segment is Expected to Register Significant Growth during the Forecast Period.
7. Are there any restraints impacting market growth?
Social and Ethical Implications of Carrier Screening; High Costs and Reimbursement Issues of Carrier Testing.
8. Can you provide examples of recent developments in the market?
December 2022- Oxford Nanopore Technologies and Bio-Techne formed a strategic partnership to develop an integrated wet- and dry-lab kit for genotyping 11 genes essential for carrier screening.
9. What pricing options are available for accessing the report?
Pricing options include single-user, multi-user, and enterprise licenses priced at USD 4750, USD 5250, and USD 8750 respectively.
10. Is the market size provided in terms of value or volume?
The market size is provided in terms of value, measured in Million and volume, measured in K Units.
11. Are there any specific market keywords associated with the report?
Yes, the market keyword associated with the report is "Carrier Screening Market," which aids in identifying and referencing the specific market segment covered.
12. How do I determine which pricing option suits my needs best?
The pricing options vary based on user requirements and access needs. Individual users may opt for single-user licenses, while businesses requiring broader access may choose multi-user or enterprise licenses for cost-effective access to the report.
13. Are there any additional resources or data provided in the Carrier Screening Market report?
While the report offers comprehensive insights, it's advisable to review the specific contents or supplementary materials provided to ascertain if additional resources or data are available.
14. How can I stay updated on further developments or reports in the Carrier Screening Market?
To stay informed about further developments, trends, and reports in the Carrier Screening Market, consider subscribing to industry newsletters, following relevant companies and organizations, or regularly checking reputable industry news sources and publications.
Methodology
Step 1 - Identification of Relevant Samples Size from Population Database


Step 2 - Approaches for Defining Global Market Size (Value, Volume* & Price*)

Note*: In applicable scenarios
Step 3 - Data Sources
Primary Research
- Web Analytics
- Survey Reports
- Research Institute
- Latest Research Reports
- Opinion Leaders
Secondary Research
- Annual Reports
- White Paper
- Latest Press Release
- Industry Association
- Paid Database
- Investor Presentations

Step 4 - Data Triangulation
Involves using different sources of information in order to increase the validity of a study
These sources are likely to be stakeholders in a program - participants, other researchers, program staff, other community members, and so on.
Then we put all data in single framework & apply various statistical tools to find out the dynamic on the market.
During the analysis stage, feedback from the stakeholder groups would be compared to determine areas of agreement as well as areas of divergence


