

Key Insights
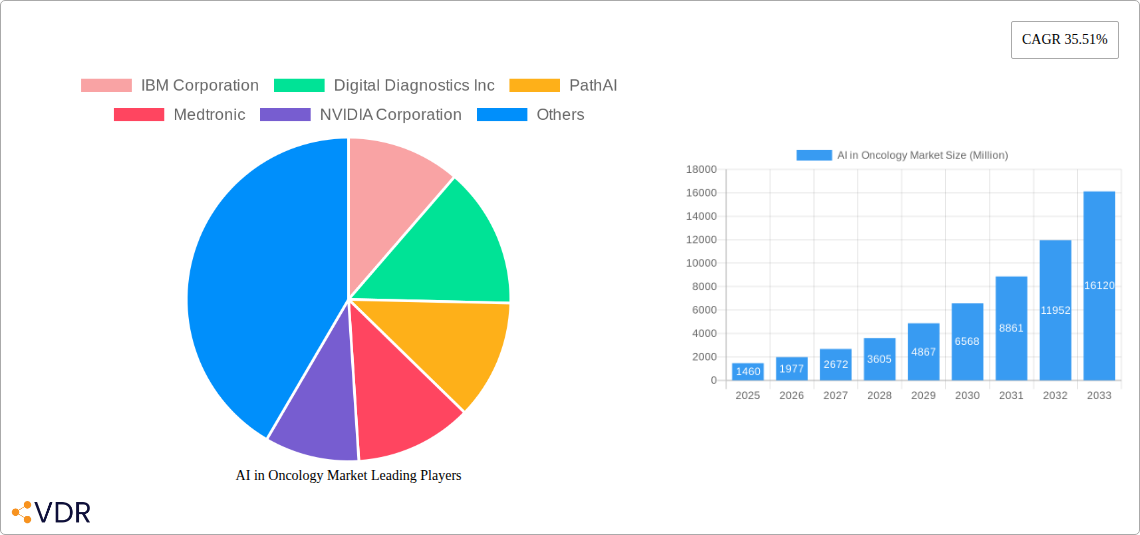
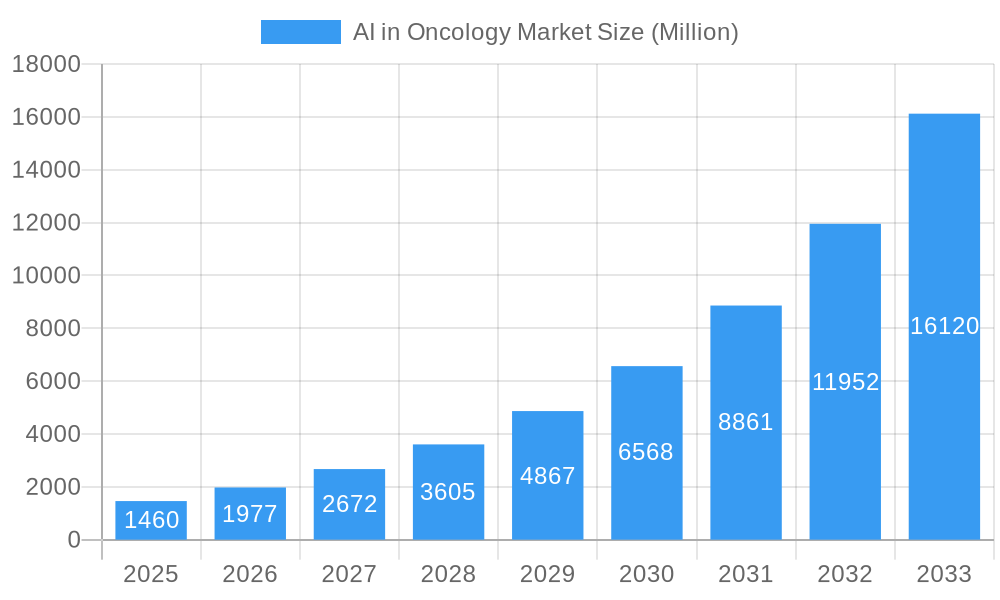
The AI in Oncology market is experiencing explosive growth, projected to reach $1.46 billion in 2025 and exhibiting a remarkable Compound Annual Growth Rate (CAGR) of 35.51% from 2025 to 2033. This surge is driven by several key factors. Firstly, the increasing prevalence of cancer globally necessitates more efficient and accurate diagnostic and treatment methods. AI offers significant advancements in image analysis for early cancer detection, personalized treatment planning based on individual patient profiles (considering factors like genetic predisposition and tumor characteristics), and the accelerated development of novel cancer therapies. Secondly, technological advancements in machine learning and deep learning algorithms are enhancing the accuracy and speed of AI-powered tools, leading to improved clinical outcomes and reduced healthcare costs. Thirdly, growing collaborations between technology companies, research institutions, and healthcare providers are fostering innovation and accelerating the adoption of AI solutions in oncology. The market is segmented by component (software, hardware, services), cancer type (breast, lung, prostate, colorectal, brain, and others), treatment type (chemotherapy, radiotherapy, immunotherapy, and others), and application (cancer detection, drug discovery, drug development, and others). North America currently holds a significant market share due to its advanced healthcare infrastructure and strong research capabilities, but the Asia-Pacific region is anticipated to witness substantial growth in the coming years fueled by rising healthcare spending and increasing technological adoption. The market's growth, however, might face some challenges including data privacy concerns, high implementation costs, and the need for robust regulatory frameworks to ensure the ethical and safe deployment of AI in healthcare.
AI in Oncology Market Market Size (In Billion)
The competitive landscape is characterized by a mix of established technology giants like IBM, NVIDIA, and Medtronic, and specialized AI companies such as PathAI, ConcertAI, and Azra AI. These players are constantly innovating and investing in research and development to maintain their market position. The strategic partnerships and acquisitions within the sector further highlight the market's dynamism and potential. The future of AI in oncology appears bright, with continued advancements promising to transform cancer care, resulting in earlier diagnoses, more effective treatments, and improved patient outcomes. The consistent high CAGR signifies a lucrative and rapidly evolving market attracting substantial investment and innovation.
AI in Oncology Market Company Market Share
AI in Oncology Market: A Comprehensive Report (2019-2033)
This comprehensive report provides an in-depth analysis of the AI in Oncology market, encompassing its current state, future trajectory, and key players. With a detailed segmentation by component (Software Solutions, Hardware, Services), cancer type (Breast Cancer, Lung Cancer, Prostate Cancer, Colorectal Cancer, Brain Tumor, Other Cancer Types), treatment type (Chemotherapy, Radiotherapy, Immunotherapy, Other Treatment Types), and application (Cancer Detection, Drug Discovery, Drug Development, Other Applications), this report offers invaluable insights for industry professionals, investors, and researchers. The study period covers 2019-2033, with 2025 as the base year and a forecast period of 2025-2033. The market size is presented in million units.
AI in Oncology Market Market Dynamics & Structure
The AI in Oncology market is characterized by moderate concentration, with a few major players dominating alongside numerous smaller, specialized companies. Technological innovation, particularly in deep learning and computer vision, is a key driver, pushing the boundaries of cancer detection, diagnosis, and treatment. Stringent regulatory frameworks, particularly concerning data privacy and algorithm validation, pose both challenges and opportunities. Competitive substitutes, such as traditional diagnostic methods, are gradually being replaced as AI demonstrates superior accuracy and efficiency. The end-user demographic encompasses hospitals, research institutions, pharmaceutical companies, and diagnostic centers globally. Mergers and acquisitions (M&A) activity is significant, reflecting the market's consolidation and the pursuit of technological synergy.
- Market Concentration: Moderately concentrated, with the top 5 players holding approximately xx% market share in 2025.
- Technological Innovation: Deep learning, computer vision, and natural language processing are driving advancements.
- Regulatory Landscape: Stringent regulations regarding data privacy and algorithm validation impact market growth.
- Competitive Substitutes: Traditional diagnostic methods face increasing competition from AI-powered solutions.
- M&A Activity: xx M&A deals were recorded in the historical period (2019-2024), indicating a consolidated market trend. This number is predicted to increase to xx in the forecast period.
- Innovation Barriers: High development costs, data scarcity, and ethical concerns hinder innovation.
AI in Oncology Market Growth Trends & Insights
The AI in Oncology market experienced robust growth during the historical period (2019-2024), expanding from xx million units in 2019 to xx million units in 2024, exhibiting a CAGR of xx%. This growth is driven by increasing prevalence of cancer globally, rising demand for precise diagnostics, and advancements in AI technologies. Adoption rates are particularly high in developed countries with robust healthcare infrastructure. Technological disruptions, such as the introduction of edge AI and explainable AI (XAI), are further accelerating market expansion. Shifting consumer behavior towards personalized medicine and proactive healthcare fuels the demand for AI-driven solutions. The market is expected to continue its upward trajectory during the forecast period (2025-2033), projected to reach xx million units by 2033, at a CAGR of xx%. Market penetration is expected to reach xx% by 2033.
Dominant Regions, Countries, or Segments in AI in Oncology Market
North America currently dominates the AI in Oncology market, driven by high healthcare expenditure, advanced technological infrastructure, and early adoption of AI-based solutions. Europe follows as a significant market, while Asia-Pacific shows promising growth potential due to rising healthcare investments and increasing cancer prevalence. Among segments, Software Solutions holds the largest market share, driven by the growing demand for advanced analytical tools and predictive modeling. Breast Cancer and Lung Cancer are the leading cancer types driving AI adoption, owing to their high prevalence and potential for improved treatment outcomes. Chemotherapy and Immunotherapy are dominant treatment types, reflecting the increasing use of AI in drug discovery and personalized treatment planning.
- North America: High healthcare spending, advanced technological infrastructure, and early adoption of AI-based solutions.
- Europe: Significant market driven by robust healthcare systems and strong research capabilities.
- Asia-Pacific: High growth potential driven by increasing healthcare investments and rising cancer prevalence.
- Software Solutions: Largest market share due to demand for advanced analytical tools and predictive modeling.
- Breast Cancer & Lung Cancer: Leading cancer types driving AI adoption due to high prevalence and treatment potential.
- Chemotherapy & Immunotherapy: Dominant treatment types leveraging AI for drug discovery and personalized treatment.
AI in Oncology Market Product Landscape
The AI in Oncology market showcases diverse product offerings, ranging from sophisticated software platforms for image analysis and genomic profiling to specialized hardware for high-throughput data processing. These products offer unique selling propositions, such as enhanced accuracy, faster processing times, and improved diagnostic capabilities. Technological advancements such as deep learning algorithms and cloud-based solutions further enhance the performance and accessibility of these tools. Continuous innovation in areas like AI-powered pathology, radiomics, and liquid biopsy analysis is driving market expansion.
Key Drivers, Barriers & Challenges in AI in Oncology Market
Key Drivers:
- Increasing cancer prevalence and mortality rates globally.
- Growing demand for accurate and timely cancer diagnosis and treatment.
- Advancements in AI technologies, particularly deep learning and machine learning.
- Increased investments in healthcare R&D and adoption of precision medicine.
Key Challenges & Restraints:
- High development and implementation costs of AI solutions.
- Regulatory hurdles related to data privacy and algorithm validation.
- Data scarcity and quality issues limiting the effectiveness of AI models.
- Concerns regarding algorithmic bias and ethical implications.
- Lack of skilled professionals to develop, implement, and maintain AI systems.
Emerging Opportunities in AI in Oncology Market
- Expanding application of AI in early cancer detection, enabling proactive intervention.
- Development of AI-powered personalized treatment plans based on individual patient profiles.
- Growing use of AI in clinical trials to accelerate drug discovery and development.
- Emerging markets in developing countries with high cancer prevalence offer significant growth potential.
Growth Accelerators in the AI in Oncology Market Industry
Technological breakthroughs, such as the development of more sophisticated and robust algorithms and improved computational power, are key growth accelerators. Strategic partnerships between technology companies, healthcare providers, and research institutions will also drive market expansion. This collaboration fosters the development of effective and clinically relevant AI solutions. Market expansion into untapped regions and focus on improving healthcare access in underserved communities represent significant growth opportunities.
Key Players Shaping the AI in Oncology Market Market
- IBM Corporation
- Digital Diagnostics Inc
- PathAI
- Medtronic
- NVIDIA Corporation
- GE Healthcare
- Siemens Healthineers AG
- Azra AI
- Median Technologies Inc
- Intel Corporation
- ConcertAI LLC
Notable Milestones in AI in Oncology Market Sector
- September 2021: Owkin, Inc., in collaboration with Cleveland Clinic researchers, announced the development of a deep-learning model predicting survival and health outcomes for hepatocellular carcinoma. This highlights the progress in leveraging AI for prognosis.
- August 2022: Medtronic plc launched a GI Genius™ intelligent endoscopy module in India, assisting in colorectal cancer detection. This demonstrates the expansion of AI-powered diagnostic tools into emerging markets.
In-Depth AI in Oncology Market Market Outlook
The AI in Oncology market is poised for significant growth in the coming years, driven by continued technological innovation, increasing investment, and rising demand for effective cancer care solutions. Strategic partnerships and collaborations between key players will play a critical role in accelerating market expansion. The focus on personalized medicine and improved patient outcomes presents significant opportunities for companies developing and deploying AI-based solutions in oncology. This market is primed for substantial growth, presenting lucrative prospects for innovative players and strategic investors.
AI in Oncology Market Segmentation
-
1. Component
- 1.1. Software Solutions
- 1.2. Hardware
- 1.3. Services
-
2. Cancer Type
- 2.1. Breast Cancer
- 2.2. Lung Cancer
- 2.3. Prostate Cancer
- 2.4. Colorectal Cancer
- 2.5. Brain Tumor
- 2.6. Other Cancer Types
-
3. Treatment Type
- 3.1. Chemotherapy
- 3.2. Radiotherapy
- 3.3. Immunotherapy
- 3.4. Other Treatment Types
-
4. Application
- 4.1. Cancer Detection
- 4.2. Drug Discovery
- 4.3. Drug Development
- 4.4. Other Applications
AI in Oncology Market Segmentation By Geography
-
1. North America
- 1.1. United States
- 1.2. Canada
- 1.3. Mexico
-
2. Europe
- 2.1. Germany
- 2.2. United Kingdom
- 2.3. France
- 2.4. Italy
- 2.5. Spain
- 2.6. Rest of Europe
-
3. Asia Pacific
- 3.1. China
- 3.2. Japan
- 3.3. India
- 3.4. Australia
- 3.5. South Korea
- 3.6. Rest of Asia Pacific
-
4. Middle East and Africa
- 4.1. GCC
- 4.2. South Africa
- 4.3. Rest of Middle East and Africa
-
5. South America
- 5.1. Brazil
- 5.2. Argentina
- 5.3. Rest of South America
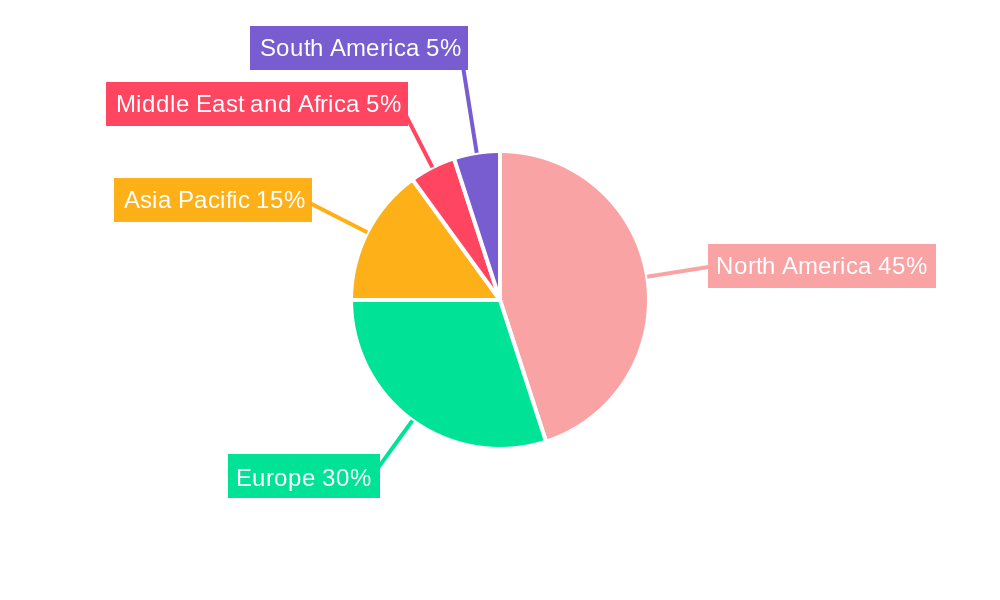
AI in Oncology Market Regional Market Share
Geographic Coverage of AI in Oncology Market
AI in Oncology Market REPORT HIGHLIGHTS
| Aspects | Details |
|---|---|
| Study Period | 2020-2034 |
| Base Year | 2025 |
| Estimated Year | 2026 |
| Forecast Period | 2026-2034 |
| Historical Period | 2020-2025 |
| Growth Rate | CAGR of 35.51% from 2020-2034 |
| Segmentation |
|
Table of Contents
- 1. Introduction
- 1.1. Research Scope
- 1.2. Market Segmentation
- 1.3. Research Objective
- 1.4. Definitions and Assumptions
- 2. Executive Summary
- 2.1. Market Snapshot
- 3. Market Dynamics
- 3.1. Market Drivers
- 3.2. Market Restrains
- 3.3. Market Trends
- 3.4. Market Opportunities
- 4. Market Factor Analysis
- 4.1. Porters Five Forces
- 4.1.1. Bargaining Power of Suppliers
- 4.1.2. Bargaining Power of Buyers
- 4.1.3. Threat of New Entrants
- 4.1.4. Threat of Substitutes
- 4.1.5. Competitive Rivalry
- 4.2. PESTEL analysis
- 4.3. BCG Analysis
- 4.3.1. Stars (High Growth, High Market Share)
- 4.3.2. Cash Cows (Low Growth, High Market Share)
- 4.3.3. Question Mark (High Growth, Low Market Share)
- 4.3.4. Dogs (Low Growth, Low Market Share)
- 4.4. Ansoff Matrix Analysis
- 4.5. Supply Chain Analysis
- 4.6. Regulatory Landscape
- 4.7. Current Market Potential and Opportunity Assessment (TAM–SAM–SOM Framework)
- 4.8. VDR Analyst Note
- 4.1. Porters Five Forces
- 5. Market Analysis, Insights and Forecast 2021-2033
- 5.1. Market Analysis, Insights and Forecast - by Component
- 5.1.1. Software Solutions
- 5.1.2. Hardware
- 5.1.3. Services
- 5.2. Market Analysis, Insights and Forecast - by Cancer Type
- 5.2.1. Breast Cancer
- 5.2.2. Lung Cancer
- 5.2.3. Prostate Cancer
- 5.2.4. Colorectal Cancer
- 5.2.5. Brain Tumor
- 5.2.6. Other Cancer Types
- 5.3. Market Analysis, Insights and Forecast - by Treatment Type
- 5.3.1. Chemotherapy
- 5.3.2. Radiotherapy
- 5.3.3. Immunotherapy
- 5.3.4. Other Treatment Types
- 5.4. Market Analysis, Insights and Forecast - by Application
- 5.4.1. Cancer Detection
- 5.4.2. Drug Discovery
- 5.4.3. Drug Development
- 5.4.4. Other Applications
- 5.5. Market Analysis, Insights and Forecast - by Region
- 5.5.1. North America
- 5.5.2. Europe
- 5.5.3. Asia Pacific
- 5.5.4. Middle East and Africa
- 5.5.5. South America
- 5.1. Market Analysis, Insights and Forecast - by Component
- 6. Global AI in Oncology Market Analysis, Insights and Forecast, 2021-2033
- 6.1. Market Analysis, Insights and Forecast - by Component
- 6.1.1. Software Solutions
- 6.1.2. Hardware
- 6.1.3. Services
- 6.2. Market Analysis, Insights and Forecast - by Cancer Type
- 6.2.1. Breast Cancer
- 6.2.2. Lung Cancer
- 6.2.3. Prostate Cancer
- 6.2.4. Colorectal Cancer
- 6.2.5. Brain Tumor
- 6.2.6. Other Cancer Types
- 6.3. Market Analysis, Insights and Forecast - by Treatment Type
- 6.3.1. Chemotherapy
- 6.3.2. Radiotherapy
- 6.3.3. Immunotherapy
- 6.3.4. Other Treatment Types
- 6.4. Market Analysis, Insights and Forecast - by Application
- 6.4.1. Cancer Detection
- 6.4.2. Drug Discovery
- 6.4.3. Drug Development
- 6.4.4. Other Applications
- 6.1. Market Analysis, Insights and Forecast - by Component
- 7. North America AI in Oncology Market Analysis, Insights and Forecast, 2021-2033
- 7.1. Market Analysis, Insights and Forecast - by Component
- 7.1.1. Software Solutions
- 7.1.2. Hardware
- 7.1.3. Services
- 7.2. Market Analysis, Insights and Forecast - by Cancer Type
- 7.2.1. Breast Cancer
- 7.2.2. Lung Cancer
- 7.2.3. Prostate Cancer
- 7.2.4. Colorectal Cancer
- 7.2.5. Brain Tumor
- 7.2.6. Other Cancer Types
- 7.3. Market Analysis, Insights and Forecast - by Treatment Type
- 7.3.1. Chemotherapy
- 7.3.2. Radiotherapy
- 7.3.3. Immunotherapy
- 7.3.4. Other Treatment Types
- 7.4. Market Analysis, Insights and Forecast - by Application
- 7.4.1. Cancer Detection
- 7.4.2. Drug Discovery
- 7.4.3. Drug Development
- 7.4.4. Other Applications
- 7.1. Market Analysis, Insights and Forecast - by Component
- 8. Europe AI in Oncology Market Analysis, Insights and Forecast, 2021-2033
- 8.1. Market Analysis, Insights and Forecast - by Component
- 8.1.1. Software Solutions
- 8.1.2. Hardware
- 8.1.3. Services
- 8.2. Market Analysis, Insights and Forecast - by Cancer Type
- 8.2.1. Breast Cancer
- 8.2.2. Lung Cancer
- 8.2.3. Prostate Cancer
- 8.2.4. Colorectal Cancer
- 8.2.5. Brain Tumor
- 8.2.6. Other Cancer Types
- 8.3. Market Analysis, Insights and Forecast - by Treatment Type
- 8.3.1. Chemotherapy
- 8.3.2. Radiotherapy
- 8.3.3. Immunotherapy
- 8.3.4. Other Treatment Types
- 8.4. Market Analysis, Insights and Forecast - by Application
- 8.4.1. Cancer Detection
- 8.4.2. Drug Discovery
- 8.4.3. Drug Development
- 8.4.4. Other Applications
- 8.1. Market Analysis, Insights and Forecast - by Component
- 9. Asia Pacific AI in Oncology Market Analysis, Insights and Forecast, 2021-2033
- 9.1. Market Analysis, Insights and Forecast - by Component
- 9.1.1. Software Solutions
- 9.1.2. Hardware
- 9.1.3. Services
- 9.2. Market Analysis, Insights and Forecast - by Cancer Type
- 9.2.1. Breast Cancer
- 9.2.2. Lung Cancer
- 9.2.3. Prostate Cancer
- 9.2.4. Colorectal Cancer
- 9.2.5. Brain Tumor
- 9.2.6. Other Cancer Types
- 9.3. Market Analysis, Insights and Forecast - by Treatment Type
- 9.3.1. Chemotherapy
- 9.3.2. Radiotherapy
- 9.3.3. Immunotherapy
- 9.3.4. Other Treatment Types
- 9.4. Market Analysis, Insights and Forecast - by Application
- 9.4.1. Cancer Detection
- 9.4.2. Drug Discovery
- 9.4.3. Drug Development
- 9.4.4. Other Applications
- 9.1. Market Analysis, Insights and Forecast - by Component
- 10. Middle East and Africa AI in Oncology Market Analysis, Insights and Forecast, 2021-2033
- 10.1. Market Analysis, Insights and Forecast - by Component
- 10.1.1. Software Solutions
- 10.1.2. Hardware
- 10.1.3. Services
- 10.2. Market Analysis, Insights and Forecast - by Cancer Type
- 10.2.1. Breast Cancer
- 10.2.2. Lung Cancer
- 10.2.3. Prostate Cancer
- 10.2.4. Colorectal Cancer
- 10.2.5. Brain Tumor
- 10.2.6. Other Cancer Types
- 10.3. Market Analysis, Insights and Forecast - by Treatment Type
- 10.3.1. Chemotherapy
- 10.3.2. Radiotherapy
- 10.3.3. Immunotherapy
- 10.3.4. Other Treatment Types
- 10.4. Market Analysis, Insights and Forecast - by Application
- 10.4.1. Cancer Detection
- 10.4.2. Drug Discovery
- 10.4.3. Drug Development
- 10.4.4. Other Applications
- 10.1. Market Analysis, Insights and Forecast - by Component
- 11. South America AI in Oncology Market Analysis, Insights and Forecast, 2021-2033
- 11.1. Market Analysis, Insights and Forecast - by Component
- 11.1.1. Software Solutions
- 11.1.2. Hardware
- 11.1.3. Services
- 11.2. Market Analysis, Insights and Forecast - by Cancer Type
- 11.2.1. Breast Cancer
- 11.2.2. Lung Cancer
- 11.2.3. Prostate Cancer
- 11.2.4. Colorectal Cancer
- 11.2.5. Brain Tumor
- 11.2.6. Other Cancer Types
- 11.3. Market Analysis, Insights and Forecast - by Treatment Type
- 11.3.1. Chemotherapy
- 11.3.2. Radiotherapy
- 11.3.3. Immunotherapy
- 11.3.4. Other Treatment Types
- 11.4. Market Analysis, Insights and Forecast - by Application
- 11.4.1. Cancer Detection
- 11.4.2. Drug Discovery
- 11.4.3. Drug Development
- 11.4.4. Other Applications
- 11.1. Market Analysis, Insights and Forecast - by Component
- 12. Competitive Analysis
- 12.1. Company Profiles
- 12.1.1 IBM Corporation
- 12.1.1.1. Company Overview
- 12.1.1.2. Products
- 12.1.1.3. Company Financials
- 12.1.1.4. SWOT Analysis
- 12.1.2 Digital Diagnostics Inc
- 12.1.2.1. Company Overview
- 12.1.2.2. Products
- 12.1.2.3. Company Financials
- 12.1.2.4. SWOT Analysis
- 12.1.3 PathAI
- 12.1.3.1. Company Overview
- 12.1.3.2. Products
- 12.1.3.3. Company Financials
- 12.1.3.4. SWOT Analysis
- 12.1.4 Medtronic
- 12.1.4.1. Company Overview
- 12.1.4.2. Products
- 12.1.4.3. Company Financials
- 12.1.4.4. SWOT Analysis
- 12.1.5 NVIDIA Corporation
- 12.1.5.1. Company Overview
- 12.1.5.2. Products
- 12.1.5.3. Company Financials
- 12.1.5.4. SWOT Analysis
- 12.1.6 GE Healthcare
- 12.1.6.1. Company Overview
- 12.1.6.2. Products
- 12.1.6.3. Company Financials
- 12.1.6.4. SWOT Analysis
- 12.1.7 Siemens Healthineers AG
- 12.1.7.1. Company Overview
- 12.1.7.2. Products
- 12.1.7.3. Company Financials
- 12.1.7.4. SWOT Analysis
- 12.1.8 Azra AI
- 12.1.8.1. Company Overview
- 12.1.8.2. Products
- 12.1.8.3. Company Financials
- 12.1.8.4. SWOT Analysis
- 12.1.9 Median Technologies Inc
- 12.1.9.1. Company Overview
- 12.1.9.2. Products
- 12.1.9.3. Company Financials
- 12.1.9.4. SWOT Analysis
- 12.1.10 Intel Corporation
- 12.1.10.1. Company Overview
- 12.1.10.2. Products
- 12.1.10.3. Company Financials
- 12.1.10.4. SWOT Analysis
- 12.1.11 ConcertAI LLC
- 12.1.11.1. Company Overview
- 12.1.11.2. Products
- 12.1.11.3. Company Financials
- 12.1.11.4. SWOT Analysis
- 12.1.1 IBM Corporation
- 12.2. Market Entropy
- 12.2.1 Company's Key Areas Served
- 12.2.2 Recent Developments
- 12.3. Company Market Share Analysis 2025
- 12.3.1 Top 5 Companies Market Share Analysis
- 12.3.2 Top 3 Companies Market Share Analysis
- 12.4. List of Potential Customers
- 13. Research Methodology
List of Figures
- Figure 1: Global AI in Oncology Market Revenue Breakdown (Million, %) by Region 2025 & 2033
- Figure 2: Global AI in Oncology Market Volume Breakdown (K Unit, %) by Region 2025 & 2033
- Figure 3: North America AI in Oncology Market Revenue (Million), by Component 2025 & 2033
- Figure 4: North America AI in Oncology Market Volume (K Unit), by Component 2025 & 2033
- Figure 5: North America AI in Oncology Market Revenue Share (%), by Component 2025 & 2033
- Figure 6: North America AI in Oncology Market Volume Share (%), by Component 2025 & 2033
- Figure 7: North America AI in Oncology Market Revenue (Million), by Cancer Type 2025 & 2033
- Figure 8: North America AI in Oncology Market Volume (K Unit), by Cancer Type 2025 & 2033
- Figure 9: North America AI in Oncology Market Revenue Share (%), by Cancer Type 2025 & 2033
- Figure 10: North America AI in Oncology Market Volume Share (%), by Cancer Type 2025 & 2033
- Figure 11: North America AI in Oncology Market Revenue (Million), by Treatment Type 2025 & 2033
- Figure 12: North America AI in Oncology Market Volume (K Unit), by Treatment Type 2025 & 2033
- Figure 13: North America AI in Oncology Market Revenue Share (%), by Treatment Type 2025 & 2033
- Figure 14: North America AI in Oncology Market Volume Share (%), by Treatment Type 2025 & 2033
- Figure 15: North America AI in Oncology Market Revenue (Million), by Application 2025 & 2033
- Figure 16: North America AI in Oncology Market Volume (K Unit), by Application 2025 & 2033
- Figure 17: North America AI in Oncology Market Revenue Share (%), by Application 2025 & 2033
- Figure 18: North America AI in Oncology Market Volume Share (%), by Application 2025 & 2033
- Figure 19: North America AI in Oncology Market Revenue (Million), by Country 2025 & 2033
- Figure 20: North America AI in Oncology Market Volume (K Unit), by Country 2025 & 2033
- Figure 21: North America AI in Oncology Market Revenue Share (%), by Country 2025 & 2033
- Figure 22: North America AI in Oncology Market Volume Share (%), by Country 2025 & 2033
- Figure 23: Europe AI in Oncology Market Revenue (Million), by Component 2025 & 2033
- Figure 24: Europe AI in Oncology Market Volume (K Unit), by Component 2025 & 2033
- Figure 25: Europe AI in Oncology Market Revenue Share (%), by Component 2025 & 2033
- Figure 26: Europe AI in Oncology Market Volume Share (%), by Component 2025 & 2033
- Figure 27: Europe AI in Oncology Market Revenue (Million), by Cancer Type 2025 & 2033
- Figure 28: Europe AI in Oncology Market Volume (K Unit), by Cancer Type 2025 & 2033
- Figure 29: Europe AI in Oncology Market Revenue Share (%), by Cancer Type 2025 & 2033
- Figure 30: Europe AI in Oncology Market Volume Share (%), by Cancer Type 2025 & 2033
- Figure 31: Europe AI in Oncology Market Revenue (Million), by Treatment Type 2025 & 2033
- Figure 32: Europe AI in Oncology Market Volume (K Unit), by Treatment Type 2025 & 2033
- Figure 33: Europe AI in Oncology Market Revenue Share (%), by Treatment Type 2025 & 2033
- Figure 34: Europe AI in Oncology Market Volume Share (%), by Treatment Type 2025 & 2033
- Figure 35: Europe AI in Oncology Market Revenue (Million), by Application 2025 & 2033
- Figure 36: Europe AI in Oncology Market Volume (K Unit), by Application 2025 & 2033
- Figure 37: Europe AI in Oncology Market Revenue Share (%), by Application 2025 & 2033
- Figure 38: Europe AI in Oncology Market Volume Share (%), by Application 2025 & 2033
- Figure 39: Europe AI in Oncology Market Revenue (Million), by Country 2025 & 2033
- Figure 40: Europe AI in Oncology Market Volume (K Unit), by Country 2025 & 2033
- Figure 41: Europe AI in Oncology Market Revenue Share (%), by Country 2025 & 2033
- Figure 42: Europe AI in Oncology Market Volume Share (%), by Country 2025 & 2033
- Figure 43: Asia Pacific AI in Oncology Market Revenue (Million), by Component 2025 & 2033
- Figure 44: Asia Pacific AI in Oncology Market Volume (K Unit), by Component 2025 & 2033
- Figure 45: Asia Pacific AI in Oncology Market Revenue Share (%), by Component 2025 & 2033
- Figure 46: Asia Pacific AI in Oncology Market Volume Share (%), by Component 2025 & 2033
- Figure 47: Asia Pacific AI in Oncology Market Revenue (Million), by Cancer Type 2025 & 2033
- Figure 48: Asia Pacific AI in Oncology Market Volume (K Unit), by Cancer Type 2025 & 2033
- Figure 49: Asia Pacific AI in Oncology Market Revenue Share (%), by Cancer Type 2025 & 2033
- Figure 50: Asia Pacific AI in Oncology Market Volume Share (%), by Cancer Type 2025 & 2033
- Figure 51: Asia Pacific AI in Oncology Market Revenue (Million), by Treatment Type 2025 & 2033
- Figure 52: Asia Pacific AI in Oncology Market Volume (K Unit), by Treatment Type 2025 & 2033
- Figure 53: Asia Pacific AI in Oncology Market Revenue Share (%), by Treatment Type 2025 & 2033
- Figure 54: Asia Pacific AI in Oncology Market Volume Share (%), by Treatment Type 2025 & 2033
- Figure 55: Asia Pacific AI in Oncology Market Revenue (Million), by Application 2025 & 2033
- Figure 56: Asia Pacific AI in Oncology Market Volume (K Unit), by Application 2025 & 2033
- Figure 57: Asia Pacific AI in Oncology Market Revenue Share (%), by Application 2025 & 2033
- Figure 58: Asia Pacific AI in Oncology Market Volume Share (%), by Application 2025 & 2033
- Figure 59: Asia Pacific AI in Oncology Market Revenue (Million), by Country 2025 & 2033
- Figure 60: Asia Pacific AI in Oncology Market Volume (K Unit), by Country 2025 & 2033
- Figure 61: Asia Pacific AI in Oncology Market Revenue Share (%), by Country 2025 & 2033
- Figure 62: Asia Pacific AI in Oncology Market Volume Share (%), by Country 2025 & 2033
- Figure 63: Middle East and Africa AI in Oncology Market Revenue (Million), by Component 2025 & 2033
- Figure 64: Middle East and Africa AI in Oncology Market Volume (K Unit), by Component 2025 & 2033
- Figure 65: Middle East and Africa AI in Oncology Market Revenue Share (%), by Component 2025 & 2033
- Figure 66: Middle East and Africa AI in Oncology Market Volume Share (%), by Component 2025 & 2033
- Figure 67: Middle East and Africa AI in Oncology Market Revenue (Million), by Cancer Type 2025 & 2033
- Figure 68: Middle East and Africa AI in Oncology Market Volume (K Unit), by Cancer Type 2025 & 2033
- Figure 69: Middle East and Africa AI in Oncology Market Revenue Share (%), by Cancer Type 2025 & 2033
- Figure 70: Middle East and Africa AI in Oncology Market Volume Share (%), by Cancer Type 2025 & 2033
- Figure 71: Middle East and Africa AI in Oncology Market Revenue (Million), by Treatment Type 2025 & 2033
- Figure 72: Middle East and Africa AI in Oncology Market Volume (K Unit), by Treatment Type 2025 & 2033
- Figure 73: Middle East and Africa AI in Oncology Market Revenue Share (%), by Treatment Type 2025 & 2033
- Figure 74: Middle East and Africa AI in Oncology Market Volume Share (%), by Treatment Type 2025 & 2033
- Figure 75: Middle East and Africa AI in Oncology Market Revenue (Million), by Application 2025 & 2033
- Figure 76: Middle East and Africa AI in Oncology Market Volume (K Unit), by Application 2025 & 2033
- Figure 77: Middle East and Africa AI in Oncology Market Revenue Share (%), by Application 2025 & 2033
- Figure 78: Middle East and Africa AI in Oncology Market Volume Share (%), by Application 2025 & 2033
- Figure 79: Middle East and Africa AI in Oncology Market Revenue (Million), by Country 2025 & 2033
- Figure 80: Middle East and Africa AI in Oncology Market Volume (K Unit), by Country 2025 & 2033
- Figure 81: Middle East and Africa AI in Oncology Market Revenue Share (%), by Country 2025 & 2033
- Figure 82: Middle East and Africa AI in Oncology Market Volume Share (%), by Country 2025 & 2033
- Figure 83: South America AI in Oncology Market Revenue (Million), by Component 2025 & 2033
- Figure 84: South America AI in Oncology Market Volume (K Unit), by Component 2025 & 2033
- Figure 85: South America AI in Oncology Market Revenue Share (%), by Component 2025 & 2033
- Figure 86: South America AI in Oncology Market Volume Share (%), by Component 2025 & 2033
- Figure 87: South America AI in Oncology Market Revenue (Million), by Cancer Type 2025 & 2033
- Figure 88: South America AI in Oncology Market Volume (K Unit), by Cancer Type 2025 & 2033
- Figure 89: South America AI in Oncology Market Revenue Share (%), by Cancer Type 2025 & 2033
- Figure 90: South America AI in Oncology Market Volume Share (%), by Cancer Type 2025 & 2033
- Figure 91: South America AI in Oncology Market Revenue (Million), by Treatment Type 2025 & 2033
- Figure 92: South America AI in Oncology Market Volume (K Unit), by Treatment Type 2025 & 2033
- Figure 93: South America AI in Oncology Market Revenue Share (%), by Treatment Type 2025 & 2033
- Figure 94: South America AI in Oncology Market Volume Share (%), by Treatment Type 2025 & 2033
- Figure 95: South America AI in Oncology Market Revenue (Million), by Application 2025 & 2033
- Figure 96: South America AI in Oncology Market Volume (K Unit), by Application 2025 & 2033
- Figure 97: South America AI in Oncology Market Revenue Share (%), by Application 2025 & 2033
- Figure 98: South America AI in Oncology Market Volume Share (%), by Application 2025 & 2033
- Figure 99: South America AI in Oncology Market Revenue (Million), by Country 2025 & 2033
- Figure 100: South America AI in Oncology Market Volume (K Unit), by Country 2025 & 2033
- Figure 101: South America AI in Oncology Market Revenue Share (%), by Country 2025 & 2033
- Figure 102: South America AI in Oncology Market Volume Share (%), by Country 2025 & 2033
List of Tables
- Table 1: Global AI in Oncology Market Revenue Million Forecast, by Component 2020 & 2033
- Table 2: Global AI in Oncology Market Volume K Unit Forecast, by Component 2020 & 2033
- Table 3: Global AI in Oncology Market Revenue Million Forecast, by Cancer Type 2020 & 2033
- Table 4: Global AI in Oncology Market Volume K Unit Forecast, by Cancer Type 2020 & 2033
- Table 5: Global AI in Oncology Market Revenue Million Forecast, by Treatment Type 2020 & 2033
- Table 6: Global AI in Oncology Market Volume K Unit Forecast, by Treatment Type 2020 & 2033
- Table 7: Global AI in Oncology Market Revenue Million Forecast, by Application 2020 & 2033
- Table 8: Global AI in Oncology Market Volume K Unit Forecast, by Application 2020 & 2033
- Table 9: Global AI in Oncology Market Revenue Million Forecast, by Region 2020 & 2033
- Table 10: Global AI in Oncology Market Volume K Unit Forecast, by Region 2020 & 2033
- Table 11: Global AI in Oncology Market Revenue Million Forecast, by Component 2020 & 2033
- Table 12: Global AI in Oncology Market Volume K Unit Forecast, by Component 2020 & 2033
- Table 13: Global AI in Oncology Market Revenue Million Forecast, by Cancer Type 2020 & 2033
- Table 14: Global AI in Oncology Market Volume K Unit Forecast, by Cancer Type 2020 & 2033
- Table 15: Global AI in Oncology Market Revenue Million Forecast, by Treatment Type 2020 & 2033
- Table 16: Global AI in Oncology Market Volume K Unit Forecast, by Treatment Type 2020 & 2033
- Table 17: Global AI in Oncology Market Revenue Million Forecast, by Application 2020 & 2033
- Table 18: Global AI in Oncology Market Volume K Unit Forecast, by Application 2020 & 2033
- Table 19: Global AI in Oncology Market Revenue Million Forecast, by Country 2020 & 2033
- Table 20: Global AI in Oncology Market Volume K Unit Forecast, by Country 2020 & 2033
- Table 21: United States AI in Oncology Market Revenue (Million) Forecast, by Application 2020 & 2033
- Table 22: United States AI in Oncology Market Volume (K Unit) Forecast, by Application 2020 & 2033
- Table 23: Canada AI in Oncology Market Revenue (Million) Forecast, by Application 2020 & 2033
- Table 24: Canada AI in Oncology Market Volume (K Unit) Forecast, by Application 2020 & 2033
- Table 25: Mexico AI in Oncology Market Revenue (Million) Forecast, by Application 2020 & 2033
- Table 26: Mexico AI in Oncology Market Volume (K Unit) Forecast, by Application 2020 & 2033
- Table 27: Global AI in Oncology Market Revenue Million Forecast, by Component 2020 & 2033
- Table 28: Global AI in Oncology Market Volume K Unit Forecast, by Component 2020 & 2033
- Table 29: Global AI in Oncology Market Revenue Million Forecast, by Cancer Type 2020 & 2033
- Table 30: Global AI in Oncology Market Volume K Unit Forecast, by Cancer Type 2020 & 2033
- Table 31: Global AI in Oncology Market Revenue Million Forecast, by Treatment Type 2020 & 2033
- Table 32: Global AI in Oncology Market Volume K Unit Forecast, by Treatment Type 2020 & 2033
- Table 33: Global AI in Oncology Market Revenue Million Forecast, by Application 2020 & 2033
- Table 34: Global AI in Oncology Market Volume K Unit Forecast, by Application 2020 & 2033
- Table 35: Global AI in Oncology Market Revenue Million Forecast, by Country 2020 & 2033
- Table 36: Global AI in Oncology Market Volume K Unit Forecast, by Country 2020 & 2033
- Table 37: Germany AI in Oncology Market Revenue (Million) Forecast, by Application 2020 & 2033
- Table 38: Germany AI in Oncology Market Volume (K Unit) Forecast, by Application 2020 & 2033
- Table 39: United Kingdom AI in Oncology Market Revenue (Million) Forecast, by Application 2020 & 2033
- Table 40: United Kingdom AI in Oncology Market Volume (K Unit) Forecast, by Application 2020 & 2033
- Table 41: France AI in Oncology Market Revenue (Million) Forecast, by Application 2020 & 2033
- Table 42: France AI in Oncology Market Volume (K Unit) Forecast, by Application 2020 & 2033
- Table 43: Italy AI in Oncology Market Revenue (Million) Forecast, by Application 2020 & 2033
- Table 44: Italy AI in Oncology Market Volume (K Unit) Forecast, by Application 2020 & 2033
- Table 45: Spain AI in Oncology Market Revenue (Million) Forecast, by Application 2020 & 2033
- Table 46: Spain AI in Oncology Market Volume (K Unit) Forecast, by Application 2020 & 2033
- Table 47: Rest of Europe AI in Oncology Market Revenue (Million) Forecast, by Application 2020 & 2033
- Table 48: Rest of Europe AI in Oncology Market Volume (K Unit) Forecast, by Application 2020 & 2033
- Table 49: Global AI in Oncology Market Revenue Million Forecast, by Component 2020 & 2033
- Table 50: Global AI in Oncology Market Volume K Unit Forecast, by Component 2020 & 2033
- Table 51: Global AI in Oncology Market Revenue Million Forecast, by Cancer Type 2020 & 2033
- Table 52: Global AI in Oncology Market Volume K Unit Forecast, by Cancer Type 2020 & 2033
- Table 53: Global AI in Oncology Market Revenue Million Forecast, by Treatment Type 2020 & 2033
- Table 54: Global AI in Oncology Market Volume K Unit Forecast, by Treatment Type 2020 & 2033
- Table 55: Global AI in Oncology Market Revenue Million Forecast, by Application 2020 & 2033
- Table 56: Global AI in Oncology Market Volume K Unit Forecast, by Application 2020 & 2033
- Table 57: Global AI in Oncology Market Revenue Million Forecast, by Country 2020 & 2033
- Table 58: Global AI in Oncology Market Volume K Unit Forecast, by Country 2020 & 2033
- Table 59: China AI in Oncology Market Revenue (Million) Forecast, by Application 2020 & 2033
- Table 60: China AI in Oncology Market Volume (K Unit) Forecast, by Application 2020 & 2033
- Table 61: Japan AI in Oncology Market Revenue (Million) Forecast, by Application 2020 & 2033
- Table 62: Japan AI in Oncology Market Volume (K Unit) Forecast, by Application 2020 & 2033
- Table 63: India AI in Oncology Market Revenue (Million) Forecast, by Application 2020 & 2033
- Table 64: India AI in Oncology Market Volume (K Unit) Forecast, by Application 2020 & 2033
- Table 65: Australia AI in Oncology Market Revenue (Million) Forecast, by Application 2020 & 2033
- Table 66: Australia AI in Oncology Market Volume (K Unit) Forecast, by Application 2020 & 2033
- Table 67: South Korea AI in Oncology Market Revenue (Million) Forecast, by Application 2020 & 2033
- Table 68: South Korea AI in Oncology Market Volume (K Unit) Forecast, by Application 2020 & 2033
- Table 69: Rest of Asia Pacific AI in Oncology Market Revenue (Million) Forecast, by Application 2020 & 2033
- Table 70: Rest of Asia Pacific AI in Oncology Market Volume (K Unit) Forecast, by Application 2020 & 2033
- Table 71: Global AI in Oncology Market Revenue Million Forecast, by Component 2020 & 2033
- Table 72: Global AI in Oncology Market Volume K Unit Forecast, by Component 2020 & 2033
- Table 73: Global AI in Oncology Market Revenue Million Forecast, by Cancer Type 2020 & 2033
- Table 74: Global AI in Oncology Market Volume K Unit Forecast, by Cancer Type 2020 & 2033
- Table 75: Global AI in Oncology Market Revenue Million Forecast, by Treatment Type 2020 & 2033
- Table 76: Global AI in Oncology Market Volume K Unit Forecast, by Treatment Type 2020 & 2033
- Table 77: Global AI in Oncology Market Revenue Million Forecast, by Application 2020 & 2033
- Table 78: Global AI in Oncology Market Volume K Unit Forecast, by Application 2020 & 2033
- Table 79: Global AI in Oncology Market Revenue Million Forecast, by Country 2020 & 2033
- Table 80: Global AI in Oncology Market Volume K Unit Forecast, by Country 2020 & 2033
- Table 81: GCC AI in Oncology Market Revenue (Million) Forecast, by Application 2020 & 2033
- Table 82: GCC AI in Oncology Market Volume (K Unit) Forecast, by Application 2020 & 2033
- Table 83: South Africa AI in Oncology Market Revenue (Million) Forecast, by Application 2020 & 2033
- Table 84: South Africa AI in Oncology Market Volume (K Unit) Forecast, by Application 2020 & 2033
- Table 85: Rest of Middle East and Africa AI in Oncology Market Revenue (Million) Forecast, by Application 2020 & 2033
- Table 86: Rest of Middle East and Africa AI in Oncology Market Volume (K Unit) Forecast, by Application 2020 & 2033
- Table 87: Global AI in Oncology Market Revenue Million Forecast, by Component 2020 & 2033
- Table 88: Global AI in Oncology Market Volume K Unit Forecast, by Component 2020 & 2033
- Table 89: Global AI in Oncology Market Revenue Million Forecast, by Cancer Type 2020 & 2033
- Table 90: Global AI in Oncology Market Volume K Unit Forecast, by Cancer Type 2020 & 2033
- Table 91: Global AI in Oncology Market Revenue Million Forecast, by Treatment Type 2020 & 2033
- Table 92: Global AI in Oncology Market Volume K Unit Forecast, by Treatment Type 2020 & 2033
- Table 93: Global AI in Oncology Market Revenue Million Forecast, by Application 2020 & 2033
- Table 94: Global AI in Oncology Market Volume K Unit Forecast, by Application 2020 & 2033
- Table 95: Global AI in Oncology Market Revenue Million Forecast, by Country 2020 & 2033
- Table 96: Global AI in Oncology Market Volume K Unit Forecast, by Country 2020 & 2033
- Table 97: Brazil AI in Oncology Market Revenue (Million) Forecast, by Application 2020 & 2033
- Table 98: Brazil AI in Oncology Market Volume (K Unit) Forecast, by Application 2020 & 2033
- Table 99: Argentina AI in Oncology Market Revenue (Million) Forecast, by Application 2020 & 2033
- Table 100: Argentina AI in Oncology Market Volume (K Unit) Forecast, by Application 2020 & 2033
- Table 101: Rest of South America AI in Oncology Market Revenue (Million) Forecast, by Application 2020 & 2033
- Table 102: Rest of South America AI in Oncology Market Volume (K Unit) Forecast, by Application 2020 & 2033
Frequently Asked Questions
1. What is the projected Compound Annual Growth Rate (CAGR) of the AI in Oncology Market?
The projected CAGR is approximately 35.51%.
2. Which companies are prominent players in the AI in Oncology Market?
Key companies in the market include IBM Corporation, Digital Diagnostics Inc, PathAI, Medtronic, NVIDIA Corporation, GE Healthcare, Siemens Healthineers AG, Azra AI, Median Technologies Inc, Intel Corporation, ConcertAI LLC.
3. What are the main segments of the AI in Oncology Market?
The market segments include Component, Cancer Type, Treatment Type, Application.
4. Can you provide details about the market size?
The market size is estimated to be USD 1.46 Million as of 2022.
5. What are some drivers contributing to market growth?
Surging Advancements in Healthcare Infrastructure; Increasing Prevalence of Cancer; Rising Demand for Early and Accurate Diagnosis of Cancer.
6. What are the notable trends driving market growth?
Chemotherapy Segment is Expected to Have a Highest Growth Rate in the Forecast Period.
7. Are there any restraints impacting market growth?
High Initial Costs and Concerns over the Replacement of Human Workforce.
8. Can you provide examples of recent developments in the market?
In September 2021, Owkin, Inc., in collaboration with Cleveland Clinic researchers, announced the development of a deep-learning model that predicts survival and health outcomes for hepatocellular carcinoma.
9. What pricing options are available for accessing the report?
Pricing options include single-user, multi-user, and enterprise licenses priced at USD 4750, USD 5250, and USD 8750 respectively.
10. Is the market size provided in terms of value or volume?
The market size is provided in terms of value, measured in Million and volume, measured in K Unit.
11. Are there any specific market keywords associated with the report?
Yes, the market keyword associated with the report is "AI in Oncology Market," which aids in identifying and referencing the specific market segment covered.
12. How do I determine which pricing option suits my needs best?
The pricing options vary based on user requirements and access needs. Individual users may opt for single-user licenses, while businesses requiring broader access may choose multi-user or enterprise licenses for cost-effective access to the report.
13. Are there any additional resources or data provided in the AI in Oncology Market report?
While the report offers comprehensive insights, it's advisable to review the specific contents or supplementary materials provided to ascertain if additional resources or data are available.
14. How can I stay updated on further developments or reports in the AI in Oncology Market?
To stay informed about further developments, trends, and reports in the AI in Oncology Market, consider subscribing to industry newsletters, following relevant companies and organizations, or regularly checking reputable industry news sources and publications.
Methodology
Step 1 - Identification of Relevant Samples Size from Population Database


Step 2 - Approaches for Defining Global Market Size (Value, Volume* & Price*)

Note*: In applicable scenarios
Step 3 - Data Sources
Primary Research
- Web Analytics
- Survey Reports
- Research Institute
- Latest Research Reports
- Opinion Leaders
Secondary Research
- Annual Reports
- White Paper
- Latest Press Release
- Industry Association
- Paid Database
- Investor Presentations

Step 4 - Data Triangulation
Involves using different sources of information in order to increase the validity of a study
These sources are likely to be stakeholders in a program - participants, other researchers, program staff, other community members, and so on.
Then we put all data in single framework & apply various statistical tools to find out the dynamic on the market.
During the analysis stage, feedback from the stakeholder groups would be compared to determine areas of agreement as well as areas of divergence