
Key Insights
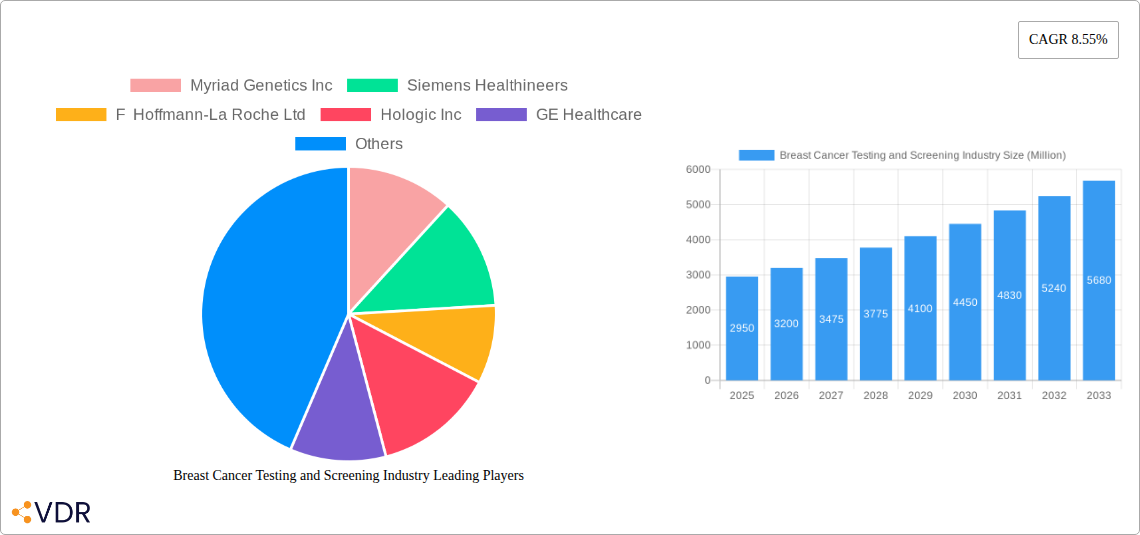
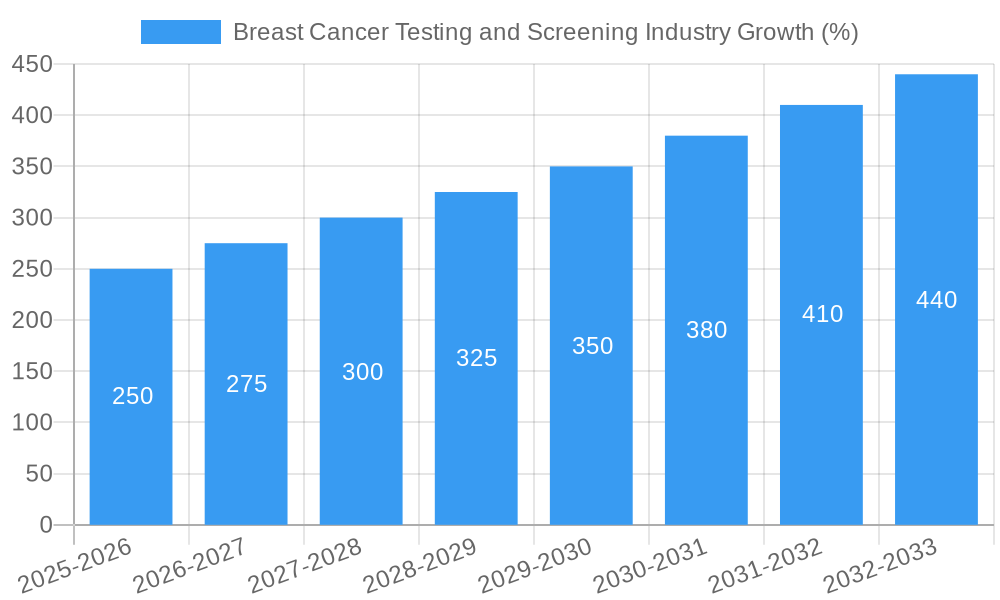
The global breast cancer testing and screening market, valued at $2.95 billion in 2025, is projected to experience robust growth, driven by increasing breast cancer incidence, advancements in diagnostic technologies, and rising awareness about early detection. The compound annual growth rate (CAGR) of 8.55% from 2025 to 2033 indicates a significant expansion of this market. Key drivers include the growing adoption of genomic tests like BRCA gene testing, offering personalized risk assessment and treatment strategies. The increasing utilization of advanced imaging techniques, such as mammography, ultrasound, and MRI, further fuels market growth. These technologies provide higher accuracy and earlier detection of cancerous lesions, leading to improved patient outcomes and reduced mortality rates. While the market faces restraints such as high testing costs and limited access to advanced technologies in certain regions, the rising prevalence of breast cancer, coupled with technological advancements and supportive government initiatives promoting early detection programs, will continue to propel market expansion. The segmentation of the market into genomic and imaging tests reveals a dynamic landscape, with genomic testing expected to see faster growth due to its increasing role in personalized medicine. Leading companies like Myriad Genetics, Siemens Healthineers, and Roche are at the forefront of innovation and market competition, continuously developing and introducing more sophisticated diagnostic tools. Geographic expansion, particularly in developing countries with increasing healthcare infrastructure and awareness campaigns, represents a significant growth opportunity.
The market's growth trajectory is shaped by several factors. Increased healthcare spending, particularly in developed nations, creates a favorable environment for advanced diagnostic technologies. Growing demand for minimally invasive procedures and the associated development of less-invasive imaging techniques are contributing factors. Furthermore, the rising prevalence of breast cancer among younger women is a significant driver, highlighting the need for efficient and early detection methods. The increasing focus on precision medicine and the demand for personalized treatments tailored to individual genetic profiles is further driving the growth of genomic testing within this market. Future growth is anticipated to be heavily influenced by ongoing technological advancements, regulatory approvals of new diagnostic tools, and the continuous development of effective public health strategies aimed at raising awareness and improving access to breast cancer screening across various demographics and geographic regions.
Breast Cancer Testing and Screening Industry Market Report: 2019-2033
This comprehensive report provides a detailed analysis of the Breast Cancer Testing and Screening industry, offering invaluable insights for industry professionals, investors, and strategic decision-makers. The report covers the period 2019-2033, with a focus on the forecast period 2025-2033, utilizing 2025 as the base year. Market values are presented in million units.
Breast Cancer Testing and Screening Industry Market Dynamics & Structure
This section analyzes the market's competitive landscape, technological advancements, regulatory influences, and market trends within the parent market of healthcare diagnostics and the child market of women's health. The industry exhibits moderate concentration, with key players like Myriad Genetics, Siemens Healthineers, and Hologic holding significant market share (estimated at xx% collectively in 2025).
- Market Concentration: Moderate, with a few major players dominating.
- Technological Innovation: Driven by advancements in genomics, imaging technologies (e.g., mammography, MRI), and AI-powered diagnostic tools. Barriers to innovation include high R&D costs and stringent regulatory approvals.
- Regulatory Frameworks: Stringent regulations (e.g., FDA approvals in the US) influence product development and market access. Variations in regulatory landscapes across different geographies impact market dynamics.
- Competitive Product Substitutes: Limited direct substitutes; however, alternative screening methods and evolving treatment approaches influence market growth.
- End-User Demographics: Primarily focused on women, with age and risk factors influencing testing frequency. Growing awareness and proactive healthcare seeking drive market expansion.
- M&A Trends: Moderate M&A activity observed in recent years, driven by consolidation and expansion into new technologies. An estimated xx M&A deals were recorded between 2019-2024.
Breast Cancer Testing and Screening Industry Growth Trends & Insights
The Breast Cancer Testing and Screening market experienced substantial growth between 2019 and 2024, driven by increasing breast cancer incidence rates, rising awareness, and technological advancements. The market size is projected to reach xx million units in 2025, exhibiting a CAGR of xx% during the forecast period (2025-2033). This growth is fueled by factors such as expanding screening programs, increasing adoption of advanced diagnostic techniques, and greater access to healthcare in emerging economies. Technological disruptions, including the introduction of liquid biopsies and AI-powered diagnostic tools, are further accelerating market expansion. Shifting consumer behavior towards proactive healthcare and personalized medicine is also significantly influencing market adoption rates. Market penetration for advanced genomic tests remains relatively low but is projected to increase substantially over the forecast period, driven by improving affordability and awareness.
Dominant Regions, Countries, or Segments in Breast Cancer Testing and Screening Industry
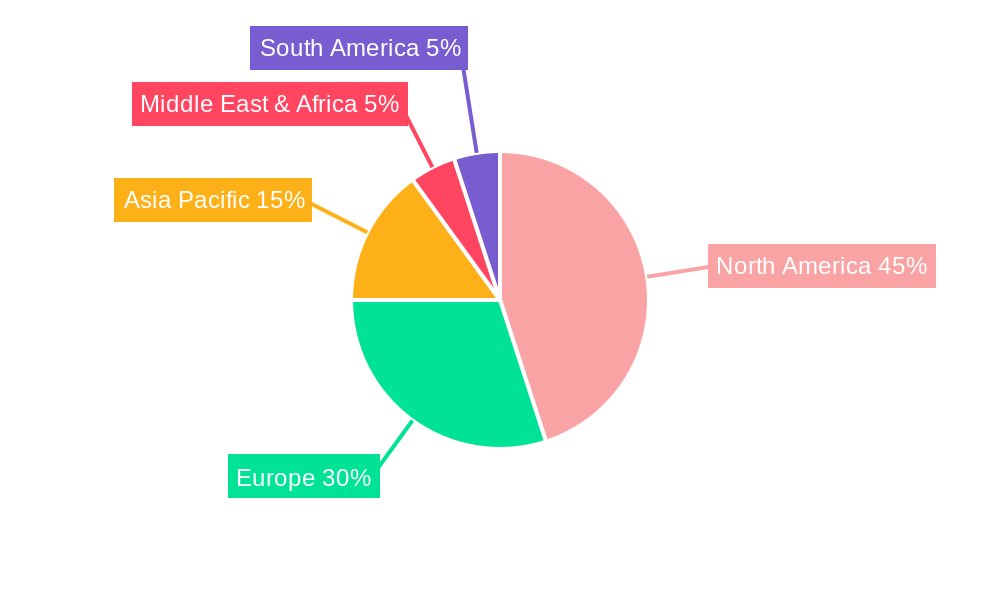
North America currently holds the largest market share in the Breast Cancer Testing and Screening industry, driven by high healthcare expenditure, advanced healthcare infrastructure, and early adoption of new technologies. However, Asia Pacific is poised for significant growth, fueled by rising disposable incomes, improving healthcare infrastructure, and increasing awareness.
By Test Segment:
- Genomic Tests: This segment is experiencing rapid growth due to increased accuracy and personalized medicine capabilities.
- Imaging Tests: This segment remains a significant portion of the market, driven by its established role in early detection and widespread availability.
Key Drivers:
- North America: High healthcare spending, robust infrastructure, early adoption of new technologies.
- Asia Pacific: Rising disposable incomes, improving healthcare infrastructure, increasing awareness campaigns.
- Europe: Established healthcare systems and ongoing investments in cancer research.
The dominance of North America is attributed to factors like high healthcare expenditure per capita, advanced medical infrastructure, and early adoption of innovative testing technologies. The Asia Pacific region showcases substantial growth potential driven by increasing healthcare awareness, expanding healthcare infrastructure, and rising disposable incomes.
Breast Cancer Testing and Screening Industry Product Landscape
The product landscape is characterized by a wide range of tests and technologies, including genomic tests (e.g., BRCA gene testing), imaging tests (mammography, MRI, ultrasound), and diagnostic tools. Recent innovations include liquid biopsies, which offer minimally invasive screening options, and AI-powered image analysis tools, enhancing diagnostic accuracy and efficiency. Key selling propositions include improved accuracy, reduced invasiveness, and personalized risk assessment, leading to improved patient outcomes. Technological advancements are focused on enhancing sensitivity, specificity, and accessibility of testing.
Key Drivers, Barriers & Challenges in Breast Cancer Testing and Screening Industry
Key Drivers:
- Rising breast cancer incidence rates globally.
- Growing awareness and proactive healthcare seeking.
- Technological advancements in diagnostic tools and testing methods.
- Government initiatives and funding for cancer research and screening programs.
Key Challenges & Restraints:
- High cost of advanced testing procedures, limiting access in some regions.
- Stringent regulatory requirements for new product approvals.
- Competition from established players and emerging technologies.
- Uneven distribution of healthcare resources globally. This results in reduced access to testing in underserved populations, impacting market growth in certain regions by an estimated xx% in 2025.
Emerging Opportunities in Breast Cancer Testing and Screening Industry
- Expanding into underserved markets with affordable and accessible testing solutions.
- Development of point-of-care diagnostic tools for faster and more convenient testing.
- Integration of AI and machine learning for improved diagnostic accuracy and personalized risk assessment.
- Leveraging telemedicine platforms for remote screening and monitoring.
Growth Accelerators in the Breast Cancer Testing and Screening Industry
Long-term growth will be driven by continuous technological innovation, strategic partnerships between diagnostic companies and healthcare providers, and expansion into emerging markets. Strategic collaborations focused on integrating advanced technologies into existing healthcare workflows will accelerate adoption. Furthermore, personalized medicine approaches focusing on tailored screening based on individual risk profiles will fuel market expansion.
Key Players Shaping the Breast Cancer Testing and Screening Industry Market
- Myriad Genetics Inc
- Siemens Healthineers
- F Hoffmann-La Roche Ltd
- Hologic Inc
- GE Healthcare
- Koninklijke Philips N V
- Carestream Health
- Quest Diagnostics Incorporated
- NanoString Technologies Inc
- Fujifilm Holdings Corporation
Notable Milestones in Breast Cancer Testing and Screening Industry Sector
- June 2022: Biomerica, Inc. partnered with Walmart to distribute the Aware Breast Self Exam device.
- March 2022: LifeCell launched the Breast Screen Panel, a comprehensive genetic screening test.
In-Depth Breast Cancer Testing and Screening Industry Market Outlook
The future of the Breast Cancer Testing and Screening market is promising, driven by continued technological advancements, rising awareness, and increasing healthcare spending globally. Strategic partnerships, expansion into emerging markets, and the development of affordable and accessible testing solutions will be key drivers of future growth. The market is poised for substantial expansion, with significant opportunities for innovation and market penetration.
Breast Cancer Testing and Screening Industry Segmentation
-
1. Test
-
1.1. Genomic Tests
- 1.1.1. DNA sequencing and testing
- 1.1.2. Gene expression profiling
-
1.2. Imaging Test
- 1.2.1. Mammograms
- 1.2.2. Ultrasound
- 1.2.3. MRI
- 1.2.4. Tomography
- 1.2.5. Other Imaging Tests
-
1.1. Genomic Tests
Breast Cancer Testing and Screening Industry Segmentation By Geography
-
1. North America
- 1.1. United States
- 1.2. Canada
- 1.3. Mexico
-
2. Europe
- 2.1. Germany
- 2.2. United Kindgom
- 2.3. France
- 2.4. Italy
- 2.5. Spain
- 2.6. Rest of Europe
-
3. Asia Pacific
- 3.1. China
- 3.2. Japan
- 3.3. India
- 3.4. Australia
- 3.5. South Korea
- 3.6. Rest of Asia Pacific
- 4. Middle East
-
5. GCC
- 5.1. South Africa
- 5.2. Rest of Middle East
-
6. South America
- 6.1. Brazil
- 6.2. Argentina
- 6.3. Rest of South America
Breast Cancer Testing and Screening Industry REPORT HIGHLIGHTS
| Aspects | Details |
|---|---|
| Study Period | 2019-2033 |
| Base Year | 2024 |
| Estimated Year | 2025 |
| Forecast Period | 2025-2033 |
| Historical Period | 2019-2024 |
| Growth Rate | CAGR of 8.55% from 2019-2033 |
| Segmentation |
|
Table of Contents
- 1. Introduction
- 1.1. Research Scope
- 1.2. Market Segmentation
- 1.3. Research Methodology
- 1.4. Definitions and Assumptions
- 2. Executive Summary
- 2.1. Introduction
- 3. Market Dynamics
- 3.1. Introduction
- 3.2. Market Drivers
- 3.2.1. Increasing Awareness about Early Detection of Breast Cancer; Growing Incidence of Breast Cancer; Increasing Government Initiatives and Support
- 3.3. Market Restrains
- 3.3.1. Controversies Related to Mammography; High Cost of Screening Tests in the Developing Countries
- 3.4. Market Trends
- 3.4.1. Mammograms segment is Expected to Dominate in the Breast Cancer Screening Test Market
- 4. Market Factor Analysis
- 4.1. Porters Five Forces
- 4.2. Supply/Value Chain
- 4.3. PESTEL analysis
- 4.4. Market Entropy
- 4.5. Patent/Trademark Analysis
- 5. Global Breast Cancer Testing and Screening Industry Analysis, Insights and Forecast, 2019-2031
- 5.1. Market Analysis, Insights and Forecast - by Test
- 5.1.1. Genomic Tests
- 5.1.1.1. DNA sequencing and testing
- 5.1.1.2. Gene expression profiling
- 5.1.2. Imaging Test
- 5.1.2.1. Mammograms
- 5.1.2.2. Ultrasound
- 5.1.2.3. MRI
- 5.1.2.4. Tomography
- 5.1.2.5. Other Imaging Tests
- 5.1.1. Genomic Tests
- 5.2. Market Analysis, Insights and Forecast - by Region
- 5.2.1. North America
- 5.2.2. Europe
- 5.2.3. Asia Pacific
- 5.2.4. Middle East
- 5.2.5. GCC
- 5.2.6. South America
- 5.1. Market Analysis, Insights and Forecast - by Test
- 6. North America Breast Cancer Testing and Screening Industry Analysis, Insights and Forecast, 2019-2031
- 6.1. Market Analysis, Insights and Forecast - by Test
- 6.1.1. Genomic Tests
- 6.1.1.1. DNA sequencing and testing
- 6.1.1.2. Gene expression profiling
- 6.1.2. Imaging Test
- 6.1.2.1. Mammograms
- 6.1.2.2. Ultrasound
- 6.1.2.3. MRI
- 6.1.2.4. Tomography
- 6.1.2.5. Other Imaging Tests
- 6.1.1. Genomic Tests
- 6.1. Market Analysis, Insights and Forecast - by Test
- 7. Europe Breast Cancer Testing and Screening Industry Analysis, Insights and Forecast, 2019-2031
- 7.1. Market Analysis, Insights and Forecast - by Test
- 7.1.1. Genomic Tests
- 7.1.1.1. DNA sequencing and testing
- 7.1.1.2. Gene expression profiling
- 7.1.2. Imaging Test
- 7.1.2.1. Mammograms
- 7.1.2.2. Ultrasound
- 7.1.2.3. MRI
- 7.1.2.4. Tomography
- 7.1.2.5. Other Imaging Tests
- 7.1.1. Genomic Tests
- 7.1. Market Analysis, Insights and Forecast - by Test
- 8. Asia Pacific Breast Cancer Testing and Screening Industry Analysis, Insights and Forecast, 2019-2031
- 8.1. Market Analysis, Insights and Forecast - by Test
- 8.1.1. Genomic Tests
- 8.1.1.1. DNA sequencing and testing
- 8.1.1.2. Gene expression profiling
- 8.1.2. Imaging Test
- 8.1.2.1. Mammograms
- 8.1.2.2. Ultrasound
- 8.1.2.3. MRI
- 8.1.2.4. Tomography
- 8.1.2.5. Other Imaging Tests
- 8.1.1. Genomic Tests
- 8.1. Market Analysis, Insights and Forecast - by Test
- 9. Middle East Breast Cancer Testing and Screening Industry Analysis, Insights and Forecast, 2019-2031
- 9.1. Market Analysis, Insights and Forecast - by Test
- 9.1.1. Genomic Tests
- 9.1.1.1. DNA sequencing and testing
- 9.1.1.2. Gene expression profiling
- 9.1.2. Imaging Test
- 9.1.2.1. Mammograms
- 9.1.2.2. Ultrasound
- 9.1.2.3. MRI
- 9.1.2.4. Tomography
- 9.1.2.5. Other Imaging Tests
- 9.1.1. Genomic Tests
- 9.1. Market Analysis, Insights and Forecast - by Test
- 10. GCC Breast Cancer Testing and Screening Industry Analysis, Insights and Forecast, 2019-2031
- 10.1. Market Analysis, Insights and Forecast - by Test
- 10.1.1. Genomic Tests
- 10.1.1.1. DNA sequencing and testing
- 10.1.1.2. Gene expression profiling
- 10.1.2. Imaging Test
- 10.1.2.1. Mammograms
- 10.1.2.2. Ultrasound
- 10.1.2.3. MRI
- 10.1.2.4. Tomography
- 10.1.2.5. Other Imaging Tests
- 10.1.1. Genomic Tests
- 10.1. Market Analysis, Insights and Forecast - by Test
- 11. South America Breast Cancer Testing and Screening Industry Analysis, Insights and Forecast, 2019-2031
- 11.1. Market Analysis, Insights and Forecast - by Test
- 11.1.1. Genomic Tests
- 11.1.1.1. DNA sequencing and testing
- 11.1.1.2. Gene expression profiling
- 11.1.2. Imaging Test
- 11.1.2.1. Mammograms
- 11.1.2.2. Ultrasound
- 11.1.2.3. MRI
- 11.1.2.4. Tomography
- 11.1.2.5. Other Imaging Tests
- 11.1.1. Genomic Tests
- 11.1. Market Analysis, Insights and Forecast - by Test
- 12. North America Breast Cancer Testing and Screening Industry Analysis, Insights and Forecast, 2019-2031
- 12.1. Market Analysis, Insights and Forecast - By Country/Sub-region
- 12.1.1 United States
- 12.1.2 Canada
- 12.1.3 Mexico
- 13. Europe Breast Cancer Testing and Screening Industry Analysis, Insights and Forecast, 2019-2031
- 13.1. Market Analysis, Insights and Forecast - By Country/Sub-region
- 13.1.1 Germany
- 13.1.2 United Kindgom
- 13.1.3 France
- 13.1.4 Italy
- 13.1.5 Spain
- 13.1.6 Rest of Europe
- 14. Asia Pacific Breast Cancer Testing and Screening Industry Analysis, Insights and Forecast, 2019-2031
- 14.1. Market Analysis, Insights and Forecast - By Country/Sub-region
- 14.1.1 China
- 14.1.2 Japan
- 14.1.3 India
- 14.1.4 Australia
- 14.1.5 South Korea
- 14.1.6 Rest of Asia Pacific
- 15. Middle East Breast Cancer Testing and Screening Industry Analysis, Insights and Forecast, 2019-2031
- 15.1. Market Analysis, Insights and Forecast - By Country/Sub-region
- 15.1.1.
- 16. GCC Breast Cancer Testing and Screening Industry Analysis, Insights and Forecast, 2019-2031
- 16.1. Market Analysis, Insights and Forecast - By Country/Sub-region
- 16.1.1 South Africa
- 16.1.2 Rest of Middle East
- 17. South America Breast Cancer Testing and Screening Industry Analysis, Insights and Forecast, 2019-2031
- 17.1. Market Analysis, Insights and Forecast - By Country/Sub-region
- 17.1.1 Brazil
- 17.1.2 Argentina
- 17.1.3 Rest of South America
- 18. Competitive Analysis
- 18.1. Global Market Share Analysis 2024
- 18.2. Company Profiles
- 18.2.1 Myriad Genetics Inc
- 18.2.1.1. Overview
- 18.2.1.2. Products
- 18.2.1.3. SWOT Analysis
- 18.2.1.4. Recent Developments
- 18.2.1.5. Financials (Based on Availability)
- 18.2.2 Siemens Healthineers
- 18.2.2.1. Overview
- 18.2.2.2. Products
- 18.2.2.3. SWOT Analysis
- 18.2.2.4. Recent Developments
- 18.2.2.5. Financials (Based on Availability)
- 18.2.3 F Hoffmann-La Roche Ltd
- 18.2.3.1. Overview
- 18.2.3.2. Products
- 18.2.3.3. SWOT Analysis
- 18.2.3.4. Recent Developments
- 18.2.3.5. Financials (Based on Availability)
- 18.2.4 Hologic Inc
- 18.2.4.1. Overview
- 18.2.4.2. Products
- 18.2.4.3. SWOT Analysis
- 18.2.4.4. Recent Developments
- 18.2.4.5. Financials (Based on Availability)
- 18.2.5 GE Healthcare
- 18.2.5.1. Overview
- 18.2.5.2. Products
- 18.2.5.3. SWOT Analysis
- 18.2.5.4. Recent Developments
- 18.2.5.5. Financials (Based on Availability)
- 18.2.6 Koninklijke Philips N V
- 18.2.6.1. Overview
- 18.2.6.2. Products
- 18.2.6.3. SWOT Analysis
- 18.2.6.4. Recent Developments
- 18.2.6.5. Financials (Based on Availability)
- 18.2.7 Carestream Health
- 18.2.7.1. Overview
- 18.2.7.2. Products
- 18.2.7.3. SWOT Analysis
- 18.2.7.4. Recent Developments
- 18.2.7.5. Financials (Based on Availability)
- 18.2.8 Quest Diagnostics Incorporated*List Not Exhaustive
- 18.2.8.1. Overview
- 18.2.8.2. Products
- 18.2.8.3. SWOT Analysis
- 18.2.8.4. Recent Developments
- 18.2.8.5. Financials (Based on Availability)
- 18.2.9 NanoString Technologies Inc
- 18.2.9.1. Overview
- 18.2.9.2. Products
- 18.2.9.3. SWOT Analysis
- 18.2.9.4. Recent Developments
- 18.2.9.5. Financials (Based on Availability)
- 18.2.10 Fujifilm Holdings Corporation
- 18.2.10.1. Overview
- 18.2.10.2. Products
- 18.2.10.3. SWOT Analysis
- 18.2.10.4. Recent Developments
- 18.2.10.5. Financials (Based on Availability)
- 18.2.1 Myriad Genetics Inc
List of Figures
- Figure 1: Global Breast Cancer Testing and Screening Industry Revenue Breakdown (Million, %) by Region 2024 & 2032
- Figure 2: Global Breast Cancer Testing and Screening Industry Volume Breakdown (K Unit, %) by Region 2024 & 2032
- Figure 3: North America Breast Cancer Testing and Screening Industry Revenue (Million), by Country 2024 & 2032
- Figure 4: North America Breast Cancer Testing and Screening Industry Volume (K Unit), by Country 2024 & 2032
- Figure 5: North America Breast Cancer Testing and Screening Industry Revenue Share (%), by Country 2024 & 2032
- Figure 6: North America Breast Cancer Testing and Screening Industry Volume Share (%), by Country 2024 & 2032
- Figure 7: Europe Breast Cancer Testing and Screening Industry Revenue (Million), by Country 2024 & 2032
- Figure 8: Europe Breast Cancer Testing and Screening Industry Volume (K Unit), by Country 2024 & 2032
- Figure 9: Europe Breast Cancer Testing and Screening Industry Revenue Share (%), by Country 2024 & 2032
- Figure 10: Europe Breast Cancer Testing and Screening Industry Volume Share (%), by Country 2024 & 2032
- Figure 11: Asia Pacific Breast Cancer Testing and Screening Industry Revenue (Million), by Country 2024 & 2032
- Figure 12: Asia Pacific Breast Cancer Testing and Screening Industry Volume (K Unit), by Country 2024 & 2032
- Figure 13: Asia Pacific Breast Cancer Testing and Screening Industry Revenue Share (%), by Country 2024 & 2032
- Figure 14: Asia Pacific Breast Cancer Testing and Screening Industry Volume Share (%), by Country 2024 & 2032
- Figure 15: Middle East Breast Cancer Testing and Screening Industry Revenue (Million), by Country 2024 & 2032
- Figure 16: Middle East Breast Cancer Testing and Screening Industry Volume (K Unit), by Country 2024 & 2032
- Figure 17: Middle East Breast Cancer Testing and Screening Industry Revenue Share (%), by Country 2024 & 2032
- Figure 18: Middle East Breast Cancer Testing and Screening Industry Volume Share (%), by Country 2024 & 2032
- Figure 19: GCC Breast Cancer Testing and Screening Industry Revenue (Million), by Country 2024 & 2032
- Figure 20: GCC Breast Cancer Testing and Screening Industry Volume (K Unit), by Country 2024 & 2032
- Figure 21: GCC Breast Cancer Testing and Screening Industry Revenue Share (%), by Country 2024 & 2032
- Figure 22: GCC Breast Cancer Testing and Screening Industry Volume Share (%), by Country 2024 & 2032
- Figure 23: South America Breast Cancer Testing and Screening Industry Revenue (Million), by Country 2024 & 2032
- Figure 24: South America Breast Cancer Testing and Screening Industry Volume (K Unit), by Country 2024 & 2032
- Figure 25: South America Breast Cancer Testing and Screening Industry Revenue Share (%), by Country 2024 & 2032
- Figure 26: South America Breast Cancer Testing and Screening Industry Volume Share (%), by Country 2024 & 2032
- Figure 27: North America Breast Cancer Testing and Screening Industry Revenue (Million), by Test 2024 & 2032
- Figure 28: North America Breast Cancer Testing and Screening Industry Volume (K Unit), by Test 2024 & 2032
- Figure 29: North America Breast Cancer Testing and Screening Industry Revenue Share (%), by Test 2024 & 2032
- Figure 30: North America Breast Cancer Testing and Screening Industry Volume Share (%), by Test 2024 & 2032
- Figure 31: North America Breast Cancer Testing and Screening Industry Revenue (Million), by Country 2024 & 2032
- Figure 32: North America Breast Cancer Testing and Screening Industry Volume (K Unit), by Country 2024 & 2032
- Figure 33: North America Breast Cancer Testing and Screening Industry Revenue Share (%), by Country 2024 & 2032
- Figure 34: North America Breast Cancer Testing and Screening Industry Volume Share (%), by Country 2024 & 2032
- Figure 35: Europe Breast Cancer Testing and Screening Industry Revenue (Million), by Test 2024 & 2032
- Figure 36: Europe Breast Cancer Testing and Screening Industry Volume (K Unit), by Test 2024 & 2032
- Figure 37: Europe Breast Cancer Testing and Screening Industry Revenue Share (%), by Test 2024 & 2032
- Figure 38: Europe Breast Cancer Testing and Screening Industry Volume Share (%), by Test 2024 & 2032
- Figure 39: Europe Breast Cancer Testing and Screening Industry Revenue (Million), by Country 2024 & 2032
- Figure 40: Europe Breast Cancer Testing and Screening Industry Volume (K Unit), by Country 2024 & 2032
- Figure 41: Europe Breast Cancer Testing and Screening Industry Revenue Share (%), by Country 2024 & 2032
- Figure 42: Europe Breast Cancer Testing and Screening Industry Volume Share (%), by Country 2024 & 2032
- Figure 43: Asia Pacific Breast Cancer Testing and Screening Industry Revenue (Million), by Test 2024 & 2032
- Figure 44: Asia Pacific Breast Cancer Testing and Screening Industry Volume (K Unit), by Test 2024 & 2032
- Figure 45: Asia Pacific Breast Cancer Testing and Screening Industry Revenue Share (%), by Test 2024 & 2032
- Figure 46: Asia Pacific Breast Cancer Testing and Screening Industry Volume Share (%), by Test 2024 & 2032
- Figure 47: Asia Pacific Breast Cancer Testing and Screening Industry Revenue (Million), by Country 2024 & 2032
- Figure 48: Asia Pacific Breast Cancer Testing and Screening Industry Volume (K Unit), by Country 2024 & 2032
- Figure 49: Asia Pacific Breast Cancer Testing and Screening Industry Revenue Share (%), by Country 2024 & 2032
- Figure 50: Asia Pacific Breast Cancer Testing and Screening Industry Volume Share (%), by Country 2024 & 2032
- Figure 51: Middle East Breast Cancer Testing and Screening Industry Revenue (Million), by Test 2024 & 2032
- Figure 52: Middle East Breast Cancer Testing and Screening Industry Volume (K Unit), by Test 2024 & 2032
- Figure 53: Middle East Breast Cancer Testing and Screening Industry Revenue Share (%), by Test 2024 & 2032
- Figure 54: Middle East Breast Cancer Testing and Screening Industry Volume Share (%), by Test 2024 & 2032
- Figure 55: Middle East Breast Cancer Testing and Screening Industry Revenue (Million), by Country 2024 & 2032
- Figure 56: Middle East Breast Cancer Testing and Screening Industry Volume (K Unit), by Country 2024 & 2032
- Figure 57: Middle East Breast Cancer Testing and Screening Industry Revenue Share (%), by Country 2024 & 2032
- Figure 58: Middle East Breast Cancer Testing and Screening Industry Volume Share (%), by Country 2024 & 2032
- Figure 59: GCC Breast Cancer Testing and Screening Industry Revenue (Million), by Test 2024 & 2032
- Figure 60: GCC Breast Cancer Testing and Screening Industry Volume (K Unit), by Test 2024 & 2032
- Figure 61: GCC Breast Cancer Testing and Screening Industry Revenue Share (%), by Test 2024 & 2032
- Figure 62: GCC Breast Cancer Testing and Screening Industry Volume Share (%), by Test 2024 & 2032
- Figure 63: GCC Breast Cancer Testing and Screening Industry Revenue (Million), by Country 2024 & 2032
- Figure 64: GCC Breast Cancer Testing and Screening Industry Volume (K Unit), by Country 2024 & 2032
- Figure 65: GCC Breast Cancer Testing and Screening Industry Revenue Share (%), by Country 2024 & 2032
- Figure 66: GCC Breast Cancer Testing and Screening Industry Volume Share (%), by Country 2024 & 2032
- Figure 67: South America Breast Cancer Testing and Screening Industry Revenue (Million), by Test 2024 & 2032
- Figure 68: South America Breast Cancer Testing and Screening Industry Volume (K Unit), by Test 2024 & 2032
- Figure 69: South America Breast Cancer Testing and Screening Industry Revenue Share (%), by Test 2024 & 2032
- Figure 70: South America Breast Cancer Testing and Screening Industry Volume Share (%), by Test 2024 & 2032
- Figure 71: South America Breast Cancer Testing and Screening Industry Revenue (Million), by Country 2024 & 2032
- Figure 72: South America Breast Cancer Testing and Screening Industry Volume (K Unit), by Country 2024 & 2032
- Figure 73: South America Breast Cancer Testing and Screening Industry Revenue Share (%), by Country 2024 & 2032
- Figure 74: South America Breast Cancer Testing and Screening Industry Volume Share (%), by Country 2024 & 2032
List of Tables
- Table 1: Global Breast Cancer Testing and Screening Industry Revenue Million Forecast, by Region 2019 & 2032
- Table 2: Global Breast Cancer Testing and Screening Industry Volume K Unit Forecast, by Region 2019 & 2032
- Table 3: Global Breast Cancer Testing and Screening Industry Revenue Million Forecast, by Test 2019 & 2032
- Table 4: Global Breast Cancer Testing and Screening Industry Volume K Unit Forecast, by Test 2019 & 2032
- Table 5: Global Breast Cancer Testing and Screening Industry Revenue Million Forecast, by Region 2019 & 2032
- Table 6: Global Breast Cancer Testing and Screening Industry Volume K Unit Forecast, by Region 2019 & 2032
- Table 7: Global Breast Cancer Testing and Screening Industry Revenue Million Forecast, by Country 2019 & 2032
- Table 8: Global Breast Cancer Testing and Screening Industry Volume K Unit Forecast, by Country 2019 & 2032
- Table 9: United States Breast Cancer Testing and Screening Industry Revenue (Million) Forecast, by Application 2019 & 2032
- Table 10: United States Breast Cancer Testing and Screening Industry Volume (K Unit) Forecast, by Application 2019 & 2032
- Table 11: Canada Breast Cancer Testing and Screening Industry Revenue (Million) Forecast, by Application 2019 & 2032
- Table 12: Canada Breast Cancer Testing and Screening Industry Volume (K Unit) Forecast, by Application 2019 & 2032
- Table 13: Mexico Breast Cancer Testing and Screening Industry Revenue (Million) Forecast, by Application 2019 & 2032
- Table 14: Mexico Breast Cancer Testing and Screening Industry Volume (K Unit) Forecast, by Application 2019 & 2032
- Table 15: Global Breast Cancer Testing and Screening Industry Revenue Million Forecast, by Country 2019 & 2032
- Table 16: Global Breast Cancer Testing and Screening Industry Volume K Unit Forecast, by Country 2019 & 2032
- Table 17: Germany Breast Cancer Testing and Screening Industry Revenue (Million) Forecast, by Application 2019 & 2032
- Table 18: Germany Breast Cancer Testing and Screening Industry Volume (K Unit) Forecast, by Application 2019 & 2032
- Table 19: United Kindgom Breast Cancer Testing and Screening Industry Revenue (Million) Forecast, by Application 2019 & 2032
- Table 20: United Kindgom Breast Cancer Testing and Screening Industry Volume (K Unit) Forecast, by Application 2019 & 2032
- Table 21: France Breast Cancer Testing and Screening Industry Revenue (Million) Forecast, by Application 2019 & 2032
- Table 22: France Breast Cancer Testing and Screening Industry Volume (K Unit) Forecast, by Application 2019 & 2032
- Table 23: Italy Breast Cancer Testing and Screening Industry Revenue (Million) Forecast, by Application 2019 & 2032
- Table 24: Italy Breast Cancer Testing and Screening Industry Volume (K Unit) Forecast, by Application 2019 & 2032
- Table 25: Spain Breast Cancer Testing and Screening Industry Revenue (Million) Forecast, by Application 2019 & 2032
- Table 26: Spain Breast Cancer Testing and Screening Industry Volume (K Unit) Forecast, by Application 2019 & 2032
- Table 27: Rest of Europe Breast Cancer Testing and Screening Industry Revenue (Million) Forecast, by Application 2019 & 2032
- Table 28: Rest of Europe Breast Cancer Testing and Screening Industry Volume (K Unit) Forecast, by Application 2019 & 2032
- Table 29: Global Breast Cancer Testing and Screening Industry Revenue Million Forecast, by Country 2019 & 2032
- Table 30: Global Breast Cancer Testing and Screening Industry Volume K Unit Forecast, by Country 2019 & 2032
- Table 31: China Breast Cancer Testing and Screening Industry Revenue (Million) Forecast, by Application 2019 & 2032
- Table 32: China Breast Cancer Testing and Screening Industry Volume (K Unit) Forecast, by Application 2019 & 2032
- Table 33: Japan Breast Cancer Testing and Screening Industry Revenue (Million) Forecast, by Application 2019 & 2032
- Table 34: Japan Breast Cancer Testing and Screening Industry Volume (K Unit) Forecast, by Application 2019 & 2032
- Table 35: India Breast Cancer Testing and Screening Industry Revenue (Million) Forecast, by Application 2019 & 2032
- Table 36: India Breast Cancer Testing and Screening Industry Volume (K Unit) Forecast, by Application 2019 & 2032
- Table 37: Australia Breast Cancer Testing and Screening Industry Revenue (Million) Forecast, by Application 2019 & 2032
- Table 38: Australia Breast Cancer Testing and Screening Industry Volume (K Unit) Forecast, by Application 2019 & 2032
- Table 39: South Korea Breast Cancer Testing and Screening Industry Revenue (Million) Forecast, by Application 2019 & 2032
- Table 40: South Korea Breast Cancer Testing and Screening Industry Volume (K Unit) Forecast, by Application 2019 & 2032
- Table 41: Rest of Asia Pacific Breast Cancer Testing and Screening Industry Revenue (Million) Forecast, by Application 2019 & 2032
- Table 42: Rest of Asia Pacific Breast Cancer Testing and Screening Industry Volume (K Unit) Forecast, by Application 2019 & 2032
- Table 43: Global Breast Cancer Testing and Screening Industry Revenue Million Forecast, by Country 2019 & 2032
- Table 44: Global Breast Cancer Testing and Screening Industry Volume K Unit Forecast, by Country 2019 & 2032
- Table 45: Breast Cancer Testing and Screening Industry Revenue (Million) Forecast, by Application 2019 & 2032
- Table 46: Breast Cancer Testing and Screening Industry Volume (K Unit) Forecast, by Application 2019 & 2032
- Table 47: Global Breast Cancer Testing and Screening Industry Revenue Million Forecast, by Country 2019 & 2032
- Table 48: Global Breast Cancer Testing and Screening Industry Volume K Unit Forecast, by Country 2019 & 2032
- Table 49: South Africa Breast Cancer Testing and Screening Industry Revenue (Million) Forecast, by Application 2019 & 2032
- Table 50: South Africa Breast Cancer Testing and Screening Industry Volume (K Unit) Forecast, by Application 2019 & 2032
- Table 51: Rest of Middle East Breast Cancer Testing and Screening Industry Revenue (Million) Forecast, by Application 2019 & 2032
- Table 52: Rest of Middle East Breast Cancer Testing and Screening Industry Volume (K Unit) Forecast, by Application 2019 & 2032
- Table 53: Global Breast Cancer Testing and Screening Industry Revenue Million Forecast, by Country 2019 & 2032
- Table 54: Global Breast Cancer Testing and Screening Industry Volume K Unit Forecast, by Country 2019 & 2032
- Table 55: Brazil Breast Cancer Testing and Screening Industry Revenue (Million) Forecast, by Application 2019 & 2032
- Table 56: Brazil Breast Cancer Testing and Screening Industry Volume (K Unit) Forecast, by Application 2019 & 2032
- Table 57: Argentina Breast Cancer Testing and Screening Industry Revenue (Million) Forecast, by Application 2019 & 2032
- Table 58: Argentina Breast Cancer Testing and Screening Industry Volume (K Unit) Forecast, by Application 2019 & 2032
- Table 59: Rest of South America Breast Cancer Testing and Screening Industry Revenue (Million) Forecast, by Application 2019 & 2032
- Table 60: Rest of South America Breast Cancer Testing and Screening Industry Volume (K Unit) Forecast, by Application 2019 & 2032
- Table 61: Global Breast Cancer Testing and Screening Industry Revenue Million Forecast, by Test 2019 & 2032
- Table 62: Global Breast Cancer Testing and Screening Industry Volume K Unit Forecast, by Test 2019 & 2032
- Table 63: Global Breast Cancer Testing and Screening Industry Revenue Million Forecast, by Country 2019 & 2032
- Table 64: Global Breast Cancer Testing and Screening Industry Volume K Unit Forecast, by Country 2019 & 2032
- Table 65: United States Breast Cancer Testing and Screening Industry Revenue (Million) Forecast, by Application 2019 & 2032
- Table 66: United States Breast Cancer Testing and Screening Industry Volume (K Unit) Forecast, by Application 2019 & 2032
- Table 67: Canada Breast Cancer Testing and Screening Industry Revenue (Million) Forecast, by Application 2019 & 2032
- Table 68: Canada Breast Cancer Testing and Screening Industry Volume (K Unit) Forecast, by Application 2019 & 2032
- Table 69: Mexico Breast Cancer Testing and Screening Industry Revenue (Million) Forecast, by Application 2019 & 2032
- Table 70: Mexico Breast Cancer Testing and Screening Industry Volume (K Unit) Forecast, by Application 2019 & 2032
- Table 71: Global Breast Cancer Testing and Screening Industry Revenue Million Forecast, by Test 2019 & 2032
- Table 72: Global Breast Cancer Testing and Screening Industry Volume K Unit Forecast, by Test 2019 & 2032
- Table 73: Global Breast Cancer Testing and Screening Industry Revenue Million Forecast, by Country 2019 & 2032
- Table 74: Global Breast Cancer Testing and Screening Industry Volume K Unit Forecast, by Country 2019 & 2032
- Table 75: Germany Breast Cancer Testing and Screening Industry Revenue (Million) Forecast, by Application 2019 & 2032
- Table 76: Germany Breast Cancer Testing and Screening Industry Volume (K Unit) Forecast, by Application 2019 & 2032
- Table 77: United Kindgom Breast Cancer Testing and Screening Industry Revenue (Million) Forecast, by Application 2019 & 2032
- Table 78: United Kindgom Breast Cancer Testing and Screening Industry Volume (K Unit) Forecast, by Application 2019 & 2032
- Table 79: France Breast Cancer Testing and Screening Industry Revenue (Million) Forecast, by Application 2019 & 2032
- Table 80: France Breast Cancer Testing and Screening Industry Volume (K Unit) Forecast, by Application 2019 & 2032
- Table 81: Italy Breast Cancer Testing and Screening Industry Revenue (Million) Forecast, by Application 2019 & 2032
- Table 82: Italy Breast Cancer Testing and Screening Industry Volume (K Unit) Forecast, by Application 2019 & 2032
- Table 83: Spain Breast Cancer Testing and Screening Industry Revenue (Million) Forecast, by Application 2019 & 2032
- Table 84: Spain Breast Cancer Testing and Screening Industry Volume (K Unit) Forecast, by Application 2019 & 2032
- Table 85: Rest of Europe Breast Cancer Testing and Screening Industry Revenue (Million) Forecast, by Application 2019 & 2032
- Table 86: Rest of Europe Breast Cancer Testing and Screening Industry Volume (K Unit) Forecast, by Application 2019 & 2032
- Table 87: Global Breast Cancer Testing and Screening Industry Revenue Million Forecast, by Test 2019 & 2032
- Table 88: Global Breast Cancer Testing and Screening Industry Volume K Unit Forecast, by Test 2019 & 2032
- Table 89: Global Breast Cancer Testing and Screening Industry Revenue Million Forecast, by Country 2019 & 2032
- Table 90: Global Breast Cancer Testing and Screening Industry Volume K Unit Forecast, by Country 2019 & 2032
- Table 91: China Breast Cancer Testing and Screening Industry Revenue (Million) Forecast, by Application 2019 & 2032
- Table 92: China Breast Cancer Testing and Screening Industry Volume (K Unit) Forecast, by Application 2019 & 2032
- Table 93: Japan Breast Cancer Testing and Screening Industry Revenue (Million) Forecast, by Application 2019 & 2032
- Table 94: Japan Breast Cancer Testing and Screening Industry Volume (K Unit) Forecast, by Application 2019 & 2032
- Table 95: India Breast Cancer Testing and Screening Industry Revenue (Million) Forecast, by Application 2019 & 2032
- Table 96: India Breast Cancer Testing and Screening Industry Volume (K Unit) Forecast, by Application 2019 & 2032
- Table 97: Australia Breast Cancer Testing and Screening Industry Revenue (Million) Forecast, by Application 2019 & 2032
- Table 98: Australia Breast Cancer Testing and Screening Industry Volume (K Unit) Forecast, by Application 2019 & 2032
- Table 99: South Korea Breast Cancer Testing and Screening Industry Revenue (Million) Forecast, by Application 2019 & 2032
- Table 100: South Korea Breast Cancer Testing and Screening Industry Volume (K Unit) Forecast, by Application 2019 & 2032
- Table 101: Rest of Asia Pacific Breast Cancer Testing and Screening Industry Revenue (Million) Forecast, by Application 2019 & 2032
- Table 102: Rest of Asia Pacific Breast Cancer Testing and Screening Industry Volume (K Unit) Forecast, by Application 2019 & 2032
- Table 103: Global Breast Cancer Testing and Screening Industry Revenue Million Forecast, by Test 2019 & 2032
- Table 104: Global Breast Cancer Testing and Screening Industry Volume K Unit Forecast, by Test 2019 & 2032
- Table 105: Global Breast Cancer Testing and Screening Industry Revenue Million Forecast, by Country 2019 & 2032
- Table 106: Global Breast Cancer Testing and Screening Industry Volume K Unit Forecast, by Country 2019 & 2032
- Table 107: Global Breast Cancer Testing and Screening Industry Revenue Million Forecast, by Test 2019 & 2032
- Table 108: Global Breast Cancer Testing and Screening Industry Volume K Unit Forecast, by Test 2019 & 2032
- Table 109: Global Breast Cancer Testing and Screening Industry Revenue Million Forecast, by Country 2019 & 2032
- Table 110: Global Breast Cancer Testing and Screening Industry Volume K Unit Forecast, by Country 2019 & 2032
- Table 111: South Africa Breast Cancer Testing and Screening Industry Revenue (Million) Forecast, by Application 2019 & 2032
- Table 112: South Africa Breast Cancer Testing and Screening Industry Volume (K Unit) Forecast, by Application 2019 & 2032
- Table 113: Rest of Middle East Breast Cancer Testing and Screening Industry Revenue (Million) Forecast, by Application 2019 & 2032
- Table 114: Rest of Middle East Breast Cancer Testing and Screening Industry Volume (K Unit) Forecast, by Application 2019 & 2032
- Table 115: Global Breast Cancer Testing and Screening Industry Revenue Million Forecast, by Test 2019 & 2032
- Table 116: Global Breast Cancer Testing and Screening Industry Volume K Unit Forecast, by Test 2019 & 2032
- Table 117: Global Breast Cancer Testing and Screening Industry Revenue Million Forecast, by Country 2019 & 2032
- Table 118: Global Breast Cancer Testing and Screening Industry Volume K Unit Forecast, by Country 2019 & 2032
- Table 119: Brazil Breast Cancer Testing and Screening Industry Revenue (Million) Forecast, by Application 2019 & 2032
- Table 120: Brazil Breast Cancer Testing and Screening Industry Volume (K Unit) Forecast, by Application 2019 & 2032
- Table 121: Argentina Breast Cancer Testing and Screening Industry Revenue (Million) Forecast, by Application 2019 & 2032
- Table 122: Argentina Breast Cancer Testing and Screening Industry Volume (K Unit) Forecast, by Application 2019 & 2032
- Table 123: Rest of South America Breast Cancer Testing and Screening Industry Revenue (Million) Forecast, by Application 2019 & 2032
- Table 124: Rest of South America Breast Cancer Testing and Screening Industry Volume (K Unit) Forecast, by Application 2019 & 2032
Frequently Asked Questions
1. What is the projected Compound Annual Growth Rate (CAGR) of the Breast Cancer Testing and Screening Industry?
The projected CAGR is approximately 8.55%.
2. Which companies are prominent players in the Breast Cancer Testing and Screening Industry?
Key companies in the market include Myriad Genetics Inc, Siemens Healthineers, F Hoffmann-La Roche Ltd, Hologic Inc, GE Healthcare, Koninklijke Philips N V, Carestream Health, Quest Diagnostics Incorporated*List Not Exhaustive, NanoString Technologies Inc, Fujifilm Holdings Corporation.
3. What are the main segments of the Breast Cancer Testing and Screening Industry?
The market segments include Test.
4. Can you provide details about the market size?
The market size is estimated to be USD 2.95 Million as of 2022.
5. What are some drivers contributing to market growth?
Increasing Awareness about Early Detection of Breast Cancer; Growing Incidence of Breast Cancer; Increasing Government Initiatives and Support.
6. What are the notable trends driving market growth?
Mammograms segment is Expected to Dominate in the Breast Cancer Screening Test Market.
7. Are there any restraints impacting market growth?
Controversies Related to Mammography; High Cost of Screening Tests in the Developing Countries.
8. Can you provide examples of recent developments in the market?
In June 2022, Biomerica, Inc. entered a general merchandise supplier agreement with Walmart. The Aware Breast Self Exam device will be sold in Walmart's retail system.
9. What pricing options are available for accessing the report?
Pricing options include single-user, multi-user, and enterprise licenses priced at USD 4750, USD 5250, and USD 8750 respectively.
10. Is the market size provided in terms of value or volume?
The market size is provided in terms of value, measured in Million and volume, measured in K Unit.
11. Are there any specific market keywords associated with the report?
Yes, the market keyword associated with the report is "Breast Cancer Testing and Screening Industry," which aids in identifying and referencing the specific market segment covered.
12. How do I determine which pricing option suits my needs best?
The pricing options vary based on user requirements and access needs. Individual users may opt for single-user licenses, while businesses requiring broader access may choose multi-user or enterprise licenses for cost-effective access to the report.
13. Are there any additional resources or data provided in the Breast Cancer Testing and Screening Industry report?
While the report offers comprehensive insights, it's advisable to review the specific contents or supplementary materials provided to ascertain if additional resources or data are available.
14. How can I stay updated on further developments or reports in the Breast Cancer Testing and Screening Industry?
To stay informed about further developments, trends, and reports in the Breast Cancer Testing and Screening Industry, consider subscribing to industry newsletters, following relevant companies and organizations, or regularly checking reputable industry news sources and publications.
Methodology
Step 1 - Identification of Relevant Samples Size from Population Database


Step 2 - Approaches for Defining Global Market Size (Value, Volume* & Price*)

Note*: In applicable scenarios
Step 3 - Data Sources
Primary Research
- Web Analytics
- Survey Reports
- Research Institute
- Latest Research Reports
- Opinion Leaders
Secondary Research
- Annual Reports
- White Paper
- Latest Press Release
- Industry Association
- Paid Database
- Investor Presentations

Step 4 - Data Triangulation
Involves using different sources of information in order to increase the validity of a study
These sources are likely to be stakeholders in a program - participants, other researchers, program staff, other community members, and so on.
Then we put all data in single framework & apply various statistical tools to find out the dynamic on the market.
During the analysis stage, feedback from the stakeholder groups would be compared to determine areas of agreement as well as areas of divergence


