

Key Insights
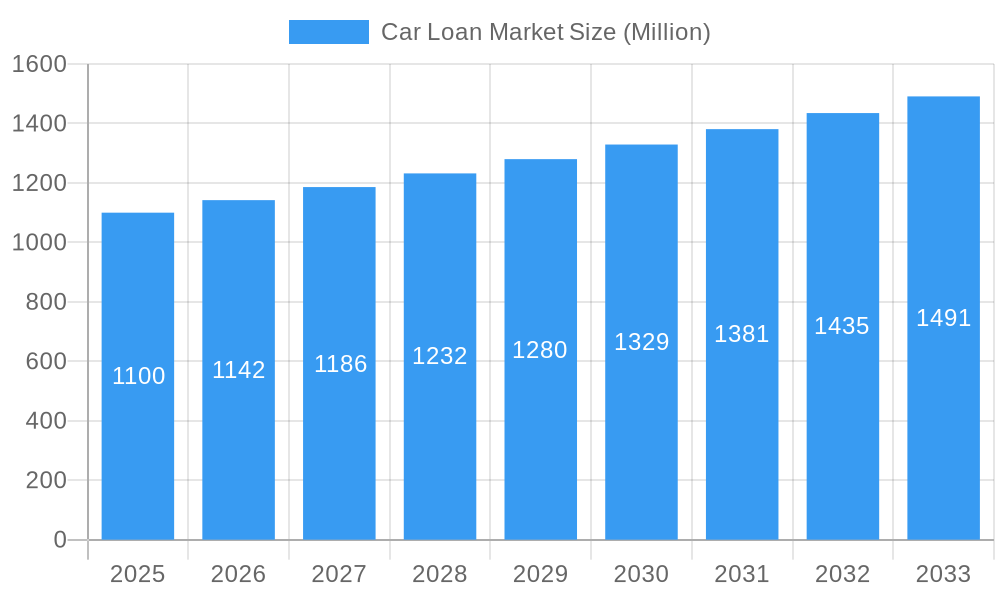
The global car loan market, valued at $1.10 trillion in 2025, is projected to experience steady growth, driven by several key factors. Rising vehicle sales, particularly in developing economies with expanding middle classes, fuel demand for financing options. Furthermore, the increasing availability of online lending platforms and competitive interest rates are making car loans more accessible. The shift towards longer loan terms also contributes to market expansion, although this trend carries inherent risks associated with increased overall loan costs for borrowers. Major players like Toyota Financial Services, Ford Credit, and Ally Financial dominate the landscape, leveraging their established networks and brand recognition. However, the market is also witnessing the emergence of fintech companies offering innovative lending solutions, increasing competition and potentially disrupting traditional models. Regulatory changes concerning lending practices and consumer protection remain a significant factor influencing market dynamics. The market's sustained growth is expected to continue through 2033, though the pace may moderate slightly due to potential economic fluctuations and evolving consumer preferences towards alternative transportation solutions.
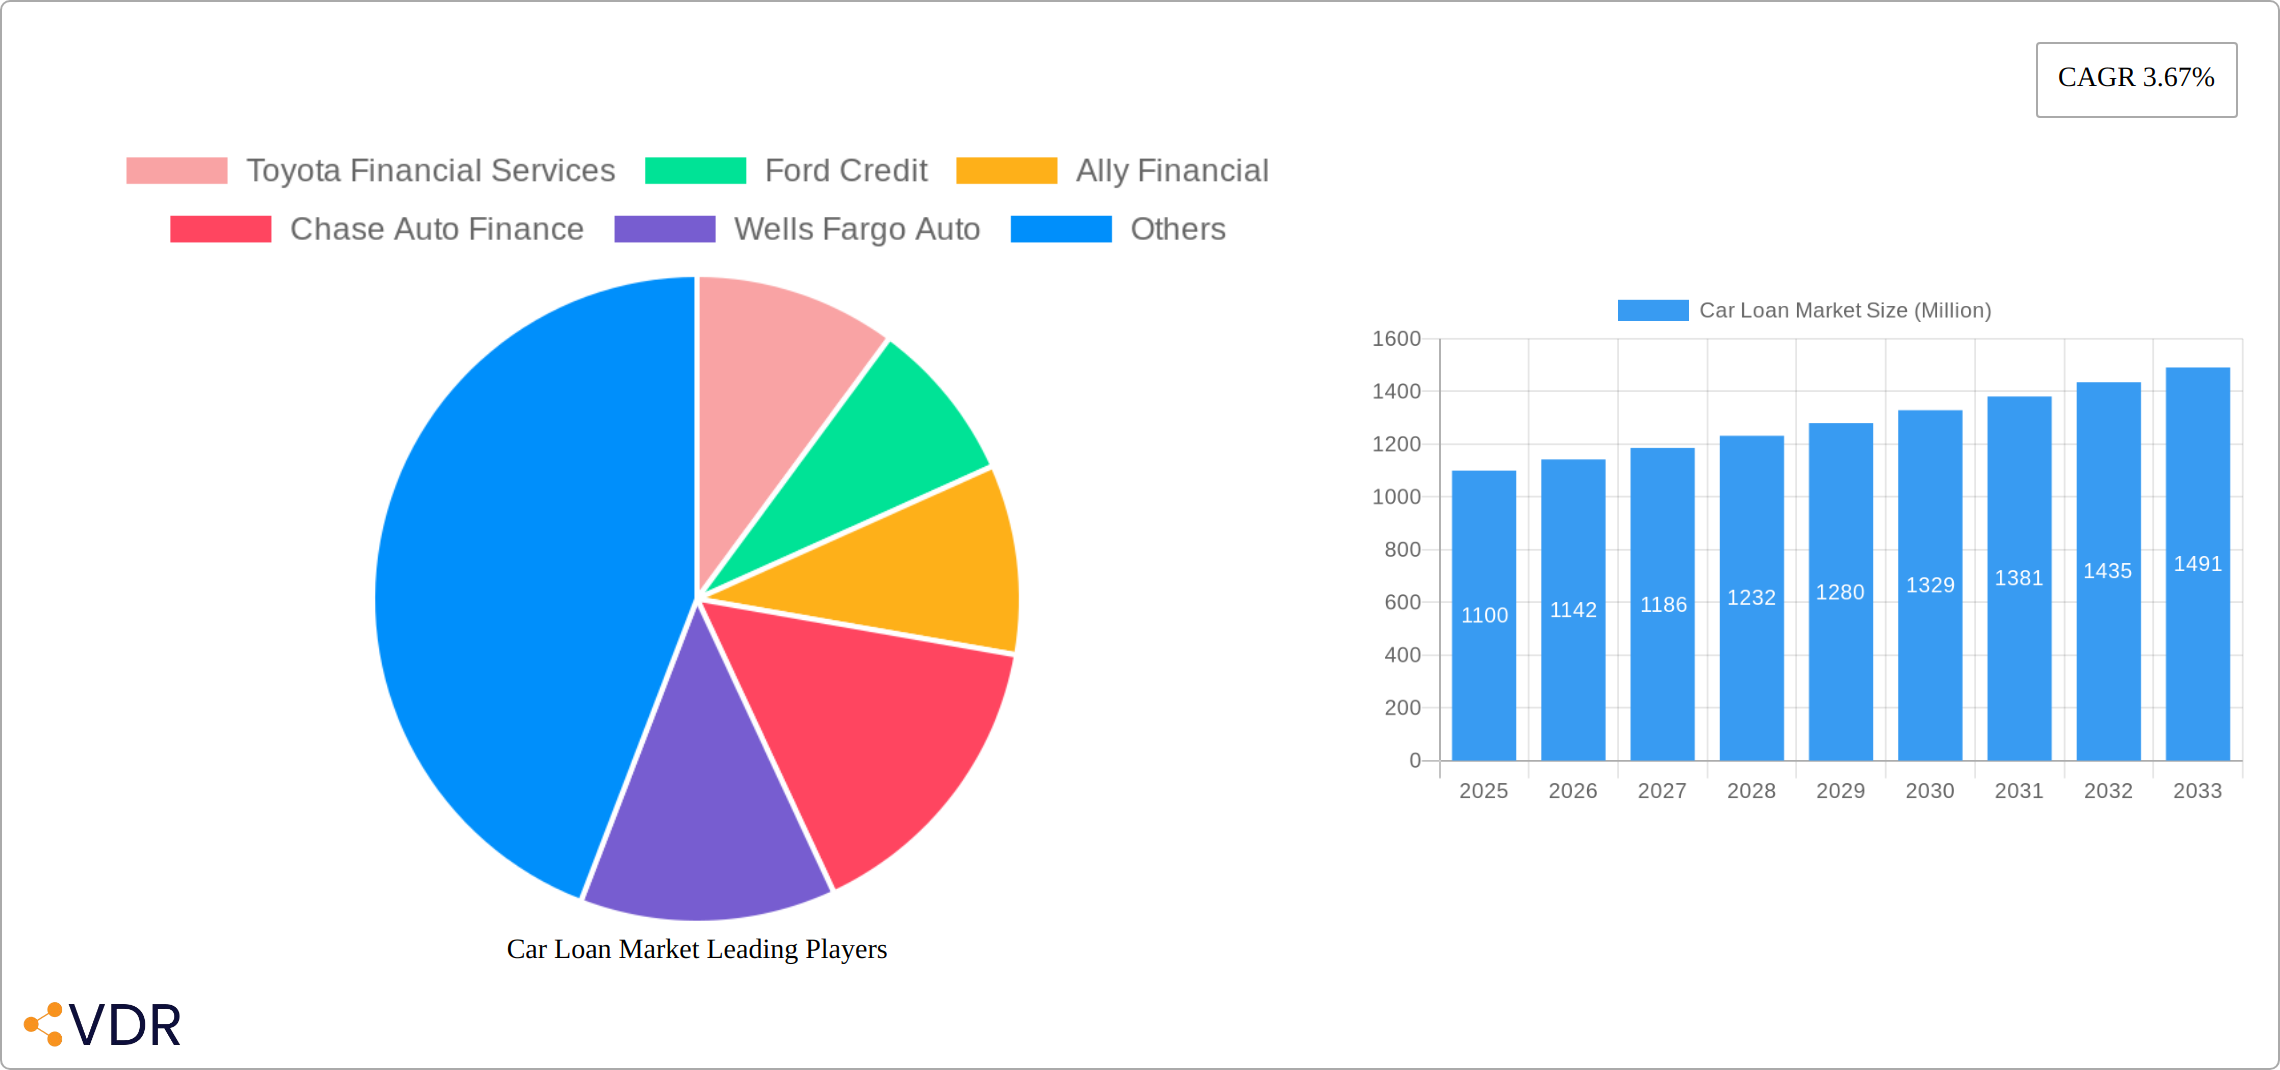
Car Loan Market Market Size (In Billion)
The forecast for the car loan market anticipates a compound annual growth rate (CAGR) of 3.67% from 2025 to 2033. This moderate yet consistent growth reflects a balance between increasing demand and potential economic headwinds. Regional variations will likely exist, with faster growth anticipated in regions experiencing rapid economic expansion and rising car ownership rates. The competitive landscape will continue to evolve, with established players adapting to technological advancements and newer entrants challenging the status quo. A focus on risk management and responsible lending practices will be critical for all market participants to ensure sustainable growth while protecting borrowers. Factors such as interest rate fluctuations, economic growth, and government policies will influence the market's trajectory in the coming years. Developing strategies to address evolving consumer needs and technological innovations will be crucial for success in this dynamic market.
Car Loan Market Company Market Share
Car Loan Market: A Comprehensive Market Report (2019-2033)
This in-depth report provides a comprehensive analysis of the global car loan market, offering invaluable insights for industry professionals, investors, and strategic planners. The study covers the historical period (2019-2024), the base year (2025), and forecasts the market's trajectory through 2033. The report meticulously analyzes market dynamics, growth trends, dominant players, and emerging opportunities within the parent market (Automotive Finance) and child market (Car Loans). The total market size is valued in millions of units.
Car Loan Market Dynamics & Structure
This section delves into the intricate structure of the car loan market, examining its concentration, innovation drivers, regulatory landscape, competitive dynamics, and key demographic trends. We analyze the impact of mergers and acquisitions (M&A) activities, providing quantitative data on market share distribution and M&A deal volumes.
- Market Concentration: The market exhibits a moderately concentrated structure, with a few dominant players commanding significant market share. Toyota Financial Services, Ford Credit, and Ally Financial hold a combined xx% market share as of 2025 (Estimated). Smaller players such as Chase Auto Finance, Wells Fargo Auto, Bank of America, and others compete fiercely for market share.
- Technological Innovation: Digitalization, fintech innovations, and the rise of online lending platforms are reshaping the car loan market. However, integration of new technologies faces challenges such as data security concerns and regulatory compliance.
- Regulatory Frameworks: Government regulations related to lending practices, interest rates, and consumer protection significantly impact market operations. Variations in these regulations across different regions influence market dynamics.
- Competitive Landscape: Competition stems from both traditional financial institutions and emerging fintech companies. The increasing adoption of online lending platforms intensifies the competitive pressure. Substitutes for car loans are limited, primarily encompassing leasing options.
- End-User Demographics: The market is largely driven by the millennial and Gen Z demographics, characterized by their preference for online services and flexible financing options.
- M&A Activity: The car loan market has witnessed xx M&A deals in the historical period (2019-2024), with an estimated xx deals projected for the forecast period (2025-2033). These activities are primarily driven by consolidation efforts and expansion into new markets.
Car Loan Market Growth Trends & Insights
This section presents a detailed analysis of the car loan market's growth trajectory, utilizing extensive data and advanced analytical techniques to understand market size evolution, adoption rates, technological disruption, and shifts in consumer behavior.
[Insert 600 words of analysis here, including specific metrics like CAGR and market penetration. Discuss factors impacting growth, such as economic conditions, consumer confidence, and technological advancements. Include relevant charts and graphs to visually represent data.]
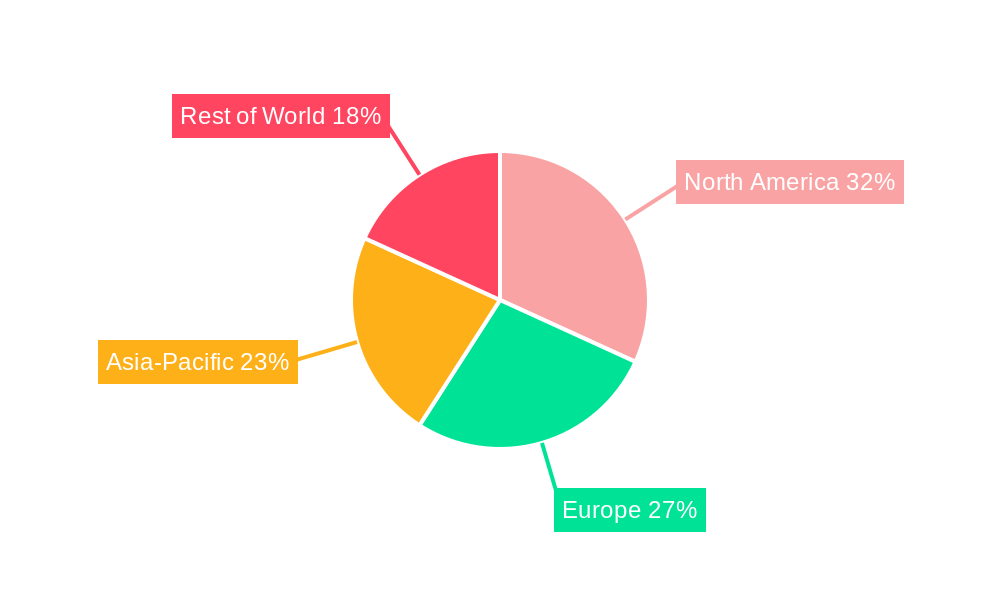
Dominant Regions, Countries, or Segments in Car Loan Market
The global car loan market is characterized by a dynamic interplay of economic strength, automotive industry maturity, and evolving consumer financing preferences. Several regions and countries stand out as key drivers of growth and innovation.
North America is projected to maintain its position as the largest market by volume and value. This dominance is fueled by a robust automotive sector, high disposable incomes, and a well-established financial infrastructure that supports accessible and competitive car loan products. The ongoing popularity of SUVs and trucks, coupled with a healthy used car market, further bolsters demand for financing. For instance, in 2023, the average car loan term in the US extended to approximately 70 months, indicating a consumer preference for lower monthly payments, which indirectly drives the demand for financing products. Furthermore, supportive government policies and the presence of major automotive manufacturers and lending institutions create a fertile ground for market expansion. The region also benefits from a high rate of technological adoption, with a significant portion of loan applications and approvals happening online, streamlining the customer journey.
- Key Drivers in North America:
- Strong automotive sales figures and a diverse range of vehicle models.
- Favorable lending conditions with competitive interest rates and flexible repayment terms.
- High consumer confidence and a propensity for vehicle ownership.
- Well-developed digital lending platforms enhancing accessibility and convenience.
- Significant presence of major automotive manufacturers and their captive finance arms.
- Quantitative Insights: Studies indicate that the North American car loan market is expected to grow at a Compound Annual Growth Rate (CAGR) of over 5% in the coming years, with projected market value reaching hundreds of billions of dollars. The average loan amount for new vehicles in the US has consistently hovered around $40,000, highlighting the substantial financing needs of consumers.
Europe presents a substantial and mature car loan market, with significant variations across individual countries. Western European nations, such as Germany, the UK, and France, exhibit high levels of car ownership and a mature financing ecosystem. The increasing demand for electric vehicles (EVs) is a notable trend, with governments often providing incentives that indirectly boost EV financing. While the market is mature, innovation in digital lending and personalized financing solutions is a key focus.
- Key Drivers in Europe:
- High vehicle penetration rates and a strong replacement cycle for vehicles.
- Growing adoption of electric and hybrid vehicles, supported by government initiatives.
- Development of sophisticated digital lending platforms and fintech solutions.
- Availability of diverse loan products, including leasing and subscription models.
- Quantitative Insights: The European market is estimated to contribute a significant share to the global car loan market, with particular growth anticipated in countries actively promoting EV adoption through subsidies and tax breaks.
Asia Pacific is emerging as a critical growth engine for the global car loan market. Countries like China, India, and Southeast Asian nations are experiencing a rapid increase in car ownership due to rising disposable incomes, rapid urbanization, and improving infrastructure. The younger demographic in these regions is increasingly embracing digital channels for financial services, making online car loan platforms highly appealing. The burgeoning automotive manufacturing sector in many of these countries also contributes to the demand for financing.
- Key Drivers in Asia Pacific:
- Rapidly growing middle class with increasing purchasing power.
- Young and digitally-savvy population driving adoption of online services.
- Expanding automotive production and sales, particularly in emerging economies.
- Government initiatives to boost domestic auto sales and encourage car ownership.
- Untapped potential in rural and semi-urban areas.
- Quantitative Insights: The Asia Pacific region is anticipated to witness the highest CAGR among all regions, driven by economies like India and China, where the demand for affordable transportation and financing solutions is immense. The growth in the two-wheeler and affordable car segments is a significant contributor.
Segments driving market growth include traditional retail financing, where consumers seek loans for personal vehicle purchases. However, there's a notable surge in demand for specialized financing catering to the burgeoning electric vehicle market. Additionally, the commercial vehicle financing segment, serving fleet operators and businesses, remains a stable and significant contributor. The increasing preference for flexible ownership models, such as car subscriptions and leasing, is also reshaping segment dynamics.
Car Loan Market Product Landscape
The car loan market is highly diverse, offering a spectrum of products designed to cater to the multifaceted needs and financial capabilities of consumers. At its core, the market features traditional car loans, which are the cornerstone of vehicle financing, allowing individuals to purchase new or used vehicles over a set repayment period. These are often categorized by their collateralization: secured loans, where the vehicle itself serves as collateral, typically offering lower interest rates due to reduced lender risk, and unsecured loans, which are granted based on the borrower's creditworthiness and may carry higher interest rates.
Beyond these foundational products, the market is increasingly populated by innovative financing options that are seamlessly integrated with digital platforms. This includes a growing emphasis on personalized loan structures, where terms, repayment schedules, and interest rates are tailored to individual financial profiles and preferences. The advent of streamlined online application processes has revolutionized customer experience, enabling borrowers to research, apply for, and often secure pre-approval for loans within minutes, significantly enhancing convenience and efficiency.
Technological advancements are at the forefront of this evolution. Artificial intelligence (AI) and machine learning (ML) are being extensively employed for sophisticated AI-driven credit scoring and risk assessment. This allows lenders to evaluate borrowers more accurately and quickly, leading to faster loan approvals and more precise risk management. Furthermore, the integration of AI can facilitate predictive analytics for loan performance, enabling proactive management of potential defaults. The ongoing digital transformation is also fostering the development of integrated financing solutions offered directly through automotive dealerships' online portals and manufacturer websites, creating a more cohesive and accessible car buying and financing journey.
Key Drivers, Barriers & Challenges in Car Loan Market
Key Drivers:
- Rising vehicle sales globally.
- Increasing affordability schemes and incentives for car ownership.
- Growing acceptance of online lending platforms.
- Favorable interest rates in certain regions.
Key Barriers and Challenges:
- Economic downturns and reduced consumer spending.
- Stringent regulatory compliance requirements.
- Intense competition from established players and new fintech entrants.
- Supply chain disruptions impacting vehicle availability. This resulted in a xx% reduction in loan originations in [Year].
Emerging Opportunities in Car Loan Market
- Expansion into Underserved Markets: Identifying and penetrating regions with growing car ownership rates and limited access to formal financing, particularly in emerging economies, presents a significant growth avenue. This includes catering to lower-income demographics and rural populations.
- Development of Innovative Financing Solutions: Creating specialized financing products tailored to specific customer segments is crucial. This includes, but is not limited to, dedicated electric vehicle (EV) financing with potentially longer terms or preferential rates to encourage adoption, as well as financing options for ride-sharing drivers or commercial fleets.
- Leveraging Big Data and AI for Enhanced Lending: Harnessing the power of big data analytics and AI for improved credit scoring, fraud detection, and personalized loan offerings can optimize risk management and customer acquisition. This allows for more accurate risk assessment beyond traditional credit scores and enables dynamic pricing and tailored product recommendations.
- Strategic Partnerships and Ecosystem Integration: Forging strategic alliances with automakers, dealerships, technology providers, and even insurance companies can lead to the development of bundled offerings and seamless integration of financing into the vehicle purchase process, creating a more comprehensive customer value proposition.
- Subscription and Usage-Based Financing Models: Exploring and developing flexible ownership models beyond traditional loans, such as car subscription services and usage-based financing, caters to evolving consumer preferences for flexibility and pay-as-you-go models.
- Refinancing and Portfolio Management Solutions: Offering attractive refinancing options for existing car loans can attract new customers and build loyalty. Additionally, developing advanced portfolio management tools for lenders can optimize returns and mitigate risks.
Growth Accelerators in the Car Loan Market Industry
The car loan market's growth trajectory is significantly propelled by several key factors, with technological advancements at the forefront. The widespread adoption of AI and machine learning is revolutionizing credit scoring, enabling more accurate and efficient assessment of borrower risk, thereby expediting loan application processing and reducing default rates. This technological integration also enhances improved risk management strategies for financial institutions, allowing for more informed lending decisions.
Strategic partnerships between financial institutions and automotive manufacturers are proving to be powerful growth catalysts. These collaborations facilitate the development of integrated financing solutions, offering seamless car buying and loan acquisition experiences directly at the point of sale, both online and offline.
Furthermore, the market is experiencing expansion by leveraging digital channels to reach a broader customer base. The increasing preference for online applications, digital onboarding, and remote servicing of loans is making car financing more accessible and convenient. Coupled with the focus on personalized offerings, lenders are able to tailor loan products to individual needs, thereby increasing customer satisfaction and acquisition rates. The continuous push for innovation in product development, such as specialized loans for electric vehicles and flexible repayment options, also fuels market expansion.
Key Players Shaping the Car Loan Market Market
Notable Milestones in Car Loan Market Sector
- May 2023: Art-Finance LLC acquired Volkswagen's Russian assets, significantly impacting the Russian car loan market.
- April 2022: Faurecia and Mercedes-Benz partnered to integrate an app platform, potentially influencing the digital car loan experience.
In-Depth Car Loan Market Market Outlook
The outlook for the car loan market is overwhelmingly positive, signaling a period of sustained and dynamic growth. This optimistic trajectory is primarily underpinned by the continuous evolution of technological advancements, particularly in the realm of artificial intelligence and machine learning. These technologies are not only optimizing the efficiency and accuracy of credit scoring and risk assessment but are also paving the way for more personalized and responsive loan products. The ability to analyze vast datasets allows lenders to better understand borrower behavior and tailor offerings accordingly.
The ongoing emphasis on strategic partnerships between financial institutions, automotive manufacturers, and technology providers is a critical factor shaping the industry's future. These collaborations are instrumental in creating integrated financing solutions that simplify the car purchasing journey for consumers, fostering greater adoption of car loans.
Moreover, the market's expansion into new and underserved markets, both geographically and demographically, presents significant growth potential. As emerging economies continue to develop and car ownership rises, the demand for accessible and affordable financing solutions will surge. The increasing prevalence of online platforms and the development of innovative financing solutions, such as flexible payment plans and specialized EV loans, are further broadening the market's reach and appeal.
In this rapidly evolving landscape, companies that demonstrate agility in adapting to changing consumer preferences and effectively leverage data-driven insights will undoubtedly gain a substantial competitive edge. The future of the car loan market will be defined by its ability to offer seamless, personalized, and technologically advanced financing experiences that meet the diverse needs of modern car buyers.
Car Loan Market Segmentation
-
1. Product Type
- 1.1. Passenger Vehicle
- 1.2. Commercial Vehicle
-
2. Ownership
- 2.1. New Vehicles
- 2.2. Used Vehicles
-
3. Provider Type
- 3.1. Banks
- 3.2. Non-Banking Financial Services
- 3.3. Original Equipment Manufacturers
- 3.4. Other Provider Types (Fintech Companies)
-
4. Tenure
- 4.1. Less Than Three Years
- 4.2. 3-5 Years
- 4.3. More Than 5 Years
Car Loan Market Segmentation By Geography
-
1. North America
- 1.1. United States
- 1.2. Canada
- 1.3. Rest of North America
-
2. Europe
- 2.1. United Kingdom
- 2.2. Germany
- 2.3. Rest of Europe
-
3. Asia Pacific
- 3.1. China
- 3.2. South Korea
- 3.3. Rest of Asia Pacific
-
4. Latin America
- 4.1. Brazil
- 4.2. Chile
- 4.3. Rest of Latin America
- 5. Middle East and Africa
- 6. UAE
- 7. Saudi Arabia
- 8. Rest of Middle East and Africa
Car Loan Market Regional Market Share
Geographic Coverage of Car Loan Market
Car Loan Market REPORT HIGHLIGHTS
| Aspects | Details |
|---|---|
| Study Period | 2020-2034 |
| Base Year | 2025 |
| Estimated Year | 2026 |
| Forecast Period | 2026-2034 |
| Historical Period | 2020-2025 |
| Growth Rate | CAGR of 3.67% from 2020-2034 |
| Segmentation |
|
Table of Contents
- 1. Introduction
- 1.1. Research Scope
- 1.2. Market Segmentation
- 1.3. Research Methodology
- 1.4. Definitions and Assumptions
- 2. Executive Summary
- 2.1. Introduction
- 3. Market Dynamics
- 3.1. Introduction
- 3.2. Market Drivers
- 3.2.1. Rise in Demand for Luxury Cars Fueling the Market Growth
- 3.3. Market Restrains
- 3.3.1. Rise in Demand for Luxury Cars Fueling the Market Growth
- 3.4. Market Trends
- 3.4.1. Increasing Sales of Passenger Cars in Asia
- 4. Market Factor Analysis
- 4.1. Porters Five Forces
- 4.2. Supply/Value Chain
- 4.3. PESTEL analysis
- 4.4. Market Entropy
- 4.5. Patent/Trademark Analysis
- 5. Global Car Loan Market Analysis, Insights and Forecast, 2020-2032
- 5.1. Market Analysis, Insights and Forecast - by Product Type
- 5.1.1. Passenger Vehicle
- 5.1.2. Commercial Vehicle
- 5.2. Market Analysis, Insights and Forecast - by Ownership
- 5.2.1. New Vehicles
- 5.2.2. Used Vehicles
- 5.3. Market Analysis, Insights and Forecast - by Provider Type
- 5.3.1. Banks
- 5.3.2. Non-Banking Financial Services
- 5.3.3. Original Equipment Manufacturers
- 5.3.4. Other Provider Types (Fintech Companies)
- 5.4. Market Analysis, Insights and Forecast - by Tenure
- 5.4.1. Less Than Three Years
- 5.4.2. 3-5 Years
- 5.4.3. More Than 5 Years
- 5.5. Market Analysis, Insights and Forecast - by Region
- 5.5.1. North America
- 5.5.2. Europe
- 5.5.3. Asia Pacific
- 5.5.4. Latin America
- 5.5.5. Middle East and Africa
- 5.5.6. UAE
- 5.5.7. Saudi Arabia
- 5.5.8. Rest of Middle East and Africa
- 5.1. Market Analysis, Insights and Forecast - by Product Type
- 6. North America Car Loan Market Analysis, Insights and Forecast, 2020-2032
- 6.1. Market Analysis, Insights and Forecast - by Product Type
- 6.1.1. Passenger Vehicle
- 6.1.2. Commercial Vehicle
- 6.2. Market Analysis, Insights and Forecast - by Ownership
- 6.2.1. New Vehicles
- 6.2.2. Used Vehicles
- 6.3. Market Analysis, Insights and Forecast - by Provider Type
- 6.3.1. Banks
- 6.3.2. Non-Banking Financial Services
- 6.3.3. Original Equipment Manufacturers
- 6.3.4. Other Provider Types (Fintech Companies)
- 6.4. Market Analysis, Insights and Forecast - by Tenure
- 6.4.1. Less Than Three Years
- 6.4.2. 3-5 Years
- 6.4.3. More Than 5 Years
- 6.1. Market Analysis, Insights and Forecast - by Product Type
- 7. Europe Car Loan Market Analysis, Insights and Forecast, 2020-2032
- 7.1. Market Analysis, Insights and Forecast - by Product Type
- 7.1.1. Passenger Vehicle
- 7.1.2. Commercial Vehicle
- 7.2. Market Analysis, Insights and Forecast - by Ownership
- 7.2.1. New Vehicles
- 7.2.2. Used Vehicles
- 7.3. Market Analysis, Insights and Forecast - by Provider Type
- 7.3.1. Banks
- 7.3.2. Non-Banking Financial Services
- 7.3.3. Original Equipment Manufacturers
- 7.3.4. Other Provider Types (Fintech Companies)
- 7.4. Market Analysis, Insights and Forecast - by Tenure
- 7.4.1. Less Than Three Years
- 7.4.2. 3-5 Years
- 7.4.3. More Than 5 Years
- 7.1. Market Analysis, Insights and Forecast - by Product Type
- 8. Asia Pacific Car Loan Market Analysis, Insights and Forecast, 2020-2032
- 8.1. Market Analysis, Insights and Forecast - by Product Type
- 8.1.1. Passenger Vehicle
- 8.1.2. Commercial Vehicle
- 8.2. Market Analysis, Insights and Forecast - by Ownership
- 8.2.1. New Vehicles
- 8.2.2. Used Vehicles
- 8.3. Market Analysis, Insights and Forecast - by Provider Type
- 8.3.1. Banks
- 8.3.2. Non-Banking Financial Services
- 8.3.3. Original Equipment Manufacturers
- 8.3.4. Other Provider Types (Fintech Companies)
- 8.4. Market Analysis, Insights and Forecast - by Tenure
- 8.4.1. Less Than Three Years
- 8.4.2. 3-5 Years
- 8.4.3. More Than 5 Years
- 8.1. Market Analysis, Insights and Forecast - by Product Type
- 9. Latin America Car Loan Market Analysis, Insights and Forecast, 2020-2032
- 9.1. Market Analysis, Insights and Forecast - by Product Type
- 9.1.1. Passenger Vehicle
- 9.1.2. Commercial Vehicle
- 9.2. Market Analysis, Insights and Forecast - by Ownership
- 9.2.1. New Vehicles
- 9.2.2. Used Vehicles
- 9.3. Market Analysis, Insights and Forecast - by Provider Type
- 9.3.1. Banks
- 9.3.2. Non-Banking Financial Services
- 9.3.3. Original Equipment Manufacturers
- 9.3.4. Other Provider Types (Fintech Companies)
- 9.4. Market Analysis, Insights and Forecast - by Tenure
- 9.4.1. Less Than Three Years
- 9.4.2. 3-5 Years
- 9.4.3. More Than 5 Years
- 9.1. Market Analysis, Insights and Forecast - by Product Type
- 10. Middle East and Africa Car Loan Market Analysis, Insights and Forecast, 2020-2032
- 10.1. Market Analysis, Insights and Forecast - by Product Type
- 10.1.1. Passenger Vehicle
- 10.1.2. Commercial Vehicle
- 10.2. Market Analysis, Insights and Forecast - by Ownership
- 10.2.1. New Vehicles
- 10.2.2. Used Vehicles
- 10.3. Market Analysis, Insights and Forecast - by Provider Type
- 10.3.1. Banks
- 10.3.2. Non-Banking Financial Services
- 10.3.3. Original Equipment Manufacturers
- 10.3.4. Other Provider Types (Fintech Companies)
- 10.4. Market Analysis, Insights and Forecast - by Tenure
- 10.4.1. Less Than Three Years
- 10.4.2. 3-5 Years
- 10.4.3. More Than 5 Years
- 10.1. Market Analysis, Insights and Forecast - by Product Type
- 11. UAE Car Loan Market Analysis, Insights and Forecast, 2020-2032
- 11.1. Market Analysis, Insights and Forecast - by Product Type
- 11.1.1. Passenger Vehicle
- 11.1.2. Commercial Vehicle
- 11.2. Market Analysis, Insights and Forecast - by Ownership
- 11.2.1. New Vehicles
- 11.2.2. Used Vehicles
- 11.3. Market Analysis, Insights and Forecast - by Provider Type
- 11.3.1. Banks
- 11.3.2. Non-Banking Financial Services
- 11.3.3. Original Equipment Manufacturers
- 11.3.4. Other Provider Types (Fintech Companies)
- 11.4. Market Analysis, Insights and Forecast - by Tenure
- 11.4.1. Less Than Three Years
- 11.4.2. 3-5 Years
- 11.4.3. More Than 5 Years
- 11.1. Market Analysis, Insights and Forecast - by Product Type
- 12. Saudi Arabia Car Loan Market Analysis, Insights and Forecast, 2020-2032
- 12.1. Market Analysis, Insights and Forecast - by Product Type
- 12.1.1. Passenger Vehicle
- 12.1.2. Commercial Vehicle
- 12.2. Market Analysis, Insights and Forecast - by Ownership
- 12.2.1. New Vehicles
- 12.2.2. Used Vehicles
- 12.3. Market Analysis, Insights and Forecast - by Provider Type
- 12.3.1. Banks
- 12.3.2. Non-Banking Financial Services
- 12.3.3. Original Equipment Manufacturers
- 12.3.4. Other Provider Types (Fintech Companies)
- 12.4. Market Analysis, Insights and Forecast - by Tenure
- 12.4.1. Less Than Three Years
- 12.4.2. 3-5 Years
- 12.4.3. More Than 5 Years
- 12.1. Market Analysis, Insights and Forecast - by Product Type
- 13. Rest of Middle East and Africa Car Loan Market Analysis, Insights and Forecast, 2020-2032
- 13.1. Market Analysis, Insights and Forecast - by Product Type
- 13.1.1. Passenger Vehicle
- 13.1.2. Commercial Vehicle
- 13.2. Market Analysis, Insights and Forecast - by Ownership
- 13.2.1. New Vehicles
- 13.2.2. Used Vehicles
- 13.3. Market Analysis, Insights and Forecast - by Provider Type
- 13.3.1. Banks
- 13.3.2. Non-Banking Financial Services
- 13.3.3. Original Equipment Manufacturers
- 13.3.4. Other Provider Types (Fintech Companies)
- 13.4. Market Analysis, Insights and Forecast - by Tenure
- 13.4.1. Less Than Three Years
- 13.4.2. 3-5 Years
- 13.4.3. More Than 5 Years
- 13.1. Market Analysis, Insights and Forecast - by Product Type
- 14. Competitive Analysis
- 14.1. Global Market Share Analysis 2025
- 14.2. Company Profiles
- 14.2.1 Toyota Financial Services
- 14.2.1.1. Overview
- 14.2.1.2. Products
- 14.2.1.3. SWOT Analysis
- 14.2.1.4. Recent Developments
- 14.2.1.5. Financials (Based on Availability)
- 14.2.2 Ford Credit
- 14.2.2.1. Overview
- 14.2.2.2. Products
- 14.2.2.3. SWOT Analysis
- 14.2.2.4. Recent Developments
- 14.2.2.5. Financials (Based on Availability)
- 14.2.3 Ally Financial
- 14.2.3.1. Overview
- 14.2.3.2. Products
- 14.2.3.3. SWOT Analysis
- 14.2.3.4. Recent Developments
- 14.2.3.5. Financials (Based on Availability)
- 14.2.4 Chase Auto Finance
- 14.2.4.1. Overview
- 14.2.4.2. Products
- 14.2.4.3. SWOT Analysis
- 14.2.4.4. Recent Developments
- 14.2.4.5. Financials (Based on Availability)
- 14.2.5 Wells Fargo Auto
- 14.2.5.1. Overview
- 14.2.5.2. Products
- 14.2.5.3. SWOT Analysis
- 14.2.5.4. Recent Developments
- 14.2.5.5. Financials (Based on Availability)
- 14.2.6 Bank of America
- 14.2.6.1. Overview
- 14.2.6.2. Products
- 14.2.6.3. SWOT Analysis
- 14.2.6.4. Recent Developments
- 14.2.6.5. Financials (Based on Availability)
- 14.2.7 Capital One Auto Finance
- 14.2.7.1. Overview
- 14.2.7.2. Products
- 14.2.7.3. SWOT Analysis
- 14.2.7.4. Recent Developments
- 14.2.7.5. Financials (Based on Availability)
- 14.2.8 Santander Consumer
- 14.2.8.1. Overview
- 14.2.8.2. Products
- 14.2.8.3. SWOT Analysis
- 14.2.8.4. Recent Developments
- 14.2.8.5. Financials (Based on Availability)
- 14.2.9 BMW Financial Services
- 14.2.9.1. Overview
- 14.2.9.2. Products
- 14.2.9.3. SWOT Analysis
- 14.2.9.4. Recent Developments
- 14.2.9.5. Financials (Based on Availability)
- 14.2.10 Honda Financial Services**List Not Exhaustive
- 14.2.10.1. Overview
- 14.2.10.2. Products
- 14.2.10.3. SWOT Analysis
- 14.2.10.4. Recent Developments
- 14.2.10.5. Financials (Based on Availability)
- 14.2.1 Toyota Financial Services
List of Figures
- Figure 1: Global Car Loan Market Revenue Breakdown (Million, %) by Region 2025 & 2033
- Figure 2: Global Car Loan Market Volume Breakdown (Trillion, %) by Region 2025 & 2033
- Figure 3: North America Car Loan Market Revenue (Million), by Product Type 2025 & 2033
- Figure 4: North America Car Loan Market Volume (Trillion), by Product Type 2025 & 2033
- Figure 5: North America Car Loan Market Revenue Share (%), by Product Type 2025 & 2033
- Figure 6: North America Car Loan Market Volume Share (%), by Product Type 2025 & 2033
- Figure 7: North America Car Loan Market Revenue (Million), by Ownership 2025 & 2033
- Figure 8: North America Car Loan Market Volume (Trillion), by Ownership 2025 & 2033
- Figure 9: North America Car Loan Market Revenue Share (%), by Ownership 2025 & 2033
- Figure 10: North America Car Loan Market Volume Share (%), by Ownership 2025 & 2033
- Figure 11: North America Car Loan Market Revenue (Million), by Provider Type 2025 & 2033
- Figure 12: North America Car Loan Market Volume (Trillion), by Provider Type 2025 & 2033
- Figure 13: North America Car Loan Market Revenue Share (%), by Provider Type 2025 & 2033
- Figure 14: North America Car Loan Market Volume Share (%), by Provider Type 2025 & 2033
- Figure 15: North America Car Loan Market Revenue (Million), by Tenure 2025 & 2033
- Figure 16: North America Car Loan Market Volume (Trillion), by Tenure 2025 & 2033
- Figure 17: North America Car Loan Market Revenue Share (%), by Tenure 2025 & 2033
- Figure 18: North America Car Loan Market Volume Share (%), by Tenure 2025 & 2033
- Figure 19: North America Car Loan Market Revenue (Million), by Country 2025 & 2033
- Figure 20: North America Car Loan Market Volume (Trillion), by Country 2025 & 2033
- Figure 21: North America Car Loan Market Revenue Share (%), by Country 2025 & 2033
- Figure 22: North America Car Loan Market Volume Share (%), by Country 2025 & 2033
- Figure 23: Europe Car Loan Market Revenue (Million), by Product Type 2025 & 2033
- Figure 24: Europe Car Loan Market Volume (Trillion), by Product Type 2025 & 2033
- Figure 25: Europe Car Loan Market Revenue Share (%), by Product Type 2025 & 2033
- Figure 26: Europe Car Loan Market Volume Share (%), by Product Type 2025 & 2033
- Figure 27: Europe Car Loan Market Revenue (Million), by Ownership 2025 & 2033
- Figure 28: Europe Car Loan Market Volume (Trillion), by Ownership 2025 & 2033
- Figure 29: Europe Car Loan Market Revenue Share (%), by Ownership 2025 & 2033
- Figure 30: Europe Car Loan Market Volume Share (%), by Ownership 2025 & 2033
- Figure 31: Europe Car Loan Market Revenue (Million), by Provider Type 2025 & 2033
- Figure 32: Europe Car Loan Market Volume (Trillion), by Provider Type 2025 & 2033
- Figure 33: Europe Car Loan Market Revenue Share (%), by Provider Type 2025 & 2033
- Figure 34: Europe Car Loan Market Volume Share (%), by Provider Type 2025 & 2033
- Figure 35: Europe Car Loan Market Revenue (Million), by Tenure 2025 & 2033
- Figure 36: Europe Car Loan Market Volume (Trillion), by Tenure 2025 & 2033
- Figure 37: Europe Car Loan Market Revenue Share (%), by Tenure 2025 & 2033
- Figure 38: Europe Car Loan Market Volume Share (%), by Tenure 2025 & 2033
- Figure 39: Europe Car Loan Market Revenue (Million), by Country 2025 & 2033
- Figure 40: Europe Car Loan Market Volume (Trillion), by Country 2025 & 2033
- Figure 41: Europe Car Loan Market Revenue Share (%), by Country 2025 & 2033
- Figure 42: Europe Car Loan Market Volume Share (%), by Country 2025 & 2033
- Figure 43: Asia Pacific Car Loan Market Revenue (Million), by Product Type 2025 & 2033
- Figure 44: Asia Pacific Car Loan Market Volume (Trillion), by Product Type 2025 & 2033
- Figure 45: Asia Pacific Car Loan Market Revenue Share (%), by Product Type 2025 & 2033
- Figure 46: Asia Pacific Car Loan Market Volume Share (%), by Product Type 2025 & 2033
- Figure 47: Asia Pacific Car Loan Market Revenue (Million), by Ownership 2025 & 2033
- Figure 48: Asia Pacific Car Loan Market Volume (Trillion), by Ownership 2025 & 2033
- Figure 49: Asia Pacific Car Loan Market Revenue Share (%), by Ownership 2025 & 2033
- Figure 50: Asia Pacific Car Loan Market Volume Share (%), by Ownership 2025 & 2033
- Figure 51: Asia Pacific Car Loan Market Revenue (Million), by Provider Type 2025 & 2033
- Figure 52: Asia Pacific Car Loan Market Volume (Trillion), by Provider Type 2025 & 2033
- Figure 53: Asia Pacific Car Loan Market Revenue Share (%), by Provider Type 2025 & 2033
- Figure 54: Asia Pacific Car Loan Market Volume Share (%), by Provider Type 2025 & 2033
- Figure 55: Asia Pacific Car Loan Market Revenue (Million), by Tenure 2025 & 2033
- Figure 56: Asia Pacific Car Loan Market Volume (Trillion), by Tenure 2025 & 2033
- Figure 57: Asia Pacific Car Loan Market Revenue Share (%), by Tenure 2025 & 2033
- Figure 58: Asia Pacific Car Loan Market Volume Share (%), by Tenure 2025 & 2033
- Figure 59: Asia Pacific Car Loan Market Revenue (Million), by Country 2025 & 2033
- Figure 60: Asia Pacific Car Loan Market Volume (Trillion), by Country 2025 & 2033
- Figure 61: Asia Pacific Car Loan Market Revenue Share (%), by Country 2025 & 2033
- Figure 62: Asia Pacific Car Loan Market Volume Share (%), by Country 2025 & 2033
- Figure 63: Latin America Car Loan Market Revenue (Million), by Product Type 2025 & 2033
- Figure 64: Latin America Car Loan Market Volume (Trillion), by Product Type 2025 & 2033
- Figure 65: Latin America Car Loan Market Revenue Share (%), by Product Type 2025 & 2033
- Figure 66: Latin America Car Loan Market Volume Share (%), by Product Type 2025 & 2033
- Figure 67: Latin America Car Loan Market Revenue (Million), by Ownership 2025 & 2033
- Figure 68: Latin America Car Loan Market Volume (Trillion), by Ownership 2025 & 2033
- Figure 69: Latin America Car Loan Market Revenue Share (%), by Ownership 2025 & 2033
- Figure 70: Latin America Car Loan Market Volume Share (%), by Ownership 2025 & 2033
- Figure 71: Latin America Car Loan Market Revenue (Million), by Provider Type 2025 & 2033
- Figure 72: Latin America Car Loan Market Volume (Trillion), by Provider Type 2025 & 2033
- Figure 73: Latin America Car Loan Market Revenue Share (%), by Provider Type 2025 & 2033
- Figure 74: Latin America Car Loan Market Volume Share (%), by Provider Type 2025 & 2033
- Figure 75: Latin America Car Loan Market Revenue (Million), by Tenure 2025 & 2033
- Figure 76: Latin America Car Loan Market Volume (Trillion), by Tenure 2025 & 2033
- Figure 77: Latin America Car Loan Market Revenue Share (%), by Tenure 2025 & 2033
- Figure 78: Latin America Car Loan Market Volume Share (%), by Tenure 2025 & 2033
- Figure 79: Latin America Car Loan Market Revenue (Million), by Country 2025 & 2033
- Figure 80: Latin America Car Loan Market Volume (Trillion), by Country 2025 & 2033
- Figure 81: Latin America Car Loan Market Revenue Share (%), by Country 2025 & 2033
- Figure 82: Latin America Car Loan Market Volume Share (%), by Country 2025 & 2033
- Figure 83: Middle East and Africa Car Loan Market Revenue (Million), by Product Type 2025 & 2033
- Figure 84: Middle East and Africa Car Loan Market Volume (Trillion), by Product Type 2025 & 2033
- Figure 85: Middle East and Africa Car Loan Market Revenue Share (%), by Product Type 2025 & 2033
- Figure 86: Middle East and Africa Car Loan Market Volume Share (%), by Product Type 2025 & 2033
- Figure 87: Middle East and Africa Car Loan Market Revenue (Million), by Ownership 2025 & 2033
- Figure 88: Middle East and Africa Car Loan Market Volume (Trillion), by Ownership 2025 & 2033
- Figure 89: Middle East and Africa Car Loan Market Revenue Share (%), by Ownership 2025 & 2033
- Figure 90: Middle East and Africa Car Loan Market Volume Share (%), by Ownership 2025 & 2033
- Figure 91: Middle East and Africa Car Loan Market Revenue (Million), by Provider Type 2025 & 2033
- Figure 92: Middle East and Africa Car Loan Market Volume (Trillion), by Provider Type 2025 & 2033
- Figure 93: Middle East and Africa Car Loan Market Revenue Share (%), by Provider Type 2025 & 2033
- Figure 94: Middle East and Africa Car Loan Market Volume Share (%), by Provider Type 2025 & 2033
- Figure 95: Middle East and Africa Car Loan Market Revenue (Million), by Tenure 2025 & 2033
- Figure 96: Middle East and Africa Car Loan Market Volume (Trillion), by Tenure 2025 & 2033
- Figure 97: Middle East and Africa Car Loan Market Revenue Share (%), by Tenure 2025 & 2033
- Figure 98: Middle East and Africa Car Loan Market Volume Share (%), by Tenure 2025 & 2033
- Figure 99: Middle East and Africa Car Loan Market Revenue (Million), by Country 2025 & 2033
- Figure 100: Middle East and Africa Car Loan Market Volume (Trillion), by Country 2025 & 2033
- Figure 101: Middle East and Africa Car Loan Market Revenue Share (%), by Country 2025 & 2033
- Figure 102: Middle East and Africa Car Loan Market Volume Share (%), by Country 2025 & 2033
- Figure 103: UAE Car Loan Market Revenue (Million), by Product Type 2025 & 2033
- Figure 104: UAE Car Loan Market Volume (Trillion), by Product Type 2025 & 2033
- Figure 105: UAE Car Loan Market Revenue Share (%), by Product Type 2025 & 2033
- Figure 106: UAE Car Loan Market Volume Share (%), by Product Type 2025 & 2033
- Figure 107: UAE Car Loan Market Revenue (Million), by Ownership 2025 & 2033
- Figure 108: UAE Car Loan Market Volume (Trillion), by Ownership 2025 & 2033
- Figure 109: UAE Car Loan Market Revenue Share (%), by Ownership 2025 & 2033
- Figure 110: UAE Car Loan Market Volume Share (%), by Ownership 2025 & 2033
- Figure 111: UAE Car Loan Market Revenue (Million), by Provider Type 2025 & 2033
- Figure 112: UAE Car Loan Market Volume (Trillion), by Provider Type 2025 & 2033
- Figure 113: UAE Car Loan Market Revenue Share (%), by Provider Type 2025 & 2033
- Figure 114: UAE Car Loan Market Volume Share (%), by Provider Type 2025 & 2033
- Figure 115: UAE Car Loan Market Revenue (Million), by Tenure 2025 & 2033
- Figure 116: UAE Car Loan Market Volume (Trillion), by Tenure 2025 & 2033
- Figure 117: UAE Car Loan Market Revenue Share (%), by Tenure 2025 & 2033
- Figure 118: UAE Car Loan Market Volume Share (%), by Tenure 2025 & 2033
- Figure 119: UAE Car Loan Market Revenue (Million), by Country 2025 & 2033
- Figure 120: UAE Car Loan Market Volume (Trillion), by Country 2025 & 2033
- Figure 121: UAE Car Loan Market Revenue Share (%), by Country 2025 & 2033
- Figure 122: UAE Car Loan Market Volume Share (%), by Country 2025 & 2033
- Figure 123: Saudi Arabia Car Loan Market Revenue (Million), by Product Type 2025 & 2033
- Figure 124: Saudi Arabia Car Loan Market Volume (Trillion), by Product Type 2025 & 2033
- Figure 125: Saudi Arabia Car Loan Market Revenue Share (%), by Product Type 2025 & 2033
- Figure 126: Saudi Arabia Car Loan Market Volume Share (%), by Product Type 2025 & 2033
- Figure 127: Saudi Arabia Car Loan Market Revenue (Million), by Ownership 2025 & 2033
- Figure 128: Saudi Arabia Car Loan Market Volume (Trillion), by Ownership 2025 & 2033
- Figure 129: Saudi Arabia Car Loan Market Revenue Share (%), by Ownership 2025 & 2033
- Figure 130: Saudi Arabia Car Loan Market Volume Share (%), by Ownership 2025 & 2033
- Figure 131: Saudi Arabia Car Loan Market Revenue (Million), by Provider Type 2025 & 2033
- Figure 132: Saudi Arabia Car Loan Market Volume (Trillion), by Provider Type 2025 & 2033
- Figure 133: Saudi Arabia Car Loan Market Revenue Share (%), by Provider Type 2025 & 2033
- Figure 134: Saudi Arabia Car Loan Market Volume Share (%), by Provider Type 2025 & 2033
- Figure 135: Saudi Arabia Car Loan Market Revenue (Million), by Tenure 2025 & 2033
- Figure 136: Saudi Arabia Car Loan Market Volume (Trillion), by Tenure 2025 & 2033
- Figure 137: Saudi Arabia Car Loan Market Revenue Share (%), by Tenure 2025 & 2033
- Figure 138: Saudi Arabia Car Loan Market Volume Share (%), by Tenure 2025 & 2033
- Figure 139: Saudi Arabia Car Loan Market Revenue (Million), by Country 2025 & 2033
- Figure 140: Saudi Arabia Car Loan Market Volume (Trillion), by Country 2025 & 2033
- Figure 141: Saudi Arabia Car Loan Market Revenue Share (%), by Country 2025 & 2033
- Figure 142: Saudi Arabia Car Loan Market Volume Share (%), by Country 2025 & 2033
- Figure 143: Rest of Middle East and Africa Car Loan Market Revenue (Million), by Product Type 2025 & 2033
- Figure 144: Rest of Middle East and Africa Car Loan Market Volume (Trillion), by Product Type 2025 & 2033
- Figure 145: Rest of Middle East and Africa Car Loan Market Revenue Share (%), by Product Type 2025 & 2033
- Figure 146: Rest of Middle East and Africa Car Loan Market Volume Share (%), by Product Type 2025 & 2033
- Figure 147: Rest of Middle East and Africa Car Loan Market Revenue (Million), by Ownership 2025 & 2033
- Figure 148: Rest of Middle East and Africa Car Loan Market Volume (Trillion), by Ownership 2025 & 2033
- Figure 149: Rest of Middle East and Africa Car Loan Market Revenue Share (%), by Ownership 2025 & 2033
- Figure 150: Rest of Middle East and Africa Car Loan Market Volume Share (%), by Ownership 2025 & 2033
- Figure 151: Rest of Middle East and Africa Car Loan Market Revenue (Million), by Provider Type 2025 & 2033
- Figure 152: Rest of Middle East and Africa Car Loan Market Volume (Trillion), by Provider Type 2025 & 2033
- Figure 153: Rest of Middle East and Africa Car Loan Market Revenue Share (%), by Provider Type 2025 & 2033
- Figure 154: Rest of Middle East and Africa Car Loan Market Volume Share (%), by Provider Type 2025 & 2033
- Figure 155: Rest of Middle East and Africa Car Loan Market Revenue (Million), by Tenure 2025 & 2033
- Figure 156: Rest of Middle East and Africa Car Loan Market Volume (Trillion), by Tenure 2025 & 2033
- Figure 157: Rest of Middle East and Africa Car Loan Market Revenue Share (%), by Tenure 2025 & 2033
- Figure 158: Rest of Middle East and Africa Car Loan Market Volume Share (%), by Tenure 2025 & 2033
- Figure 159: Rest of Middle East and Africa Car Loan Market Revenue (Million), by Country 2025 & 2033
- Figure 160: Rest of Middle East and Africa Car Loan Market Volume (Trillion), by Country 2025 & 2033
- Figure 161: Rest of Middle East and Africa Car Loan Market Revenue Share (%), by Country 2025 & 2033
- Figure 162: Rest of Middle East and Africa Car Loan Market Volume Share (%), by Country 2025 & 2033
List of Tables
- Table 1: Global Car Loan Market Revenue Million Forecast, by Product Type 2020 & 2033
- Table 2: Global Car Loan Market Volume Trillion Forecast, by Product Type 2020 & 2033
- Table 3: Global Car Loan Market Revenue Million Forecast, by Ownership 2020 & 2033
- Table 4: Global Car Loan Market Volume Trillion Forecast, by Ownership 2020 & 2033
- Table 5: Global Car Loan Market Revenue Million Forecast, by Provider Type 2020 & 2033
- Table 6: Global Car Loan Market Volume Trillion Forecast, by Provider Type 2020 & 2033
- Table 7: Global Car Loan Market Revenue Million Forecast, by Tenure 2020 & 2033
- Table 8: Global Car Loan Market Volume Trillion Forecast, by Tenure 2020 & 2033
- Table 9: Global Car Loan Market Revenue Million Forecast, by Region 2020 & 2033
- Table 10: Global Car Loan Market Volume Trillion Forecast, by Region 2020 & 2033
- Table 11: Global Car Loan Market Revenue Million Forecast, by Product Type 2020 & 2033
- Table 12: Global Car Loan Market Volume Trillion Forecast, by Product Type 2020 & 2033
- Table 13: Global Car Loan Market Revenue Million Forecast, by Ownership 2020 & 2033
- Table 14: Global Car Loan Market Volume Trillion Forecast, by Ownership 2020 & 2033
- Table 15: Global Car Loan Market Revenue Million Forecast, by Provider Type 2020 & 2033
- Table 16: Global Car Loan Market Volume Trillion Forecast, by Provider Type 2020 & 2033
- Table 17: Global Car Loan Market Revenue Million Forecast, by Tenure 2020 & 2033
- Table 18: Global Car Loan Market Volume Trillion Forecast, by Tenure 2020 & 2033
- Table 19: Global Car Loan Market Revenue Million Forecast, by Country 2020 & 2033
- Table 20: Global Car Loan Market Volume Trillion Forecast, by Country 2020 & 2033
- Table 21: United States Car Loan Market Revenue (Million) Forecast, by Application 2020 & 2033
- Table 22: United States Car Loan Market Volume (Trillion) Forecast, by Application 2020 & 2033
- Table 23: Canada Car Loan Market Revenue (Million) Forecast, by Application 2020 & 2033
- Table 24: Canada Car Loan Market Volume (Trillion) Forecast, by Application 2020 & 2033
- Table 25: Rest of North America Car Loan Market Revenue (Million) Forecast, by Application 2020 & 2033
- Table 26: Rest of North America Car Loan Market Volume (Trillion) Forecast, by Application 2020 & 2033
- Table 27: Global Car Loan Market Revenue Million Forecast, by Product Type 2020 & 2033
- Table 28: Global Car Loan Market Volume Trillion Forecast, by Product Type 2020 & 2033
- Table 29: Global Car Loan Market Revenue Million Forecast, by Ownership 2020 & 2033
- Table 30: Global Car Loan Market Volume Trillion Forecast, by Ownership 2020 & 2033
- Table 31: Global Car Loan Market Revenue Million Forecast, by Provider Type 2020 & 2033
- Table 32: Global Car Loan Market Volume Trillion Forecast, by Provider Type 2020 & 2033
- Table 33: Global Car Loan Market Revenue Million Forecast, by Tenure 2020 & 2033
- Table 34: Global Car Loan Market Volume Trillion Forecast, by Tenure 2020 & 2033
- Table 35: Global Car Loan Market Revenue Million Forecast, by Country 2020 & 2033
- Table 36: Global Car Loan Market Volume Trillion Forecast, by Country 2020 & 2033
- Table 37: United Kingdom Car Loan Market Revenue (Million) Forecast, by Application 2020 & 2033
- Table 38: United Kingdom Car Loan Market Volume (Trillion) Forecast, by Application 2020 & 2033
- Table 39: Germany Car Loan Market Revenue (Million) Forecast, by Application 2020 & 2033
- Table 40: Germany Car Loan Market Volume (Trillion) Forecast, by Application 2020 & 2033
- Table 41: Rest of Europe Car Loan Market Revenue (Million) Forecast, by Application 2020 & 2033
- Table 42: Rest of Europe Car Loan Market Volume (Trillion) Forecast, by Application 2020 & 2033
- Table 43: Global Car Loan Market Revenue Million Forecast, by Product Type 2020 & 2033
- Table 44: Global Car Loan Market Volume Trillion Forecast, by Product Type 2020 & 2033
- Table 45: Global Car Loan Market Revenue Million Forecast, by Ownership 2020 & 2033
- Table 46: Global Car Loan Market Volume Trillion Forecast, by Ownership 2020 & 2033
- Table 47: Global Car Loan Market Revenue Million Forecast, by Provider Type 2020 & 2033
- Table 48: Global Car Loan Market Volume Trillion Forecast, by Provider Type 2020 & 2033
- Table 49: Global Car Loan Market Revenue Million Forecast, by Tenure 2020 & 2033
- Table 50: Global Car Loan Market Volume Trillion Forecast, by Tenure 2020 & 2033
- Table 51: Global Car Loan Market Revenue Million Forecast, by Country 2020 & 2033
- Table 52: Global Car Loan Market Volume Trillion Forecast, by Country 2020 & 2033
- Table 53: China Car Loan Market Revenue (Million) Forecast, by Application 2020 & 2033
- Table 54: China Car Loan Market Volume (Trillion) Forecast, by Application 2020 & 2033
- Table 55: South Korea Car Loan Market Revenue (Million) Forecast, by Application 2020 & 2033
- Table 56: South Korea Car Loan Market Volume (Trillion) Forecast, by Application 2020 & 2033
- Table 57: Rest of Asia Pacific Car Loan Market Revenue (Million) Forecast, by Application 2020 & 2033
- Table 58: Rest of Asia Pacific Car Loan Market Volume (Trillion) Forecast, by Application 2020 & 2033
- Table 59: Global Car Loan Market Revenue Million Forecast, by Product Type 2020 & 2033
- Table 60: Global Car Loan Market Volume Trillion Forecast, by Product Type 2020 & 2033
- Table 61: Global Car Loan Market Revenue Million Forecast, by Ownership 2020 & 2033
- Table 62: Global Car Loan Market Volume Trillion Forecast, by Ownership 2020 & 2033
- Table 63: Global Car Loan Market Revenue Million Forecast, by Provider Type 2020 & 2033
- Table 64: Global Car Loan Market Volume Trillion Forecast, by Provider Type 2020 & 2033
- Table 65: Global Car Loan Market Revenue Million Forecast, by Tenure 2020 & 2033
- Table 66: Global Car Loan Market Volume Trillion Forecast, by Tenure 2020 & 2033
- Table 67: Global Car Loan Market Revenue Million Forecast, by Country 2020 & 2033
- Table 68: Global Car Loan Market Volume Trillion Forecast, by Country 2020 & 2033
- Table 69: Brazil Car Loan Market Revenue (Million) Forecast, by Application 2020 & 2033
- Table 70: Brazil Car Loan Market Volume (Trillion) Forecast, by Application 2020 & 2033
- Table 71: Chile Car Loan Market Revenue (Million) Forecast, by Application 2020 & 2033
- Table 72: Chile Car Loan Market Volume (Trillion) Forecast, by Application 2020 & 2033
- Table 73: Rest of Latin America Car Loan Market Revenue (Million) Forecast, by Application 2020 & 2033
- Table 74: Rest of Latin America Car Loan Market Volume (Trillion) Forecast, by Application 2020 & 2033
- Table 75: Global Car Loan Market Revenue Million Forecast, by Product Type 2020 & 2033
- Table 76: Global Car Loan Market Volume Trillion Forecast, by Product Type 2020 & 2033
- Table 77: Global Car Loan Market Revenue Million Forecast, by Ownership 2020 & 2033
- Table 78: Global Car Loan Market Volume Trillion Forecast, by Ownership 2020 & 2033
- Table 79: Global Car Loan Market Revenue Million Forecast, by Provider Type 2020 & 2033
- Table 80: Global Car Loan Market Volume Trillion Forecast, by Provider Type 2020 & 2033
- Table 81: Global Car Loan Market Revenue Million Forecast, by Tenure 2020 & 2033
- Table 82: Global Car Loan Market Volume Trillion Forecast, by Tenure 2020 & 2033
- Table 83: Global Car Loan Market Revenue Million Forecast, by Country 2020 & 2033
- Table 84: Global Car Loan Market Volume Trillion Forecast, by Country 2020 & 2033
- Table 85: Global Car Loan Market Revenue Million Forecast, by Product Type 2020 & 2033
- Table 86: Global Car Loan Market Volume Trillion Forecast, by Product Type 2020 & 2033
- Table 87: Global Car Loan Market Revenue Million Forecast, by Ownership 2020 & 2033
- Table 88: Global Car Loan Market Volume Trillion Forecast, by Ownership 2020 & 2033
- Table 89: Global Car Loan Market Revenue Million Forecast, by Provider Type 2020 & 2033
- Table 90: Global Car Loan Market Volume Trillion Forecast, by Provider Type 2020 & 2033
- Table 91: Global Car Loan Market Revenue Million Forecast, by Tenure 2020 & 2033
- Table 92: Global Car Loan Market Volume Trillion Forecast, by Tenure 2020 & 2033
- Table 93: Global Car Loan Market Revenue Million Forecast, by Country 2020 & 2033
- Table 94: Global Car Loan Market Volume Trillion Forecast, by Country 2020 & 2033
- Table 95: Global Car Loan Market Revenue Million Forecast, by Product Type 2020 & 2033
- Table 96: Global Car Loan Market Volume Trillion Forecast, by Product Type 2020 & 2033
- Table 97: Global Car Loan Market Revenue Million Forecast, by Ownership 2020 & 2033
- Table 98: Global Car Loan Market Volume Trillion Forecast, by Ownership 2020 & 2033
- Table 99: Global Car Loan Market Revenue Million Forecast, by Provider Type 2020 & 2033
- Table 100: Global Car Loan Market Volume Trillion Forecast, by Provider Type 2020 & 2033
- Table 101: Global Car Loan Market Revenue Million Forecast, by Tenure 2020 & 2033
- Table 102: Global Car Loan Market Volume Trillion Forecast, by Tenure 2020 & 2033
- Table 103: Global Car Loan Market Revenue Million Forecast, by Country 2020 & 2033
- Table 104: Global Car Loan Market Volume Trillion Forecast, by Country 2020 & 2033
- Table 105: Global Car Loan Market Revenue Million Forecast, by Product Type 2020 & 2033
- Table 106: Global Car Loan Market Volume Trillion Forecast, by Product Type 2020 & 2033
- Table 107: Global Car Loan Market Revenue Million Forecast, by Ownership 2020 & 2033
- Table 108: Global Car Loan Market Volume Trillion Forecast, by Ownership 2020 & 2033
- Table 109: Global Car Loan Market Revenue Million Forecast, by Provider Type 2020 & 2033
- Table 110: Global Car Loan Market Volume Trillion Forecast, by Provider Type 2020 & 2033
- Table 111: Global Car Loan Market Revenue Million Forecast, by Tenure 2020 & 2033
- Table 112: Global Car Loan Market Volume Trillion Forecast, by Tenure 2020 & 2033
- Table 113: Global Car Loan Market Revenue Million Forecast, by Country 2020 & 2033
- Table 114: Global Car Loan Market Volume Trillion Forecast, by Country 2020 & 2033
Frequently Asked Questions
1. What is the projected Compound Annual Growth Rate (CAGR) of the Car Loan Market?
The projected CAGR is approximately 3.67%.
2. Which companies are prominent players in the Car Loan Market?
Key companies in the market include Toyota Financial Services, Ford Credit, Ally Financial, Chase Auto Finance, Wells Fargo Auto, Bank of America, Capital One Auto Finance, Santander Consumer, BMW Financial Services, Honda Financial Services**List Not Exhaustive.
3. What are the main segments of the Car Loan Market?
The market segments include Product Type, Ownership, Provider Type, Tenure.
4. Can you provide details about the market size?
The market size is estimated to be USD 1.10 Million as of 2022.
5. What are some drivers contributing to market growth?
Rise in Demand for Luxury Cars Fueling the Market Growth.
6. What are the notable trends driving market growth?
Increasing Sales of Passenger Cars in Asia.
7. Are there any restraints impacting market growth?
Rise in Demand for Luxury Cars Fueling the Market Growth.
8. Can you provide examples of recent developments in the market?
May 2023: A subsidiary of Russian auto dealer Avilon, Art-Finance LLC, completed the acquisition of German automaker Volkswagen's Russian assets.
9. What pricing options are available for accessing the report?
Pricing options include single-user, multi-user, and enterprise licenses priced at USD 4750, USD 5250, and USD 8750 respectively.
10. Is the market size provided in terms of value or volume?
The market size is provided in terms of value, measured in Million and volume, measured in Trillion.
11. Are there any specific market keywords associated with the report?
Yes, the market keyword associated with the report is "Car Loan Market," which aids in identifying and referencing the specific market segment covered.
12. How do I determine which pricing option suits my needs best?
The pricing options vary based on user requirements and access needs. Individual users may opt for single-user licenses, while businesses requiring broader access may choose multi-user or enterprise licenses for cost-effective access to the report.
13. Are there any additional resources or data provided in the Car Loan Market report?
While the report offers comprehensive insights, it's advisable to review the specific contents or supplementary materials provided to ascertain if additional resources or data are available.
14. How can I stay updated on further developments or reports in the Car Loan Market?
To stay informed about further developments, trends, and reports in the Car Loan Market, consider subscribing to industry newsletters, following relevant companies and organizations, or regularly checking reputable industry news sources and publications.
Methodology
Step 1 - Identification of Relevant Samples Size from Population Database


Step 2 - Approaches for Defining Global Market Size (Value, Volume* & Price*)

Note*: In applicable scenarios
Step 3 - Data Sources
Primary Research
- Web Analytics
- Survey Reports
- Research Institute
- Latest Research Reports
- Opinion Leaders
Secondary Research
- Annual Reports
- White Paper
- Latest Press Release
- Industry Association
- Paid Database
- Investor Presentations

Step 4 - Data Triangulation
Involves using different sources of information in order to increase the validity of a study
These sources are likely to be stakeholders in a program - participants, other researchers, program staff, other community members, and so on.
Then we put all data in single framework & apply various statistical tools to find out the dynamic on the market.
During the analysis stage, feedback from the stakeholder groups would be compared to determine areas of agreement as well as areas of divergence