
Key Insights
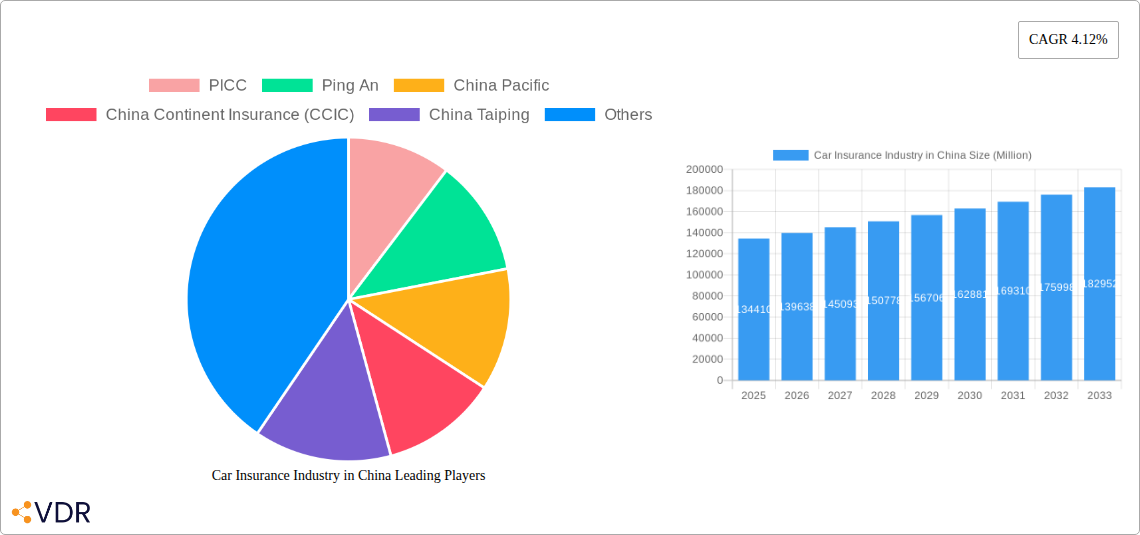
The Chinese car insurance market, valued at $134.41 billion in 2025, is projected to experience robust growth, fueled by a rapidly expanding vehicle ownership base and rising disposable incomes. A compound annual growth rate (CAGR) of 4.12% from 2025 to 2033 suggests a substantial market expansion over the forecast period. Several factors contribute to this positive outlook. The increasing urbanization and improved road infrastructure are driving higher vehicle ownership and usage. Furthermore, stricter government regulations on insurance coverage and a growing awareness of the importance of comprehensive protection are pushing market penetration. The competitive landscape is dominated by major players like PICC, Ping An, and China Pacific, alongside other significant insurers. These companies are constantly innovating with new product offerings, such as telematics-based insurance and tailored coverage plans, to cater to diverse customer needs and enhance their market position. However, challenges exist, including intense competition, fluctuating fuel prices impacting consumer spending, and the need to manage claims effectively. The market's segmentation likely includes various coverage types (comprehensive, third-party liability, etc.) and customer demographics. Future growth will be dependent on sustained economic growth, regulatory developments, and successful adaptation to changing consumer preferences and technological advancements in the insurance sector.
The long-term prospects for the Chinese car insurance market remain positive, driven by a growing middle class with increased purchasing power and the government's focus on infrastructure development. This growth trajectory is expected to attract further investment and technological innovation within the industry. Strategic partnerships and mergers and acquisitions among players are also likely to shape the market structure in the coming years. To maintain a strong position, insurers will need to prioritize customer experience, leverage data analytics for efficient risk management, and adapt to the evolving technological landscape by embracing digitalization and innovative insurance solutions. This will be crucial in navigating the competitive dynamics and capitalizing on the significant growth potential of the Chinese car insurance market.
This in-depth report provides a comprehensive analysis of the Chinese car insurance market, covering market dynamics, growth trends, key players, and future outlook. It leverages extensive data and insights to offer a complete understanding of this dynamic sector, ideal for industry professionals, investors, and strategic planners. The report covers the parent market of the Chinese Insurance Sector and the child market of Car Insurance.
Car Insurance Industry in China Market Dynamics & Structure
This section analyzes the competitive landscape, technological advancements, regulatory environment, and market trends within the Chinese car insurance industry from 2019 to 2033. The study period covers the historical period (2019-2024), the base year (2025), and the forecast period (2025-2033). The estimated year is 2025.
- Market Concentration: The Chinese car insurance market is characterized by a concentrated structure, with the top five players holding approximately xx% of the market share in 2024. This concentration is driven by the dominance of state-owned enterprises and the high barriers to entry.
- Technological Innovation: The industry is witnessing significant technological disruption, with the adoption of telematics, AI-powered risk assessment, and digital insurance platforms. However, data privacy regulations and legacy systems pose challenges to seamless innovation.
- Regulatory Framework: The Chinese government's regulatory policies play a crucial role in shaping the industry. Recent regulations have focused on promoting competition, enhancing consumer protection, and accelerating digitalization.
- Competitive Product Substitutes: The emergence of alternative risk management solutions, such as peer-to-peer insurance platforms, presents a challenge to traditional insurers. However, their market penetration remains relatively low.
- End-User Demographics: The market is driven by a rapidly growing middle class with increasing car ownership. Understanding the evolving needs and preferences of this demographic is key to market success.
- M&A Trends: The past five years have seen xx M&A deals in the Chinese car insurance sector, driven primarily by consolidation efforts and expansion strategies among key players.
Car Insurance Industry in China Growth Trends & Insights
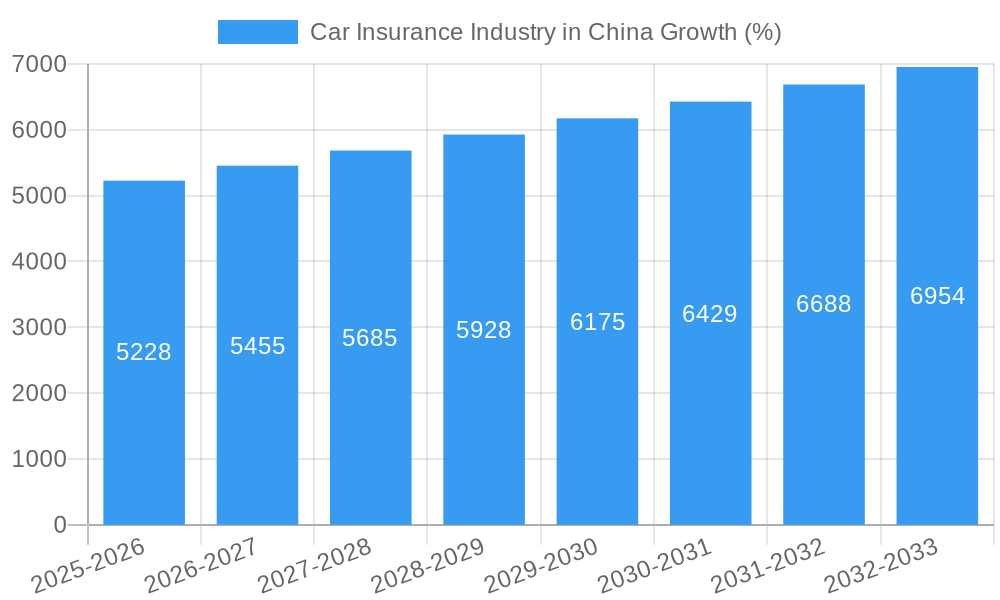
This section delves into the growth trajectory of the Chinese car insurance market, analyzing market size evolution, adoption rates, technological disruptions, and evolving consumer behavior. The analysis incorporates a detailed examination of key performance indicators (KPIs) such as Compound Annual Growth Rate (CAGR) and market penetration rates. The market size is projected to reach xx Million units by 2033, exhibiting a CAGR of xx% during the forecast period.
(Detailed 600-word analysis would be included here using XXX data and insights. This would include specific data points on market size, CAGR, penetration rates, and consumer behavior shifts, supported by charts and graphs.)
Dominant Regions, Countries, or Segments in Car Insurance Industry in China
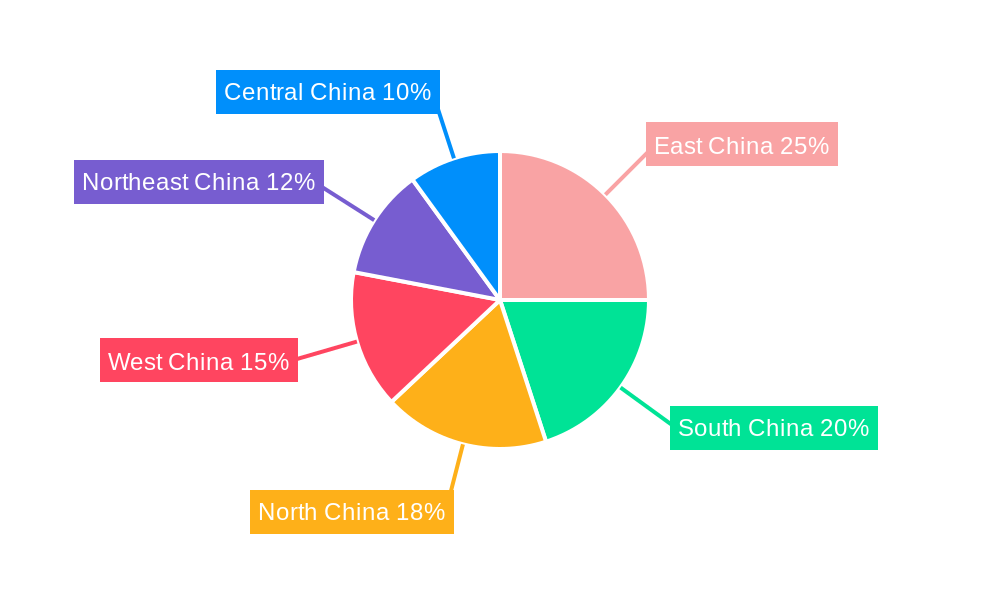
This section identifies the leading regions and segments driving market growth within China's car insurance sector. The analysis focuses on the factors contributing to regional dominance, encompassing economic policies, infrastructure development, and market share dynamics.
- Key Drivers:
- Rapid Urbanization: The continuous migration to urban areas fuels increased car ownership and demand for insurance.
- Government Initiatives: Supportive government policies and infrastructure investments contribute significantly to market expansion.
- Rising Disposable Incomes: Increased disposable incomes among the middle class lead to greater affordability of cars and insurance.
- Improved Road Networks: Investment in better road infrastructure encourages more people to own and drive vehicles.
(Detailed 600-word analysis of regional and segment dominance would follow, incorporating market share data and growth projections.)
Car Insurance Industry in China Product Landscape
The Chinese car insurance market offers a diverse range of products, including traditional comprehensive coverage, third-party liability insurance, and specialized policies for electric vehicles. Recent innovations include usage-based insurance (UBI) programs leveraging telematics data to personalize premiums and bundled insurance products combining various coverage options. These innovations aim to enhance customer value and respond to the changing needs of consumers.
Key Drivers, Barriers & Challenges in Car Insurance Industry in China
Key Drivers:
- Increasing car ownership.
- Growing middle class with higher disposable income.
- Government support for the automotive industry.
- Technological advancements in insurance.
Key Challenges:
- Intense competition among established players.
- Stringent regulatory environment.
- Fraudulent claims.
- Data security and privacy concerns.
Emerging Opportunities in Car Insurance Industry in China
Emerging opportunities include the expansion of UBI, the development of tailored insurance products for electric vehicles and autonomous driving technology, and the growth of online and mobile insurance platforms. Untapped markets in rural areas also represent significant potential for growth.
Growth Accelerators in the Car Insurance Industry in China Industry
Long-term growth will be driven by continued technological innovation, strategic partnerships such as that between XPeng Motors and major insurers, and expansion into underserved markets. Government initiatives promoting financial inclusion and digitalization will also play a crucial role.
Key Players Shaping the Car Insurance Industry in China Market
- PICC
- Ping An
- China Pacific
- China Continent Insurance (CCIC)
- China Taiping
- Axa Tianping
- China United Property Insurance
- Samsung Property Insurance
- Huatai Property Insurance
- Bohai Property Insurance
- List Not Exhaustive
Notable Milestones in Car Insurance Industry in China Sector
- June 2022: Launch of the first car insurance policies using digital renminbi.
- May 2023: XPENG Motors partners with eight major insurance companies to launch innovative insurance products.
In-Depth Car Insurance Industry in China Market Outlook
The Chinese car insurance market is poised for significant growth over the next decade, driven by a combination of factors including rising car ownership, technological advancements, and supportive government policies. Strategic opportunities exist for both established players and new entrants to capitalize on market expansion and evolving consumer needs. The focus on digitalization and innovative product offerings will be key to success in this dynamic and competitive market.
Car Insurance Industry in China Segmentation
-
1. Insurance Type
- 1.1. Compulsory Auto Liability Insurance
- 1.2. Commercial Auto Insurance
-
2. Distribution Channel
- 2.1. Direct
- 2.2. Agent
- 2.3. Online
- 2.4. Others
Car Insurance Industry in China Segmentation By Geography
-
1. North America
- 1.1. United States
- 1.2. Canada
- 1.3. Mexico
-
2. South America
- 2.1. Brazil
- 2.2. Argentina
- 2.3. Rest of South America
-
3. Europe
- 3.1. United Kingdom
- 3.2. Germany
- 3.3. France
- 3.4. Italy
- 3.5. Spain
- 3.6. Russia
- 3.7. Benelux
- 3.8. Nordics
- 3.9. Rest of Europe
-
4. Middle East & Africa
- 4.1. Turkey
- 4.2. Israel
- 4.3. GCC
- 4.4. North Africa
- 4.5. South Africa
- 4.6. Rest of Middle East & Africa
-
5. Asia Pacific
- 5.1. China
- 5.2. India
- 5.3. Japan
- 5.4. South Korea
- 5.5. ASEAN
- 5.6. Oceania
- 5.7. Rest of Asia Pacific
Car Insurance Industry in China REPORT HIGHLIGHTS
| Aspects | Details |
|---|---|
| Study Period | 2019-2033 |
| Base Year | 2024 |
| Estimated Year | 2025 |
| Forecast Period | 2025-2033 |
| Historical Period | 2019-2024 |
| Growth Rate | CAGR of 4.12% from 2019-2033 |
| Segmentation |
|
Table of Contents
- 1. Introduction
- 1.1. Research Scope
- 1.2. Market Segmentation
- 1.3. Research Methodology
- 1.4. Definitions and Assumptions
- 2. Executive Summary
- 2.1. Introduction
- 3. Market Dynamics
- 3.1. Introduction
- 3.2. Market Drivers
- 3.2.1. Increase in Internet Penetration and Online Sales
- 3.3. Market Restrains
- 3.3.1. Increase in Internet Penetration and Online Sales
- 3.4. Market Trends
- 3.4.1. Recovery in Vehicle Sales is Driving Motor Insurance Market
- 4. Market Factor Analysis
- 4.1. Porters Five Forces
- 4.2. Supply/Value Chain
- 4.3. PESTEL analysis
- 4.4. Market Entropy
- 4.5. Patent/Trademark Analysis
- 5. Global Car Insurance Industry in China Analysis, Insights and Forecast, 2019-2031
- 5.1. Market Analysis, Insights and Forecast - by Insurance Type
- 5.1.1. Compulsory Auto Liability Insurance
- 5.1.2. Commercial Auto Insurance
- 5.2. Market Analysis, Insights and Forecast - by Distribution Channel
- 5.2.1. Direct
- 5.2.2. Agent
- 5.2.3. Online
- 5.2.4. Others
- 5.3. Market Analysis, Insights and Forecast - by Region
- 5.3.1. North America
- 5.3.2. South America
- 5.3.3. Europe
- 5.3.4. Middle East & Africa
- 5.3.5. Asia Pacific
- 5.1. Market Analysis, Insights and Forecast - by Insurance Type
- 6. North America Car Insurance Industry in China Analysis, Insights and Forecast, 2019-2031
- 6.1. Market Analysis, Insights and Forecast - by Insurance Type
- 6.1.1. Compulsory Auto Liability Insurance
- 6.1.2. Commercial Auto Insurance
- 6.2. Market Analysis, Insights and Forecast - by Distribution Channel
- 6.2.1. Direct
- 6.2.2. Agent
- 6.2.3. Online
- 6.2.4. Others
- 6.1. Market Analysis, Insights and Forecast - by Insurance Type
- 7. South America Car Insurance Industry in China Analysis, Insights and Forecast, 2019-2031
- 7.1. Market Analysis, Insights and Forecast - by Insurance Type
- 7.1.1. Compulsory Auto Liability Insurance
- 7.1.2. Commercial Auto Insurance
- 7.2. Market Analysis, Insights and Forecast - by Distribution Channel
- 7.2.1. Direct
- 7.2.2. Agent
- 7.2.3. Online
- 7.2.4. Others
- 7.1. Market Analysis, Insights and Forecast - by Insurance Type
- 8. Europe Car Insurance Industry in China Analysis, Insights and Forecast, 2019-2031
- 8.1. Market Analysis, Insights and Forecast - by Insurance Type
- 8.1.1. Compulsory Auto Liability Insurance
- 8.1.2. Commercial Auto Insurance
- 8.2. Market Analysis, Insights and Forecast - by Distribution Channel
- 8.2.1. Direct
- 8.2.2. Agent
- 8.2.3. Online
- 8.2.4. Others
- 8.1. Market Analysis, Insights and Forecast - by Insurance Type
- 9. Middle East & Africa Car Insurance Industry in China Analysis, Insights and Forecast, 2019-2031
- 9.1. Market Analysis, Insights and Forecast - by Insurance Type
- 9.1.1. Compulsory Auto Liability Insurance
- 9.1.2. Commercial Auto Insurance
- 9.2. Market Analysis, Insights and Forecast - by Distribution Channel
- 9.2.1. Direct
- 9.2.2. Agent
- 9.2.3. Online
- 9.2.4. Others
- 9.1. Market Analysis, Insights and Forecast - by Insurance Type
- 10. Asia Pacific Car Insurance Industry in China Analysis, Insights and Forecast, 2019-2031
- 10.1. Market Analysis, Insights and Forecast - by Insurance Type
- 10.1.1. Compulsory Auto Liability Insurance
- 10.1.2. Commercial Auto Insurance
- 10.2. Market Analysis, Insights and Forecast - by Distribution Channel
- 10.2.1. Direct
- 10.2.2. Agent
- 10.2.3. Online
- 10.2.4. Others
- 10.1. Market Analysis, Insights and Forecast - by Insurance Type
- 11. Competitive Analysis
- 11.1. Global Market Share Analysis 2024
- 11.2. Company Profiles
- 11.2.1 PICC
- 11.2.1.1. Overview
- 11.2.1.2. Products
- 11.2.1.3. SWOT Analysis
- 11.2.1.4. Recent Developments
- 11.2.1.5. Financials (Based on Availability)
- 11.2.2 Ping An
- 11.2.2.1. Overview
- 11.2.2.2. Products
- 11.2.2.3. SWOT Analysis
- 11.2.2.4. Recent Developments
- 11.2.2.5. Financials (Based on Availability)
- 11.2.3 China Pacific
- 11.2.3.1. Overview
- 11.2.3.2. Products
- 11.2.3.3. SWOT Analysis
- 11.2.3.4. Recent Developments
- 11.2.3.5. Financials (Based on Availability)
- 11.2.4 China Continent Insurance (CCIC)
- 11.2.4.1. Overview
- 11.2.4.2. Products
- 11.2.4.3. SWOT Analysis
- 11.2.4.4. Recent Developments
- 11.2.4.5. Financials (Based on Availability)
- 11.2.5 China Taiping
- 11.2.5.1. Overview
- 11.2.5.2. Products
- 11.2.5.3. SWOT Analysis
- 11.2.5.4. Recent Developments
- 11.2.5.5. Financials (Based on Availability)
- 11.2.6 Axa Tianping
- 11.2.6.1. Overview
- 11.2.6.2. Products
- 11.2.6.3. SWOT Analysis
- 11.2.6.4. Recent Developments
- 11.2.6.5. Financials (Based on Availability)
- 11.2.7 China United Property Insurance
- 11.2.7.1. Overview
- 11.2.7.2. Products
- 11.2.7.3. SWOT Analysis
- 11.2.7.4. Recent Developments
- 11.2.7.5. Financials (Based on Availability)
- 11.2.8 Samsung Property Insurance
- 11.2.8.1. Overview
- 11.2.8.2. Products
- 11.2.8.3. SWOT Analysis
- 11.2.8.4. Recent Developments
- 11.2.8.5. Financials (Based on Availability)
- 11.2.9 Huatai Property Insurance
- 11.2.9.1. Overview
- 11.2.9.2. Products
- 11.2.9.3. SWOT Analysis
- 11.2.9.4. Recent Developments
- 11.2.9.5. Financials (Based on Availability)
- 11.2.10 Bohai Property Insurance **List Not Exhaustive
- 11.2.10.1. Overview
- 11.2.10.2. Products
- 11.2.10.3. SWOT Analysis
- 11.2.10.4. Recent Developments
- 11.2.10.5. Financials (Based on Availability)
- 11.2.1 PICC
List of Figures
- Figure 1: Global Car Insurance Industry in China Revenue Breakdown (Million, %) by Region 2024 & 2032
- Figure 2: Global Car Insurance Industry in China Volume Breakdown (Billion, %) by Region 2024 & 2032
- Figure 3: North America Car Insurance Industry in China Revenue (Million), by Insurance Type 2024 & 2032
- Figure 4: North America Car Insurance Industry in China Volume (Billion), by Insurance Type 2024 & 2032
- Figure 5: North America Car Insurance Industry in China Revenue Share (%), by Insurance Type 2024 & 2032
- Figure 6: North America Car Insurance Industry in China Volume Share (%), by Insurance Type 2024 & 2032
- Figure 7: North America Car Insurance Industry in China Revenue (Million), by Distribution Channel 2024 & 2032
- Figure 8: North America Car Insurance Industry in China Volume (Billion), by Distribution Channel 2024 & 2032
- Figure 9: North America Car Insurance Industry in China Revenue Share (%), by Distribution Channel 2024 & 2032
- Figure 10: North America Car Insurance Industry in China Volume Share (%), by Distribution Channel 2024 & 2032
- Figure 11: North America Car Insurance Industry in China Revenue (Million), by Country 2024 & 2032
- Figure 12: North America Car Insurance Industry in China Volume (Billion), by Country 2024 & 2032
- Figure 13: North America Car Insurance Industry in China Revenue Share (%), by Country 2024 & 2032
- Figure 14: North America Car Insurance Industry in China Volume Share (%), by Country 2024 & 2032
- Figure 15: South America Car Insurance Industry in China Revenue (Million), by Insurance Type 2024 & 2032
- Figure 16: South America Car Insurance Industry in China Volume (Billion), by Insurance Type 2024 & 2032
- Figure 17: South America Car Insurance Industry in China Revenue Share (%), by Insurance Type 2024 & 2032
- Figure 18: South America Car Insurance Industry in China Volume Share (%), by Insurance Type 2024 & 2032
- Figure 19: South America Car Insurance Industry in China Revenue (Million), by Distribution Channel 2024 & 2032
- Figure 20: South America Car Insurance Industry in China Volume (Billion), by Distribution Channel 2024 & 2032
- Figure 21: South America Car Insurance Industry in China Revenue Share (%), by Distribution Channel 2024 & 2032
- Figure 22: South America Car Insurance Industry in China Volume Share (%), by Distribution Channel 2024 & 2032
- Figure 23: South America Car Insurance Industry in China Revenue (Million), by Country 2024 & 2032
- Figure 24: South America Car Insurance Industry in China Volume (Billion), by Country 2024 & 2032
- Figure 25: South America Car Insurance Industry in China Revenue Share (%), by Country 2024 & 2032
- Figure 26: South America Car Insurance Industry in China Volume Share (%), by Country 2024 & 2032
- Figure 27: Europe Car Insurance Industry in China Revenue (Million), by Insurance Type 2024 & 2032
- Figure 28: Europe Car Insurance Industry in China Volume (Billion), by Insurance Type 2024 & 2032
- Figure 29: Europe Car Insurance Industry in China Revenue Share (%), by Insurance Type 2024 & 2032
- Figure 30: Europe Car Insurance Industry in China Volume Share (%), by Insurance Type 2024 & 2032
- Figure 31: Europe Car Insurance Industry in China Revenue (Million), by Distribution Channel 2024 & 2032
- Figure 32: Europe Car Insurance Industry in China Volume (Billion), by Distribution Channel 2024 & 2032
- Figure 33: Europe Car Insurance Industry in China Revenue Share (%), by Distribution Channel 2024 & 2032
- Figure 34: Europe Car Insurance Industry in China Volume Share (%), by Distribution Channel 2024 & 2032
- Figure 35: Europe Car Insurance Industry in China Revenue (Million), by Country 2024 & 2032
- Figure 36: Europe Car Insurance Industry in China Volume (Billion), by Country 2024 & 2032
- Figure 37: Europe Car Insurance Industry in China Revenue Share (%), by Country 2024 & 2032
- Figure 38: Europe Car Insurance Industry in China Volume Share (%), by Country 2024 & 2032
- Figure 39: Middle East & Africa Car Insurance Industry in China Revenue (Million), by Insurance Type 2024 & 2032
- Figure 40: Middle East & Africa Car Insurance Industry in China Volume (Billion), by Insurance Type 2024 & 2032
- Figure 41: Middle East & Africa Car Insurance Industry in China Revenue Share (%), by Insurance Type 2024 & 2032
- Figure 42: Middle East & Africa Car Insurance Industry in China Volume Share (%), by Insurance Type 2024 & 2032
- Figure 43: Middle East & Africa Car Insurance Industry in China Revenue (Million), by Distribution Channel 2024 & 2032
- Figure 44: Middle East & Africa Car Insurance Industry in China Volume (Billion), by Distribution Channel 2024 & 2032
- Figure 45: Middle East & Africa Car Insurance Industry in China Revenue Share (%), by Distribution Channel 2024 & 2032
- Figure 46: Middle East & Africa Car Insurance Industry in China Volume Share (%), by Distribution Channel 2024 & 2032
- Figure 47: Middle East & Africa Car Insurance Industry in China Revenue (Million), by Country 2024 & 2032
- Figure 48: Middle East & Africa Car Insurance Industry in China Volume (Billion), by Country 2024 & 2032
- Figure 49: Middle East & Africa Car Insurance Industry in China Revenue Share (%), by Country 2024 & 2032
- Figure 50: Middle East & Africa Car Insurance Industry in China Volume Share (%), by Country 2024 & 2032
- Figure 51: Asia Pacific Car Insurance Industry in China Revenue (Million), by Insurance Type 2024 & 2032
- Figure 52: Asia Pacific Car Insurance Industry in China Volume (Billion), by Insurance Type 2024 & 2032
- Figure 53: Asia Pacific Car Insurance Industry in China Revenue Share (%), by Insurance Type 2024 & 2032
- Figure 54: Asia Pacific Car Insurance Industry in China Volume Share (%), by Insurance Type 2024 & 2032
- Figure 55: Asia Pacific Car Insurance Industry in China Revenue (Million), by Distribution Channel 2024 & 2032
- Figure 56: Asia Pacific Car Insurance Industry in China Volume (Billion), by Distribution Channel 2024 & 2032
- Figure 57: Asia Pacific Car Insurance Industry in China Revenue Share (%), by Distribution Channel 2024 & 2032
- Figure 58: Asia Pacific Car Insurance Industry in China Volume Share (%), by Distribution Channel 2024 & 2032
- Figure 59: Asia Pacific Car Insurance Industry in China Revenue (Million), by Country 2024 & 2032
- Figure 60: Asia Pacific Car Insurance Industry in China Volume (Billion), by Country 2024 & 2032
- Figure 61: Asia Pacific Car Insurance Industry in China Revenue Share (%), by Country 2024 & 2032
- Figure 62: Asia Pacific Car Insurance Industry in China Volume Share (%), by Country 2024 & 2032
List of Tables
- Table 1: Global Car Insurance Industry in China Revenue Million Forecast, by Region 2019 & 2032
- Table 2: Global Car Insurance Industry in China Volume Billion Forecast, by Region 2019 & 2032
- Table 3: Global Car Insurance Industry in China Revenue Million Forecast, by Insurance Type 2019 & 2032
- Table 4: Global Car Insurance Industry in China Volume Billion Forecast, by Insurance Type 2019 & 2032
- Table 5: Global Car Insurance Industry in China Revenue Million Forecast, by Distribution Channel 2019 & 2032
- Table 6: Global Car Insurance Industry in China Volume Billion Forecast, by Distribution Channel 2019 & 2032
- Table 7: Global Car Insurance Industry in China Revenue Million Forecast, by Region 2019 & 2032
- Table 8: Global Car Insurance Industry in China Volume Billion Forecast, by Region 2019 & 2032
- Table 9: Global Car Insurance Industry in China Revenue Million Forecast, by Insurance Type 2019 & 2032
- Table 10: Global Car Insurance Industry in China Volume Billion Forecast, by Insurance Type 2019 & 2032
- Table 11: Global Car Insurance Industry in China Revenue Million Forecast, by Distribution Channel 2019 & 2032
- Table 12: Global Car Insurance Industry in China Volume Billion Forecast, by Distribution Channel 2019 & 2032
- Table 13: Global Car Insurance Industry in China Revenue Million Forecast, by Country 2019 & 2032
- Table 14: Global Car Insurance Industry in China Volume Billion Forecast, by Country 2019 & 2032
- Table 15: United States Car Insurance Industry in China Revenue (Million) Forecast, by Application 2019 & 2032
- Table 16: United States Car Insurance Industry in China Volume (Billion) Forecast, by Application 2019 & 2032
- Table 17: Canada Car Insurance Industry in China Revenue (Million) Forecast, by Application 2019 & 2032
- Table 18: Canada Car Insurance Industry in China Volume (Billion) Forecast, by Application 2019 & 2032
- Table 19: Mexico Car Insurance Industry in China Revenue (Million) Forecast, by Application 2019 & 2032
- Table 20: Mexico Car Insurance Industry in China Volume (Billion) Forecast, by Application 2019 & 2032
- Table 21: Global Car Insurance Industry in China Revenue Million Forecast, by Insurance Type 2019 & 2032
- Table 22: Global Car Insurance Industry in China Volume Billion Forecast, by Insurance Type 2019 & 2032
- Table 23: Global Car Insurance Industry in China Revenue Million Forecast, by Distribution Channel 2019 & 2032
- Table 24: Global Car Insurance Industry in China Volume Billion Forecast, by Distribution Channel 2019 & 2032
- Table 25: Global Car Insurance Industry in China Revenue Million Forecast, by Country 2019 & 2032
- Table 26: Global Car Insurance Industry in China Volume Billion Forecast, by Country 2019 & 2032
- Table 27: Brazil Car Insurance Industry in China Revenue (Million) Forecast, by Application 2019 & 2032
- Table 28: Brazil Car Insurance Industry in China Volume (Billion) Forecast, by Application 2019 & 2032
- Table 29: Argentina Car Insurance Industry in China Revenue (Million) Forecast, by Application 2019 & 2032
- Table 30: Argentina Car Insurance Industry in China Volume (Billion) Forecast, by Application 2019 & 2032
- Table 31: Rest of South America Car Insurance Industry in China Revenue (Million) Forecast, by Application 2019 & 2032
- Table 32: Rest of South America Car Insurance Industry in China Volume (Billion) Forecast, by Application 2019 & 2032
- Table 33: Global Car Insurance Industry in China Revenue Million Forecast, by Insurance Type 2019 & 2032
- Table 34: Global Car Insurance Industry in China Volume Billion Forecast, by Insurance Type 2019 & 2032
- Table 35: Global Car Insurance Industry in China Revenue Million Forecast, by Distribution Channel 2019 & 2032
- Table 36: Global Car Insurance Industry in China Volume Billion Forecast, by Distribution Channel 2019 & 2032
- Table 37: Global Car Insurance Industry in China Revenue Million Forecast, by Country 2019 & 2032
- Table 38: Global Car Insurance Industry in China Volume Billion Forecast, by Country 2019 & 2032
- Table 39: United Kingdom Car Insurance Industry in China Revenue (Million) Forecast, by Application 2019 & 2032
- Table 40: United Kingdom Car Insurance Industry in China Volume (Billion) Forecast, by Application 2019 & 2032
- Table 41: Germany Car Insurance Industry in China Revenue (Million) Forecast, by Application 2019 & 2032
- Table 42: Germany Car Insurance Industry in China Volume (Billion) Forecast, by Application 2019 & 2032
- Table 43: France Car Insurance Industry in China Revenue (Million) Forecast, by Application 2019 & 2032
- Table 44: France Car Insurance Industry in China Volume (Billion) Forecast, by Application 2019 & 2032
- Table 45: Italy Car Insurance Industry in China Revenue (Million) Forecast, by Application 2019 & 2032
- Table 46: Italy Car Insurance Industry in China Volume (Billion) Forecast, by Application 2019 & 2032
- Table 47: Spain Car Insurance Industry in China Revenue (Million) Forecast, by Application 2019 & 2032
- Table 48: Spain Car Insurance Industry in China Volume (Billion) Forecast, by Application 2019 & 2032
- Table 49: Russia Car Insurance Industry in China Revenue (Million) Forecast, by Application 2019 & 2032
- Table 50: Russia Car Insurance Industry in China Volume (Billion) Forecast, by Application 2019 & 2032
- Table 51: Benelux Car Insurance Industry in China Revenue (Million) Forecast, by Application 2019 & 2032
- Table 52: Benelux Car Insurance Industry in China Volume (Billion) Forecast, by Application 2019 & 2032
- Table 53: Nordics Car Insurance Industry in China Revenue (Million) Forecast, by Application 2019 & 2032
- Table 54: Nordics Car Insurance Industry in China Volume (Billion) Forecast, by Application 2019 & 2032
- Table 55: Rest of Europe Car Insurance Industry in China Revenue (Million) Forecast, by Application 2019 & 2032
- Table 56: Rest of Europe Car Insurance Industry in China Volume (Billion) Forecast, by Application 2019 & 2032
- Table 57: Global Car Insurance Industry in China Revenue Million Forecast, by Insurance Type 2019 & 2032
- Table 58: Global Car Insurance Industry in China Volume Billion Forecast, by Insurance Type 2019 & 2032
- Table 59: Global Car Insurance Industry in China Revenue Million Forecast, by Distribution Channel 2019 & 2032
- Table 60: Global Car Insurance Industry in China Volume Billion Forecast, by Distribution Channel 2019 & 2032
- Table 61: Global Car Insurance Industry in China Revenue Million Forecast, by Country 2019 & 2032
- Table 62: Global Car Insurance Industry in China Volume Billion Forecast, by Country 2019 & 2032
- Table 63: Turkey Car Insurance Industry in China Revenue (Million) Forecast, by Application 2019 & 2032
- Table 64: Turkey Car Insurance Industry in China Volume (Billion) Forecast, by Application 2019 & 2032
- Table 65: Israel Car Insurance Industry in China Revenue (Million) Forecast, by Application 2019 & 2032
- Table 66: Israel Car Insurance Industry in China Volume (Billion) Forecast, by Application 2019 & 2032
- Table 67: GCC Car Insurance Industry in China Revenue (Million) Forecast, by Application 2019 & 2032
- Table 68: GCC Car Insurance Industry in China Volume (Billion) Forecast, by Application 2019 & 2032
- Table 69: North Africa Car Insurance Industry in China Revenue (Million) Forecast, by Application 2019 & 2032
- Table 70: North Africa Car Insurance Industry in China Volume (Billion) Forecast, by Application 2019 & 2032
- Table 71: South Africa Car Insurance Industry in China Revenue (Million) Forecast, by Application 2019 & 2032
- Table 72: South Africa Car Insurance Industry in China Volume (Billion) Forecast, by Application 2019 & 2032
- Table 73: Rest of Middle East & Africa Car Insurance Industry in China Revenue (Million) Forecast, by Application 2019 & 2032
- Table 74: Rest of Middle East & Africa Car Insurance Industry in China Volume (Billion) Forecast, by Application 2019 & 2032
- Table 75: Global Car Insurance Industry in China Revenue Million Forecast, by Insurance Type 2019 & 2032
- Table 76: Global Car Insurance Industry in China Volume Billion Forecast, by Insurance Type 2019 & 2032
- Table 77: Global Car Insurance Industry in China Revenue Million Forecast, by Distribution Channel 2019 & 2032
- Table 78: Global Car Insurance Industry in China Volume Billion Forecast, by Distribution Channel 2019 & 2032
- Table 79: Global Car Insurance Industry in China Revenue Million Forecast, by Country 2019 & 2032
- Table 80: Global Car Insurance Industry in China Volume Billion Forecast, by Country 2019 & 2032
- Table 81: China Car Insurance Industry in China Revenue (Million) Forecast, by Application 2019 & 2032
- Table 82: China Car Insurance Industry in China Volume (Billion) Forecast, by Application 2019 & 2032
- Table 83: India Car Insurance Industry in China Revenue (Million) Forecast, by Application 2019 & 2032
- Table 84: India Car Insurance Industry in China Volume (Billion) Forecast, by Application 2019 & 2032
- Table 85: Japan Car Insurance Industry in China Revenue (Million) Forecast, by Application 2019 & 2032
- Table 86: Japan Car Insurance Industry in China Volume (Billion) Forecast, by Application 2019 & 2032
- Table 87: South Korea Car Insurance Industry in China Revenue (Million) Forecast, by Application 2019 & 2032
- Table 88: South Korea Car Insurance Industry in China Volume (Billion) Forecast, by Application 2019 & 2032
- Table 89: ASEAN Car Insurance Industry in China Revenue (Million) Forecast, by Application 2019 & 2032
- Table 90: ASEAN Car Insurance Industry in China Volume (Billion) Forecast, by Application 2019 & 2032
- Table 91: Oceania Car Insurance Industry in China Revenue (Million) Forecast, by Application 2019 & 2032
- Table 92: Oceania Car Insurance Industry in China Volume (Billion) Forecast, by Application 2019 & 2032
- Table 93: Rest of Asia Pacific Car Insurance Industry in China Revenue (Million) Forecast, by Application 2019 & 2032
- Table 94: Rest of Asia Pacific Car Insurance Industry in China Volume (Billion) Forecast, by Application 2019 & 2032
Frequently Asked Questions
1. What is the projected Compound Annual Growth Rate (CAGR) of the Car Insurance Industry in China?
The projected CAGR is approximately 4.12%.
2. Which companies are prominent players in the Car Insurance Industry in China?
Key companies in the market include PICC, Ping An, China Pacific, China Continent Insurance (CCIC), China Taiping, Axa Tianping, China United Property Insurance, Samsung Property Insurance, Huatai Property Insurance, Bohai Property Insurance **List Not Exhaustive.
3. What are the main segments of the Car Insurance Industry in China?
The market segments include Insurance Type, Distribution Channel.
4. Can you provide details about the market size?
The market size is estimated to be USD 134.41 Million as of 2022.
5. What are some drivers contributing to market growth?
Increase in Internet Penetration and Online Sales.
6. What are the notable trends driving market growth?
Recovery in Vehicle Sales is Driving Motor Insurance Market.
7. Are there any restraints impacting market growth?
Increase in Internet Penetration and Online Sales.
8. Can you provide examples of recent developments in the market?
May 2023: XPENG Motors, a prominent Chinese intelligent electric vehicle company, announced strategic partnerships with eight top insurance companies in China. The collaboration aims to introduce a revolutionary, innovative insurance service program and related products, offering enhanced insurance coverage for car owners.
9. What pricing options are available for accessing the report?
Pricing options include single-user, multi-user, and enterprise licenses priced at USD 3800, USD 4500, and USD 5800 respectively.
10. Is the market size provided in terms of value or volume?
The market size is provided in terms of value, measured in Million and volume, measured in Billion.
11. Are there any specific market keywords associated with the report?
Yes, the market keyword associated with the report is "Car Insurance Industry in China," which aids in identifying and referencing the specific market segment covered.
12. How do I determine which pricing option suits my needs best?
The pricing options vary based on user requirements and access needs. Individual users may opt for single-user licenses, while businesses requiring broader access may choose multi-user or enterprise licenses for cost-effective access to the report.
13. Are there any additional resources or data provided in the Car Insurance Industry in China report?
While the report offers comprehensive insights, it's advisable to review the specific contents or supplementary materials provided to ascertain if additional resources or data are available.
14. How can I stay updated on further developments or reports in the Car Insurance Industry in China?
To stay informed about further developments, trends, and reports in the Car Insurance Industry in China, consider subscribing to industry newsletters, following relevant companies and organizations, or regularly checking reputable industry news sources and publications.
Methodology
Step 1 - Identification of Relevant Samples Size from Population Database


Step 2 - Approaches for Defining Global Market Size (Value, Volume* & Price*)

Note*: In applicable scenarios
Step 3 - Data Sources
Primary Research
- Web Analytics
- Survey Reports
- Research Institute
- Latest Research Reports
- Opinion Leaders
Secondary Research
- Annual Reports
- White Paper
- Latest Press Release
- Industry Association
- Paid Database
- Investor Presentations

Step 4 - Data Triangulation
Involves using different sources of information in order to increase the validity of a study
These sources are likely to be stakeholders in a program - participants, other researchers, program staff, other community members, and so on.
Then we put all data in single framework & apply various statistical tools to find out the dynamic on the market.
During the analysis stage, feedback from the stakeholder groups would be compared to determine areas of agreement as well as areas of divergence


