

Key Insights
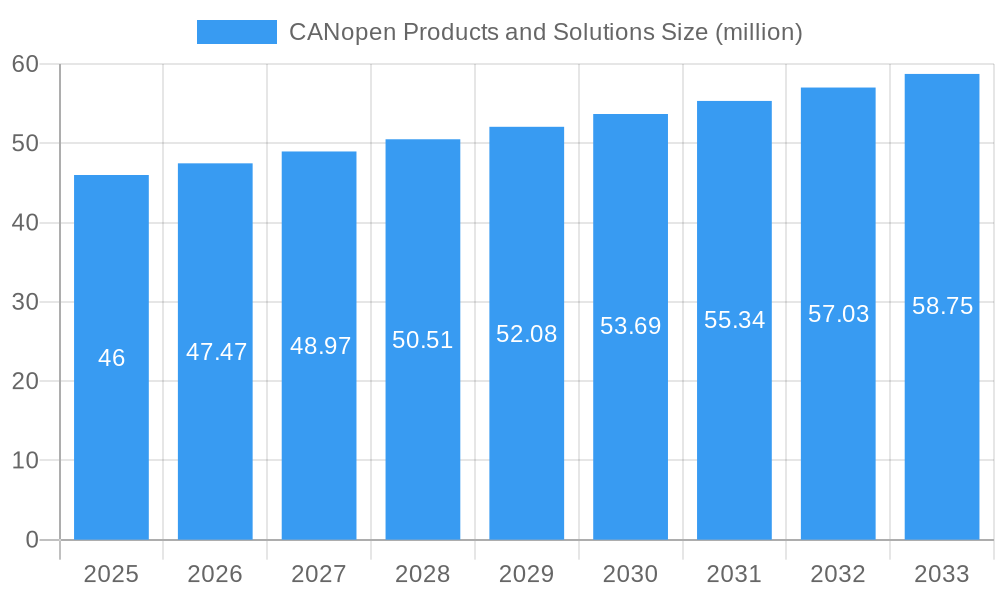
The global CANopen Products and Solutions market is projected to reach $46 million by 2025, exhibiting a steady Compound Annual Growth Rate (CAGR) of 3.2% throughout the forecast period of 2025-2033. This sustained growth is primarily driven by the increasing adoption of CANopen in critical sectors like automotive, industrial automation, and the medical industry, where its reliability, flexibility, and efficiency are paramount for seamless device communication and control. The automotive sector, in particular, continues to be a significant contributor, leveraging CANopen for in-vehicle networking, advanced driver-assistance systems (ADAS), and infotainment solutions. Industrial automation further fuels demand with the proliferation of smart factories and Industry 4.0 initiatives, requiring robust and standardized communication protocols for interconnected machinery and systems. The medical field's growing reliance on connected medical devices and sophisticated diagnostic equipment also presents a substantial growth avenue for CANopen solutions.
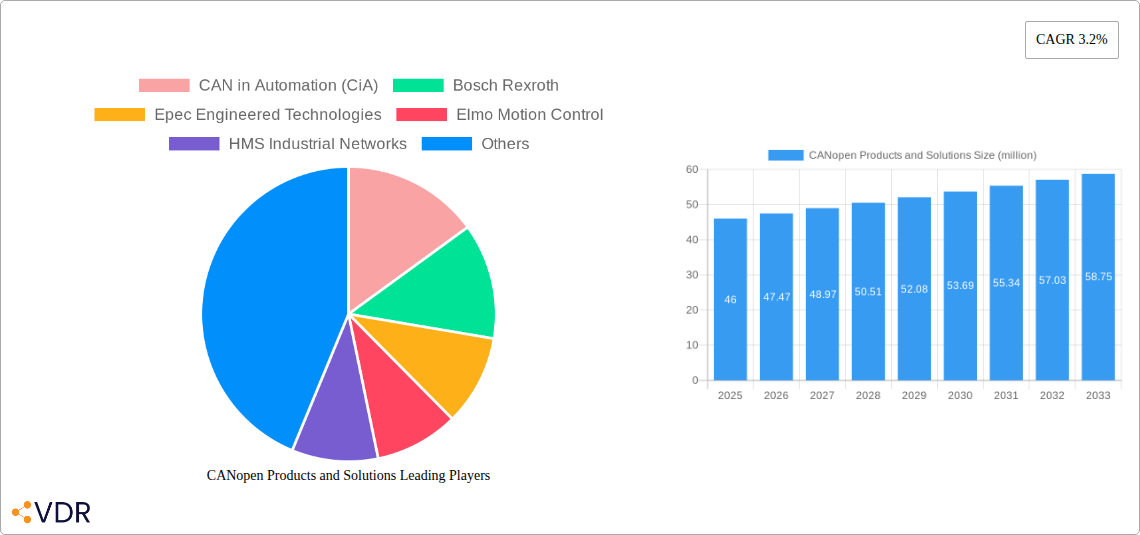
CANopen Products and Solutions Market Size (In Million)
Emerging trends such as the integration of CANopen with higher-level communication protocols, the development of specialized CANopen hardware and software for niche applications, and the increasing focus on cybersecurity within industrial networks are shaping the market landscape. While the market demonstrates robust growth, certain restraints, such as the perceived complexity of implementation for less experienced users and competition from alternative industrial communication protocols, may pose challenges. However, the continuous innovation by key players like Bosch Rexroth, Schneider Electric, and Kvaser, focusing on enhancing interoperability, simplifying integration, and offering comprehensive solution portfolios, is expected to mitigate these challenges and further solidify CANopen's position as a vital communication standard across diverse industrial and technological domains. The market's expansion will likely be concentrated in regions with strong industrial bases and advanced technological adoption, such as Asia Pacific and Europe.
CANopen Products and Solutions Company Market Share
CANopen Products and Solutions Market: A Comprehensive Analysis & Forecast (2019-2033)
This in-depth report provides a detailed examination of the global CANopen products and solutions market. We delve into market dynamics, growth trends, regional dominance, product landscapes, key drivers, emerging opportunities, and the strategic moves of major players. The study encompasses the historical period from 2019-2024, with a base year of 2025 and a forecast period extending to 2033, offering valuable insights for stakeholders seeking to navigate this rapidly evolving sector.
CANopen Products and Solutions Market Dynamics & Structure
The CANopen products and solutions market exhibits a moderately concentrated structure, driven by significant technological innovation and robust demand from diverse industrial applications. Key players are continuously investing in R&D to enhance network performance, interoperability, and security features, thereby pushing the boundaries of industrial automation. Regulatory frameworks, primarily centered around functional safety and industrial communication standards, play a crucial role in shaping product development and market entry strategies. The availability of competitive product substitutes, while present, is often offset by the established ecosystem and widespread adoption of CANopen in legacy and new systems. End-user demographics are increasingly sophisticated, demanding solutions that offer greater flexibility, real-time data processing, and seamless integration. Mergers and acquisitions (M&A) activity is a notable trend, with larger entities acquiring specialized CANopen solution providers to expand their product portfolios and market reach. For instance, the M&A deal volume in the industrial automation sector, a proxy for CANopen-related consolidation, saw an estimated 550 million units transacted in the historical period. Innovation barriers, though present in the form of established industry practices, are being overcome by the increasing need for connected and intelligent systems across all sectors.
- Market Concentration: Moderately concentrated with a few dominant players and a growing number of niche solution providers.
- Technological Innovation Drivers: Focus on real-time performance, security, diagnostics, and ease of integration.
- Regulatory Frameworks: Adherence to functional safety standards (e.g., ISO 13849, IEC 61508) and industrial communication protocols.
- Competitive Product Substitutes: EtherNet/IP, PROFINET, and other industrial Ethernet protocols are alternatives, but CANopen retains strong footholds.
- End-User Demographics: Demand for intelligent, networked, and data-driven solutions across industries.
- M&A Trends: Strategic acquisitions to broaden product offerings and market presence.
CANopen Products and Solutions Growth Trends & Insights
The global CANopen products and solutions market is poised for sustained growth, driven by the relentless march of Industry 4.0 and the increasing demand for efficient, reliable, and flexible industrial automation. The market size is projected to witness a Compound Annual Growth Rate (CAGR) of approximately 6.8% over the forecast period. This expansion is fueled by the escalating adoption of connected devices and the need for standardized communication protocols in smart manufacturing, automotive systems, and other critical sectors. Technological disruptions, such as advancements in embedded systems and the integration of AI and machine learning for predictive maintenance, are significantly influencing consumer behavior. End-users are increasingly seeking solutions that offer not only robust data exchange but also enhanced diagnostics and remote management capabilities. The market penetration of CANopen solutions is expected to deepen, particularly in emerging economies where industrialization is rapidly accelerating. The shift towards more integrated and intelligent systems necessitates sophisticated communication architectures, making CANopen an indispensable component. For instance, the overall industrial automation market, a strong indicator for CANopen, is estimated to reach USD 450 billion by 2025, with CANopen solutions capturing a significant portion of this expansion. The evolving consumer preferences for automation and efficiency in production processes are directly translating into a higher demand for reliable and scalable networking solutions like CANopen. The market's resilience is further demonstrated by its ability to adapt to new technological paradigms, ensuring its continued relevance in the industrial landscape.
Dominant Regions, Countries, or Segments in CANopen Products and Solutions
The Industry segment is a primary driver of growth within the CANopen products and solutions market, demonstrating the highest market share and projected expansion. This dominance stems from the widespread application of CANopen in factory automation, machine control, and process industries where robust and reliable communication is paramount. Europe, particularly Germany, stands out as a dominant region due to its strong manufacturing base and early adoption of industrial automation technologies. The region benefits from favorable economic policies and a well-developed infrastructure that supports advanced industrial networks. North America also presents significant growth potential, driven by increasing investments in smart manufacturing and the adoption of Industry 4.0 principles. Asia Pacific, with its burgeoning manufacturing sector and rapid industrialization, is emerging as a key growth engine, especially countries like China and South Korea.
Within the Industry segment, key drivers include:
- Economic Policies: Government initiatives promoting automation and advanced manufacturing.
- Infrastructure: Highly developed industrial infrastructure facilitating network deployment.
- Technological Advancements: Continuous innovation in robotics, PLCs, and sensor technologies requiring sophisticated communication.
- Demand for Efficiency: Pressure to optimize production processes and reduce operational costs.
The Hardware type of CANopen products, including interfaces, nodes, and gateways, commands a larger market share compared to software solutions. This is because the physical infrastructure of CANopen networks is fundamental to its operation. However, the Software segment is witnessing rapid growth, driven by the increasing demand for configuration tools, diagnostic software, and embedded firmware solutions that enhance the functionality and management of CANopen networks. The Automobile application segment, while significant, is increasingly seeing competition from automotive-specific network protocols. Nevertheless, CANopen continues to be utilized in various automotive subsystems, contributing to its market presence.
CANopen Products and Solutions Product Landscape
The CANopen products and solutions market is characterized by continuous product innovation, focusing on enhanced performance, interoperability, and ease of integration. These solutions encompass a wide range of hardware, from compact CANopen nodes and robust gateways to sophisticated master controllers, and comprehensive software tools for configuration, diagnostics, and network management. Unique selling propositions often lie in the ruggedized designs for harsh industrial environments, advanced safety features compliant with industry standards, and seamless integration with existing automation systems. Technological advancements are enabling higher data transmission rates, improved real-time control, and more efficient network diagnostics, making CANopen a versatile solution for diverse applications.
Key Drivers, Barriers & Challenges in CANopen Products and Solutions
The CANopen products and solutions market is propelled by several key drivers, including the pervasive adoption of Industry 4.0, the demand for reliable and deterministic industrial communication, and the established ecosystem of CANopen-compatible devices. Technological advancements in embedded systems and the increasing need for sensor networks further accelerate market growth. The robust functionality and proven track record of CANopen in demanding environments are also significant enablers.
Key Drivers:
- Industry 4.0 Adoption: Integration of connected devices and smart manufacturing processes.
- Deterministic Communication: Requirement for reliable and time-sensitive data exchange in automation.
- Established Ecosystem: Wide availability of compatible hardware and software from multiple vendors.
- Cost-Effectiveness: Relatively lower implementation costs compared to some industrial Ethernet solutions for certain applications.
Conversely, the market faces challenges such as the increasing competition from industrial Ethernet protocols, which offer higher bandwidth and greater flexibility for certain applications. Supply chain disruptions, though easing, can still impact component availability and lead times for hardware manufacturers. Regulatory hurdles related to cybersecurity and functional safety standards require continuous compliance efforts.
Key Barriers & Challenges:
- Competition from Industrial Ethernet: Protocols like EtherNet/IP and PROFINET offer higher bandwidth.
- Cybersecurity Concerns: Growing need for robust security measures in networked industrial systems.
- Supply Chain Volatility: Potential for component shortages and increased lead times.
- Talent Gap: Shortage of skilled engineers proficient in CANopen network design and implementation.
Emerging Opportunities in CANopen Products and Solutions
Emerging opportunities in the CANopen products and solutions market lie in the growing demand for intelligent edge devices that leverage CANopen for local data acquisition and control, feeding into higher-level industrial IoT platforms. The expansion of industrial automation into sectors like agriculture (precision farming) and logistics presents new avenues for CANopen adoption. Furthermore, the development of more sophisticated diagnostic and predictive maintenance software solutions for CANopen networks, integrated with cloud-based analytics, offers significant untapped potential. The increasing focus on energy efficiency in industrial processes also creates opportunities for CANopen solutions that enable granular monitoring and control of energy consumption.
Growth Accelerators in the CANopen Products and Solutions Industry
Several catalysts are accelerating the long-term growth of the CANopen products and solutions industry. Technological breakthroughs in miniaturization of hardware and advancements in real-time operating systems are enabling more powerful and cost-effective CANopen devices. Strategic partnerships between hardware manufacturers, software developers, and system integrators are crucial for creating comprehensive and tailored solutions. Furthermore, market expansion strategies targeting emerging economies and specific niche industrial applications are key to driving sustained growth. The increasing emphasis on interoperability and standardization within automation ecosystems ensures CANopen's continued relevance.
Key Players Shaping the CANopen Products and Solutions Market
- CAN in Automation (CiA)
- Bosch Rexroth
- Epec Engineered Technologies
- Elmo Motion Control
- HMS Industrial Networks
- Kvaser
- Microchip Technology
- Schneider Electric
- Vector Informatik
- WAGO Kontakttechnik
- B&R Industrial Automation
- Beckhoff Automation
- Delta Tau Data Systems
- Phoenix Contact
- Lenze
- Copley Controls
Notable Milestones in CANopen Products and Solutions Sector
- 2019: Introduction of enhanced security protocols for CANopen networks addressing growing cybersecurity threats.
- 2020: Launch of new high-performance CANopen master controllers offering advanced processing capabilities.
- 2021: Increased adoption of CANopen in renewable energy applications, such as solar and wind power systems.
- 2022: Release of updated versions of CANopen configuration and diagnostic tools with improved user interfaces and features.
- 2023: Focus on interoperability between CANopen and other industrial communication protocols for seamless integration in complex automation systems.
- 2024: Significant advancements in CANopen-based motion control solutions for robotics and automated machinery.
- 2025 (Estimated): Introduction of AI-driven diagnostic features for proactive issue identification in CANopen networks.
- 2026-2033 (Forecast): Continued integration of CANopen with IoT platforms and edge computing solutions, further enhancing data analytics and remote management capabilities.
In-Depth CANopen Products and Solutions Market Outlook
The future market outlook for CANopen products and solutions is exceptionally positive, driven by the enduring need for robust, reliable, and cost-effective industrial communication. Growth accelerators such as advancements in edge computing, the increasing demand for intelligent automation in diverse industries, and strategic collaborations among key players will continue to propel the market forward. The CANopen ecosystem's adaptability to new technological paradigms, including its integration with IIoT and AI, positions it for sustained relevance and expansion. Stakeholders can anticipate further innovation in product offerings, focusing on enhanced security, diagnostics, and seamless integration capabilities, ensuring strong market potential and strategic opportunities for growth and development.
CANopen Products and Solutions Segmentation
-
1. Application
- 1.1. Automobile
- 1.2. Industry
- 1.3. The Medical
- 1.4. Aviation
- 1.5. Shipping
- 1.6. Agriculture
- 1.7. Energy
- 1.8. Other
-
2. Types
- 2.1. Hardware
- 2.2. Software
CANopen Products and Solutions Segmentation By Geography
-
1. North America
- 1.1. United States
- 1.2. Canada
- 1.3. Mexico
-
2. South America
- 2.1. Brazil
- 2.2. Argentina
- 2.3. Rest of South America
-
3. Europe
- 3.1. United Kingdom
- 3.2. Germany
- 3.3. France
- 3.4. Italy
- 3.5. Spain
- 3.6. Russia
- 3.7. Benelux
- 3.8. Nordics
- 3.9. Rest of Europe
-
4. Middle East & Africa
- 4.1. Turkey
- 4.2. Israel
- 4.3. GCC
- 4.4. North Africa
- 4.5. South Africa
- 4.6. Rest of Middle East & Africa
-
5. Asia Pacific
- 5.1. China
- 5.2. India
- 5.3. Japan
- 5.4. South Korea
- 5.5. ASEAN
- 5.6. Oceania
- 5.7. Rest of Asia Pacific
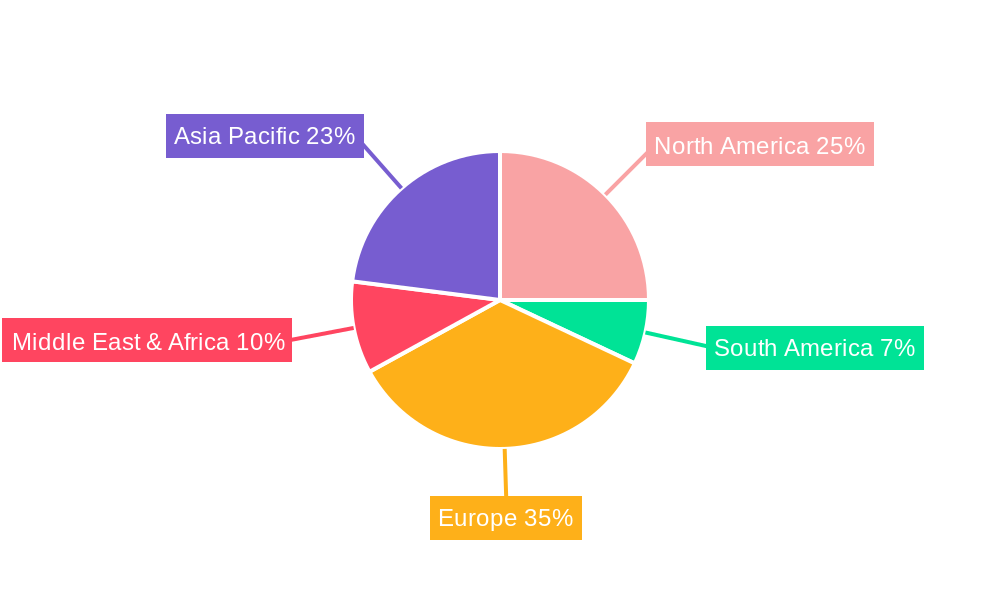
CANopen Products and Solutions Regional Market Share
Geographic Coverage of CANopen Products and Solutions
CANopen Products and Solutions REPORT HIGHLIGHTS
| Aspects | Details |
|---|---|
| Study Period | 2020-2034 |
| Base Year | 2025 |
| Estimated Year | 2026 |
| Forecast Period | 2026-2034 |
| Historical Period | 2020-2025 |
| Growth Rate | CAGR of 3.2% from 2020-2034 |
| Segmentation |
|
Table of Contents
- 1. Introduction
- 1.1. Research Scope
- 1.2. Market Segmentation
- 1.3. Research Objective
- 1.4. Definitions and Assumptions
- 2. Executive Summary
- 2.1. Market Snapshot
- 3. Market Dynamics
- 3.1. Market Drivers
- 3.2. Market Restrains
- 3.3. Market Trends
- 3.4. Market Opportunities
- 4. Market Factor Analysis
- 4.1. Porters Five Forces
- 4.1.1. Bargaining Power of Suppliers
- 4.1.2. Bargaining Power of Buyers
- 4.1.3. Threat of New Entrants
- 4.1.4. Threat of Substitutes
- 4.1.5. Competitive Rivalry
- 4.2. PESTEL analysis
- 4.3. BCG Analysis
- 4.3.1. Stars (High Growth, High Market Share)
- 4.3.2. Cash Cows (Low Growth, High Market Share)
- 4.3.3. Question Mark (High Growth, Low Market Share)
- 4.3.4. Dogs (Low Growth, Low Market Share)
- 4.4. Ansoff Matrix Analysis
- 4.5. Supply Chain Analysis
- 4.6. Regulatory Landscape
- 4.7. Current Market Potential and Opportunity Assessment (TAM–SAM–SOM Framework)
- 4.8. VDR Analyst Note
- 4.1. Porters Five Forces
- 5. Market Analysis, Insights and Forecast 2021-2033
- 5.1. Market Analysis, Insights and Forecast - by Application
- 5.1.1. Automobile
- 5.1.2. Industry
- 5.1.3. The Medical
- 5.1.4. Aviation
- 5.1.5. Shipping
- 5.1.6. Agriculture
- 5.1.7. Energy
- 5.1.8. Other
- 5.2. Market Analysis, Insights and Forecast - by Types
- 5.2.1. Hardware
- 5.2.2. Software
- 5.3. Market Analysis, Insights and Forecast - by Region
- 5.3.1. North America
- 5.3.2. South America
- 5.3.3. Europe
- 5.3.4. Middle East & Africa
- 5.3.5. Asia Pacific
- 5.1. Market Analysis, Insights and Forecast - by Application
- 6. Global CANopen Products and Solutions Analysis, Insights and Forecast, 2021-2033
- 6.1. Market Analysis, Insights and Forecast - by Application
- 6.1.1. Automobile
- 6.1.2. Industry
- 6.1.3. The Medical
- 6.1.4. Aviation
- 6.1.5. Shipping
- 6.1.6. Agriculture
- 6.1.7. Energy
- 6.1.8. Other
- 6.2. Market Analysis, Insights and Forecast - by Types
- 6.2.1. Hardware
- 6.2.2. Software
- 6.1. Market Analysis, Insights and Forecast - by Application
- 7. North America CANopen Products and Solutions Analysis, Insights and Forecast, 2021-2033
- 7.1. Market Analysis, Insights and Forecast - by Application
- 7.1.1. Automobile
- 7.1.2. Industry
- 7.1.3. The Medical
- 7.1.4. Aviation
- 7.1.5. Shipping
- 7.1.6. Agriculture
- 7.1.7. Energy
- 7.1.8. Other
- 7.2. Market Analysis, Insights and Forecast - by Types
- 7.2.1. Hardware
- 7.2.2. Software
- 7.1. Market Analysis, Insights and Forecast - by Application
- 8. South America CANopen Products and Solutions Analysis, Insights and Forecast, 2021-2033
- 8.1. Market Analysis, Insights and Forecast - by Application
- 8.1.1. Automobile
- 8.1.2. Industry
- 8.1.3. The Medical
- 8.1.4. Aviation
- 8.1.5. Shipping
- 8.1.6. Agriculture
- 8.1.7. Energy
- 8.1.8. Other
- 8.2. Market Analysis, Insights and Forecast - by Types
- 8.2.1. Hardware
- 8.2.2. Software
- 8.1. Market Analysis, Insights and Forecast - by Application
- 9. Europe CANopen Products and Solutions Analysis, Insights and Forecast, 2021-2033
- 9.1. Market Analysis, Insights and Forecast - by Application
- 9.1.1. Automobile
- 9.1.2. Industry
- 9.1.3. The Medical
- 9.1.4. Aviation
- 9.1.5. Shipping
- 9.1.6. Agriculture
- 9.1.7. Energy
- 9.1.8. Other
- 9.2. Market Analysis, Insights and Forecast - by Types
- 9.2.1. Hardware
- 9.2.2. Software
- 9.1. Market Analysis, Insights and Forecast - by Application
- 10. Middle East & Africa CANopen Products and Solutions Analysis, Insights and Forecast, 2021-2033
- 10.1. Market Analysis, Insights and Forecast - by Application
- 10.1.1. Automobile
- 10.1.2. Industry
- 10.1.3. The Medical
- 10.1.4. Aviation
- 10.1.5. Shipping
- 10.1.6. Agriculture
- 10.1.7. Energy
- 10.1.8. Other
- 10.2. Market Analysis, Insights and Forecast - by Types
- 10.2.1. Hardware
- 10.2.2. Software
- 10.1. Market Analysis, Insights and Forecast - by Application
- 11. Asia Pacific CANopen Products and Solutions Analysis, Insights and Forecast, 2021-2033
- 11.1. Market Analysis, Insights and Forecast - by Application
- 11.1.1. Automobile
- 11.1.2. Industry
- 11.1.3. The Medical
- 11.1.4. Aviation
- 11.1.5. Shipping
- 11.1.6. Agriculture
- 11.1.7. Energy
- 11.1.8. Other
- 11.2. Market Analysis, Insights and Forecast - by Types
- 11.2.1. Hardware
- 11.2.2. Software
- 11.1. Market Analysis, Insights and Forecast - by Application
- 12. Competitive Analysis
- 12.1. Company Profiles
- 12.1.1 CAN in Automation (CiA)
- 12.1.1.1. Company Overview
- 12.1.1.2. Products
- 12.1.1.3. Company Financials
- 12.1.1.4. SWOT Analysis
- 12.1.2 Bosch Rexroth
- 12.1.2.1. Company Overview
- 12.1.2.2. Products
- 12.1.2.3. Company Financials
- 12.1.2.4. SWOT Analysis
- 12.1.3 Epec Engineered Technologies
- 12.1.3.1. Company Overview
- 12.1.3.2. Products
- 12.1.3.3. Company Financials
- 12.1.3.4. SWOT Analysis
- 12.1.4 Elmo Motion Control
- 12.1.4.1. Company Overview
- 12.1.4.2. Products
- 12.1.4.3. Company Financials
- 12.1.4.4. SWOT Analysis
- 12.1.5 HMS Industrial Networks
- 12.1.5.1. Company Overview
- 12.1.5.2. Products
- 12.1.5.3. Company Financials
- 12.1.5.4. SWOT Analysis
- 12.1.6 Kvaser
- 12.1.6.1. Company Overview
- 12.1.6.2. Products
- 12.1.6.3. Company Financials
- 12.1.6.4. SWOT Analysis
- 12.1.7 Microchip Technology
- 12.1.7.1. Company Overview
- 12.1.7.2. Products
- 12.1.7.3. Company Financials
- 12.1.7.4. SWOT Analysis
- 12.1.8 Schneider Electric
- 12.1.8.1. Company Overview
- 12.1.8.2. Products
- 12.1.8.3. Company Financials
- 12.1.8.4. SWOT Analysis
- 12.1.9 Vector Informatik
- 12.1.9.1. Company Overview
- 12.1.9.2. Products
- 12.1.9.3. Company Financials
- 12.1.9.4. SWOT Analysis
- 12.1.10 WAGO Kontakttechnik
- 12.1.10.1. Company Overview
- 12.1.10.2. Products
- 12.1.10.3. Company Financials
- 12.1.10.4. SWOT Analysis
- 12.1.11 B&R Industrial Automation
- 12.1.11.1. Company Overview
- 12.1.11.2. Products
- 12.1.11.3. Company Financials
- 12.1.11.4. SWOT Analysis
- 12.1.12 Beckhoff Automation
- 12.1.12.1. Company Overview
- 12.1.12.2. Products
- 12.1.12.3. Company Financials
- 12.1.12.4. SWOT Analysis
- 12.1.13 Delta Tau Data Systems
- 12.1.13.1. Company Overview
- 12.1.13.2. Products
- 12.1.13.3. Company Financials
- 12.1.13.4. SWOT Analysis
- 12.1.14 Phoenix Contact
- 12.1.14.1. Company Overview
- 12.1.14.2. Products
- 12.1.14.3. Company Financials
- 12.1.14.4. SWOT Analysis
- 12.1.15 Lenze
- 12.1.15.1. Company Overview
- 12.1.15.2. Products
- 12.1.15.3. Company Financials
- 12.1.15.4. SWOT Analysis
- 12.1.16 Copley Controls
- 12.1.16.1. Company Overview
- 12.1.16.2. Products
- 12.1.16.3. Company Financials
- 12.1.16.4. SWOT Analysis
- 12.1.1 CAN in Automation (CiA)
- 12.2. Market Entropy
- 12.2.1 Company's Key Areas Served
- 12.2.2 Recent Developments
- 12.3. Company Market Share Analysis 2025
- 12.3.1 Top 5 Companies Market Share Analysis
- 12.3.2 Top 3 Companies Market Share Analysis
- 12.4. List of Potential Customers
- 13. Research Methodology
List of Figures
- Figure 1: Global CANopen Products and Solutions Revenue Breakdown (million, %) by Region 2025 & 2033
- Figure 2: North America CANopen Products and Solutions Revenue (million), by Application 2025 & 2033
- Figure 3: North America CANopen Products and Solutions Revenue Share (%), by Application 2025 & 2033
- Figure 4: North America CANopen Products and Solutions Revenue (million), by Types 2025 & 2033
- Figure 5: North America CANopen Products and Solutions Revenue Share (%), by Types 2025 & 2033
- Figure 6: North America CANopen Products and Solutions Revenue (million), by Country 2025 & 2033
- Figure 7: North America CANopen Products and Solutions Revenue Share (%), by Country 2025 & 2033
- Figure 8: South America CANopen Products and Solutions Revenue (million), by Application 2025 & 2033
- Figure 9: South America CANopen Products and Solutions Revenue Share (%), by Application 2025 & 2033
- Figure 10: South America CANopen Products and Solutions Revenue (million), by Types 2025 & 2033
- Figure 11: South America CANopen Products and Solutions Revenue Share (%), by Types 2025 & 2033
- Figure 12: South America CANopen Products and Solutions Revenue (million), by Country 2025 & 2033
- Figure 13: South America CANopen Products and Solutions Revenue Share (%), by Country 2025 & 2033
- Figure 14: Europe CANopen Products and Solutions Revenue (million), by Application 2025 & 2033
- Figure 15: Europe CANopen Products and Solutions Revenue Share (%), by Application 2025 & 2033
- Figure 16: Europe CANopen Products and Solutions Revenue (million), by Types 2025 & 2033
- Figure 17: Europe CANopen Products and Solutions Revenue Share (%), by Types 2025 & 2033
- Figure 18: Europe CANopen Products and Solutions Revenue (million), by Country 2025 & 2033
- Figure 19: Europe CANopen Products and Solutions Revenue Share (%), by Country 2025 & 2033
- Figure 20: Middle East & Africa CANopen Products and Solutions Revenue (million), by Application 2025 & 2033
- Figure 21: Middle East & Africa CANopen Products and Solutions Revenue Share (%), by Application 2025 & 2033
- Figure 22: Middle East & Africa CANopen Products and Solutions Revenue (million), by Types 2025 & 2033
- Figure 23: Middle East & Africa CANopen Products and Solutions Revenue Share (%), by Types 2025 & 2033
- Figure 24: Middle East & Africa CANopen Products and Solutions Revenue (million), by Country 2025 & 2033
- Figure 25: Middle East & Africa CANopen Products and Solutions Revenue Share (%), by Country 2025 & 2033
- Figure 26: Asia Pacific CANopen Products and Solutions Revenue (million), by Application 2025 & 2033
- Figure 27: Asia Pacific CANopen Products and Solutions Revenue Share (%), by Application 2025 & 2033
- Figure 28: Asia Pacific CANopen Products and Solutions Revenue (million), by Types 2025 & 2033
- Figure 29: Asia Pacific CANopen Products and Solutions Revenue Share (%), by Types 2025 & 2033
- Figure 30: Asia Pacific CANopen Products and Solutions Revenue (million), by Country 2025 & 2033
- Figure 31: Asia Pacific CANopen Products and Solutions Revenue Share (%), by Country 2025 & 2033
List of Tables
- Table 1: Global CANopen Products and Solutions Revenue million Forecast, by Application 2020 & 2033
- Table 2: Global CANopen Products and Solutions Revenue million Forecast, by Types 2020 & 2033
- Table 3: Global CANopen Products and Solutions Revenue million Forecast, by Region 2020 & 2033
- Table 4: Global CANopen Products and Solutions Revenue million Forecast, by Application 2020 & 2033
- Table 5: Global CANopen Products and Solutions Revenue million Forecast, by Types 2020 & 2033
- Table 6: Global CANopen Products and Solutions Revenue million Forecast, by Country 2020 & 2033
- Table 7: United States CANopen Products and Solutions Revenue (million) Forecast, by Application 2020 & 2033
- Table 8: Canada CANopen Products and Solutions Revenue (million) Forecast, by Application 2020 & 2033
- Table 9: Mexico CANopen Products and Solutions Revenue (million) Forecast, by Application 2020 & 2033
- Table 10: Global CANopen Products and Solutions Revenue million Forecast, by Application 2020 & 2033
- Table 11: Global CANopen Products and Solutions Revenue million Forecast, by Types 2020 & 2033
- Table 12: Global CANopen Products and Solutions Revenue million Forecast, by Country 2020 & 2033
- Table 13: Brazil CANopen Products and Solutions Revenue (million) Forecast, by Application 2020 & 2033
- Table 14: Argentina CANopen Products and Solutions Revenue (million) Forecast, by Application 2020 & 2033
- Table 15: Rest of South America CANopen Products and Solutions Revenue (million) Forecast, by Application 2020 & 2033
- Table 16: Global CANopen Products and Solutions Revenue million Forecast, by Application 2020 & 2033
- Table 17: Global CANopen Products and Solutions Revenue million Forecast, by Types 2020 & 2033
- Table 18: Global CANopen Products and Solutions Revenue million Forecast, by Country 2020 & 2033
- Table 19: United Kingdom CANopen Products and Solutions Revenue (million) Forecast, by Application 2020 & 2033
- Table 20: Germany CANopen Products and Solutions Revenue (million) Forecast, by Application 2020 & 2033
- Table 21: France CANopen Products and Solutions Revenue (million) Forecast, by Application 2020 & 2033
- Table 22: Italy CANopen Products and Solutions Revenue (million) Forecast, by Application 2020 & 2033
- Table 23: Spain CANopen Products and Solutions Revenue (million) Forecast, by Application 2020 & 2033
- Table 24: Russia CANopen Products and Solutions Revenue (million) Forecast, by Application 2020 & 2033
- Table 25: Benelux CANopen Products and Solutions Revenue (million) Forecast, by Application 2020 & 2033
- Table 26: Nordics CANopen Products and Solutions Revenue (million) Forecast, by Application 2020 & 2033
- Table 27: Rest of Europe CANopen Products and Solutions Revenue (million) Forecast, by Application 2020 & 2033
- Table 28: Global CANopen Products and Solutions Revenue million Forecast, by Application 2020 & 2033
- Table 29: Global CANopen Products and Solutions Revenue million Forecast, by Types 2020 & 2033
- Table 30: Global CANopen Products and Solutions Revenue million Forecast, by Country 2020 & 2033
- Table 31: Turkey CANopen Products and Solutions Revenue (million) Forecast, by Application 2020 & 2033
- Table 32: Israel CANopen Products and Solutions Revenue (million) Forecast, by Application 2020 & 2033
- Table 33: GCC CANopen Products and Solutions Revenue (million) Forecast, by Application 2020 & 2033
- Table 34: North Africa CANopen Products and Solutions Revenue (million) Forecast, by Application 2020 & 2033
- Table 35: South Africa CANopen Products and Solutions Revenue (million) Forecast, by Application 2020 & 2033
- Table 36: Rest of Middle East & Africa CANopen Products and Solutions Revenue (million) Forecast, by Application 2020 & 2033
- Table 37: Global CANopen Products and Solutions Revenue million Forecast, by Application 2020 & 2033
- Table 38: Global CANopen Products and Solutions Revenue million Forecast, by Types 2020 & 2033
- Table 39: Global CANopen Products and Solutions Revenue million Forecast, by Country 2020 & 2033
- Table 40: China CANopen Products and Solutions Revenue (million) Forecast, by Application 2020 & 2033
- Table 41: India CANopen Products and Solutions Revenue (million) Forecast, by Application 2020 & 2033
- Table 42: Japan CANopen Products and Solutions Revenue (million) Forecast, by Application 2020 & 2033
- Table 43: South Korea CANopen Products and Solutions Revenue (million) Forecast, by Application 2020 & 2033
- Table 44: ASEAN CANopen Products and Solutions Revenue (million) Forecast, by Application 2020 & 2033
- Table 45: Oceania CANopen Products and Solutions Revenue (million) Forecast, by Application 2020 & 2033
- Table 46: Rest of Asia Pacific CANopen Products and Solutions Revenue (million) Forecast, by Application 2020 & 2033
Frequently Asked Questions
1. What is the projected Compound Annual Growth Rate (CAGR) of the CANopen Products and Solutions?
The projected CAGR is approximately 3.2%.
2. Which companies are prominent players in the CANopen Products and Solutions?
Key companies in the market include CAN in Automation (CiA), Bosch Rexroth, Epec Engineered Technologies, Elmo Motion Control, HMS Industrial Networks, Kvaser, Microchip Technology, Schneider Electric, Vector Informatik, WAGO Kontakttechnik, B&R Industrial Automation, Beckhoff Automation, Delta Tau Data Systems, Phoenix Contact, Lenze, Copley Controls.
3. What are the main segments of the CANopen Products and Solutions?
The market segments include Application, Types.
4. Can you provide details about the market size?
The market size is estimated to be USD 46 million as of 2022.
5. What are some drivers contributing to market growth?
N/A
6. What are the notable trends driving market growth?
N/A
7. Are there any restraints impacting market growth?
N/A
8. Can you provide examples of recent developments in the market?
N/A
9. What pricing options are available for accessing the report?
Pricing options include single-user, multi-user, and enterprise licenses priced at USD 2900.00, USD 4350.00, and USD 5800.00 respectively.
10. Is the market size provided in terms of value or volume?
The market size is provided in terms of value, measured in million.
11. Are there any specific market keywords associated with the report?
Yes, the market keyword associated with the report is "CANopen Products and Solutions," which aids in identifying and referencing the specific market segment covered.
12. How do I determine which pricing option suits my needs best?
The pricing options vary based on user requirements and access needs. Individual users may opt for single-user licenses, while businesses requiring broader access may choose multi-user or enterprise licenses for cost-effective access to the report.
13. Are there any additional resources or data provided in the CANopen Products and Solutions report?
While the report offers comprehensive insights, it's advisable to review the specific contents or supplementary materials provided to ascertain if additional resources or data are available.
14. How can I stay updated on further developments or reports in the CANopen Products and Solutions?
To stay informed about further developments, trends, and reports in the CANopen Products and Solutions, consider subscribing to industry newsletters, following relevant companies and organizations, or regularly checking reputable industry news sources and publications.
Methodology
Step 1 - Identification of Relevant Samples Size from Population Database


Step 2 - Approaches for Defining Global Market Size (Value, Volume* & Price*)

Note*: In applicable scenarios
Step 3 - Data Sources
Primary Research
- Web Analytics
- Survey Reports
- Research Institute
- Latest Research Reports
- Opinion Leaders
Secondary Research
- Annual Reports
- White Paper
- Latest Press Release
- Industry Association
- Paid Database
- Investor Presentations

Step 4 - Data Triangulation
Involves using different sources of information in order to increase the validity of a study
These sources are likely to be stakeholders in a program - participants, other researchers, program staff, other community members, and so on.
Then we put all data in single framework & apply various statistical tools to find out the dynamic on the market.
During the analysis stage, feedback from the stakeholder groups would be compared to determine areas of agreement as well as areas of divergence