
Key Insights
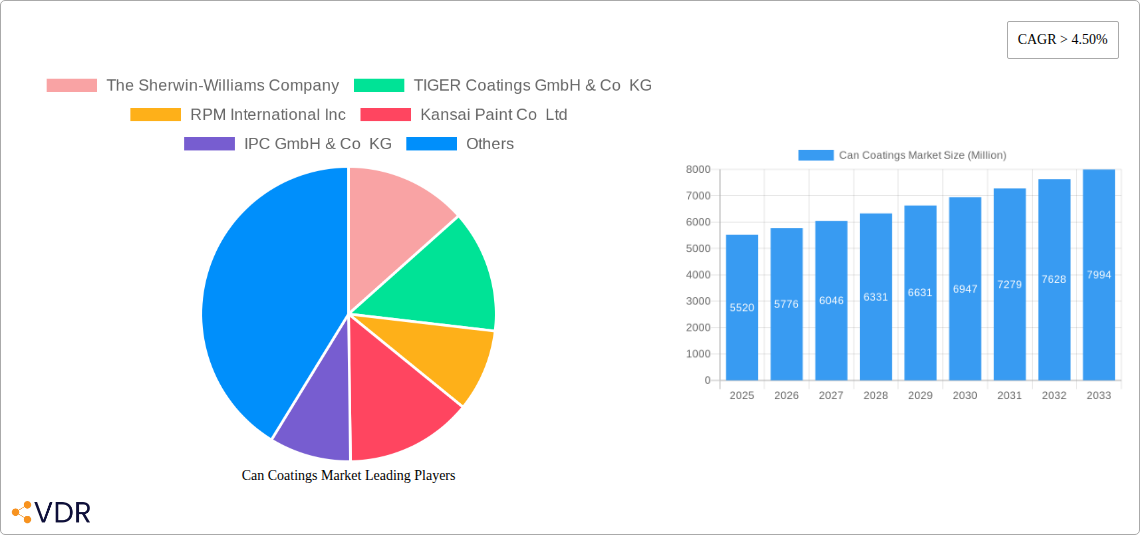
The global can coatings market, valued at $5.52 billion in 2025, is projected to experience robust growth, exhibiting a Compound Annual Growth Rate (CAGR) exceeding 4.50% from 2025 to 2033. This expansion is driven by several key factors. The increasing demand for canned food and beverages, particularly in developing economies, fuels the need for protective and aesthetically pleasing coatings. Furthermore, the growing adoption of sustainable and eco-friendly coatings, such as water-based options, is a significant trend shaping market dynamics. Stricter regulations regarding food safety and environmental concerns are pushing manufacturers to adopt more advanced and sustainable coating technologies. The market segmentation reveals a diverse landscape, with acrylic, epoxy, and polyester coatings dominating the type segment, while beverage cans, food cans, and aerosol cans represent the major application areas. Key players, including Sherwin-Williams, Tiger Coatings, RPM International, and PPG Industries, are actively investing in research and development to enhance coating performance and expand their product portfolios to cater to evolving consumer preferences and regulatory requirements. Competition is intense, with companies focusing on innovation, strategic partnerships, and geographical expansion to gain a competitive edge.
The regional distribution of the can coatings market reflects global consumption patterns. North America and Europe currently hold significant market shares, driven by established food and beverage industries. However, the Asia-Pacific region is anticipated to witness the fastest growth in the forecast period, fueled by rapid economic development, rising disposable incomes, and increasing demand for packaged goods in emerging markets like China and India. Challenges such as fluctuating raw material prices and the need to balance sustainability with performance requirements present ongoing obstacles for market participants. Nevertheless, the long-term outlook for the can coatings market remains positive, driven by sustained demand from end-use industries and ongoing technological advancements. Market players are likely to focus on value-added services and customized solutions to maintain their market position and capitalize on growth opportunities in specific regions and application segments.
Can Coatings Market: A Comprehensive Report (2019-2033)
This comprehensive report provides an in-depth analysis of the Can Coatings market, encompassing market dynamics, growth trends, regional segmentation, product landscape, key players, and future outlook. The study period covers 2019-2033, with 2025 as the base year and a forecast period of 2025-2033. The report caters to industry professionals, investors, and strategic decision-makers seeking a detailed understanding of this dynamic market. The market is segmented by Type (Acrylic, Epoxy, Polyester, Other Types) and Application (Beverage Can, Food Can, Aerosol Can, Other Applications). The total market size is predicted to reach xx Million units by 2033.
Can Coatings Market Market Dynamics & Structure
The Can Coatings market is characterized by moderate concentration, with several key players holding significant market share. Technological innovation, particularly in sustainable and eco-friendly coatings, is a major driver. Stringent regulatory frameworks concerning food safety and environmental impact influence product development and manufacturing processes. The market faces competition from alternative packaging materials, but the inherent advantages of metal cans (durability, recyclability) ensure sustained demand. Mergers and acquisitions (M&A) activity has been moderate, with strategic partnerships playing a significant role in market expansion.
- Market Concentration: Moderately concentrated, with top 5 players holding approximately xx% market share (2024).
- Technological Innovation: Focus on bisphenol-free (BPA-free) coatings and improved sustainability.
- Regulatory Framework: Stringent regulations regarding food safety and environmental compliance.
- Competitive Substitutes: Alternative packaging materials like plastics and paperboard pose competition.
- M&A Trends: Moderate M&A activity, driven by strategic expansions and technology acquisitions. xx M&A deals recorded between 2019-2024.
- Innovation Barriers: High R&D costs and stringent regulatory approval processes.
Can Coatings Market Growth Trends & Insights
The Can Coatings market has witnessed steady growth throughout the historical period (2019-2024), driven by increasing demand for canned food and beverages globally. The adoption rate of advanced coatings with improved performance characteristics (e.g., corrosion resistance, printability) is steadily increasing. Technological disruptions, such as the development of BPA-free coatings and eco-friendly formulations, are reshaping the market landscape. Consumer preferences for sustainable and healthy packaging solutions further drive market expansion. The market is projected to exhibit a CAGR of xx% during the forecast period (2025-2033), reaching xx Million units by 2033. Market penetration of advanced coatings is expected to increase from xx% in 2025 to xx% by 2033.

Dominant Regions, Countries, or Segments in Can Coatings Market
North America and Europe currently dominate the Can Coatings market, driven by established food and beverage industries, strong regulatory frameworks, and high consumer awareness. Within these regions, the United States and Germany are leading countries. The beverage can segment holds the largest market share, followed by the food can segment.
- Leading Region: North America (xx% market share in 2025)
- Leading Country: United States (xx% market share within North America in 2025)
- Leading Segment (Type): Acrylic Coatings (xx% market share in 2025)
- Leading Segment (Application): Beverage Cans (xx% market share in 2025)
- Key Drivers (North America): Strong demand for canned beverages and established manufacturing base.
- Key Drivers (Europe): Stringent food safety regulations and focus on sustainable packaging.
Can Coatings Market Product Landscape
The Can Coatings market offers a wide range of products tailored to specific applications, including interior and exterior coatings for beverage, food, and aerosol cans. Key product features include enhanced corrosion resistance, excellent printability, and compatibility with various can materials. Recent innovations focus on developing BPA-free and eco-friendly formulations, meeting growing consumer demands for sustainable packaging. The emphasis is on improved performance, durability, and regulatory compliance.
Key Drivers, Barriers & Challenges in Can Coatings Market
Key Drivers:
- Growing demand for canned food and beverages.
- Increasing adoption of advanced coatings with superior performance.
- Stringent regulations promoting sustainable and eco-friendly packaging.
Key Challenges:
- Fluctuations in raw material prices.
- Stringent regulatory approvals and compliance costs.
- Intense competition among existing players.
Emerging Opportunities in Can Coatings Market
- Growing demand for sustainable and eco-friendly coatings.
- Expansion into emerging markets with rising consumption of canned products.
- Development of specialized coatings for new can applications (e.g., pharmaceuticals).
Growth Accelerators in the Can Coatings Market Industry
Technological advancements in coating formulations, coupled with strategic partnerships between coating manufacturers and can producers, are accelerating market growth. Expansions into new geographical markets and diversification into specialized applications are key strategies for market leaders.
Key Players Shaping the Can Coatings Market Market
- The Sherwin-Williams Company
- TIGER Coatings GmbH & Co KG
- RPM International Inc
- Kansai Paint Co Ltd
- IPC GmbH & Co KG
- PPG Industries Inc
- TOYOCHEM CO LTD
- VPL Coatings GmbH & Co KG
- Axalta Coating Systems
- Akzo Nobel N V
- National Paints Factories Co Ltd
- Kupsa Coatings
Notable Milestones in Can Coatings Market Sector
- November 2023: AkzoNobel's EUR 32 million investment in a new bisphenol-free coatings factory signifies a major commitment to sustainable packaging solutions.
- August 2022: PPG Industries' launch of PPG INNOVEL PRO highlights the growing importance of BPA-free coatings.
- July 2022: PPG Industries' expansion of its Delaware facility underscores the increasing demand for high-quality can coatings.
In-Depth Can Coatings Market Market Outlook
The Can Coatings market is poised for sustained growth, driven by increasing demand for canned goods, technological innovations, and a growing focus on sustainability. Strategic partnerships, product diversification, and expansion into emerging markets will be key factors driving future market potential. The market offers significant opportunities for players who can effectively adapt to evolving consumer preferences and regulatory requirements.
Can Coatings Market Segmentation
-
1. Type
- 1.1. Acrylic
- 1.2. Epoxy
- 1.3. Polyester
- 1.4. Other Types
-
2. Application
- 2.1. Beverage Can
- 2.2. Food Can
- 2.3. Aerosol Can
- 2.4. Other Applications
Can Coatings Market Segmentation By Geography
-
1. Asia Pacific
- 1.1. China
- 1.2. India
- 1.3. Japan
- 1.4. South Korea
- 1.5. Indonesia
- 1.6. Malaysia
- 1.7. Thailand
- 1.8. Vietnam
- 1.9. Rest of Asia Pacific
-
2. North America
- 2.1. United States
- 2.2. Canada
- 2.3. Mexico
-
3. Europe
- 3.1. Germany
- 3.2. United Kingdom
- 3.3. France
- 3.4. Italy
- 3.5. Spain
- 3.6. Russia
- 3.7. Turkey
- 3.8. NORDIC Countries
- 3.9. Rest of Europe
-
4. South America
- 4.1. Brazil
- 4.2. Argentina
- 4.3. Colombia
- 4.4. Rest of South America
-
5. Middle East and Africa
- 5.1. Saudi Arabia
- 5.2. South Africa
- 5.3. Qatar
- 5.4. UAE
- 5.5. Egypt
- 5.6. Algeria
- 5.7. Rest of Middle East and Africa

Can Coatings Market REPORT HIGHLIGHTS
| Aspects | Details |
|---|---|
| Study Period | 2019-2033 |
| Base Year | 2024 |
| Estimated Year | 2025 |
| Forecast Period | 2025-2033 |
| Historical Period | 2019-2024 |
| Growth Rate | CAGR of > 4.50% from 2019-2033 |
| Segmentation |
|
Table of Contents
- 1. Introduction
- 1.1. Research Scope
- 1.2. Market Segmentation
- 1.3. Research Methodology
- 1.4. Definitions and Assumptions
- 2. Executive Summary
- 2.1. Introduction
- 3. Market Dynamics
- 3.1. Introduction
- 3.2. Market Drivers
- 3.2.1. Increasing Demand from Food and Beverage Packaging; Growing Utilization of Aerosol Cans for Personal Care Industry
- 3.3. Market Restrains
- 3.3.1. Stringent VOC Regulatory Policies; Other Restraints
- 3.4. Market Trends
- 3.4.1. Beverage Cans to Dominate the market
- 4. Market Factor Analysis
- 4.1. Porters Five Forces
- 4.2. Supply/Value Chain
- 4.3. PESTEL analysis
- 4.4. Market Entropy
- 4.5. Patent/Trademark Analysis
- 5. Global Can Coatings Market Analysis, Insights and Forecast, 2019-2031
- 5.1. Market Analysis, Insights and Forecast - by Type
- 5.1.1. Acrylic
- 5.1.2. Epoxy
- 5.1.3. Polyester
- 5.1.4. Other Types
- 5.2. Market Analysis, Insights and Forecast - by Application
- 5.2.1. Beverage Can
- 5.2.2. Food Can
- 5.2.3. Aerosol Can
- 5.2.4. Other Applications
- 5.3. Market Analysis, Insights and Forecast - by Region
- 5.3.1. Asia Pacific
- 5.3.2. North America
- 5.3.3. Europe
- 5.3.4. South America
- 5.3.5. Middle East and Africa
- 5.1. Market Analysis, Insights and Forecast - by Type
- 6. Asia Pacific Can Coatings Market Analysis, Insights and Forecast, 2019-2031
- 6.1. Market Analysis, Insights and Forecast - by Type
- 6.1.1. Acrylic
- 6.1.2. Epoxy
- 6.1.3. Polyester
- 6.1.4. Other Types
- 6.2. Market Analysis, Insights and Forecast - by Application
- 6.2.1. Beverage Can
- 6.2.2. Food Can
- 6.2.3. Aerosol Can
- 6.2.4. Other Applications
- 6.1. Market Analysis, Insights and Forecast - by Type
- 7. North America Can Coatings Market Analysis, Insights and Forecast, 2019-2031
- 7.1. Market Analysis, Insights and Forecast - by Type
- 7.1.1. Acrylic
- 7.1.2. Epoxy
- 7.1.3. Polyester
- 7.1.4. Other Types
- 7.2. Market Analysis, Insights and Forecast - by Application
- 7.2.1. Beverage Can
- 7.2.2. Food Can
- 7.2.3. Aerosol Can
- 7.2.4. Other Applications
- 7.1. Market Analysis, Insights and Forecast - by Type
- 8. Europe Can Coatings Market Analysis, Insights and Forecast, 2019-2031
- 8.1. Market Analysis, Insights and Forecast - by Type
- 8.1.1. Acrylic
- 8.1.2. Epoxy
- 8.1.3. Polyester
- 8.1.4. Other Types
- 8.2. Market Analysis, Insights and Forecast - by Application
- 8.2.1. Beverage Can
- 8.2.2. Food Can
- 8.2.3. Aerosol Can
- 8.2.4. Other Applications
- 8.1. Market Analysis, Insights and Forecast - by Type
- 9. South America Can Coatings Market Analysis, Insights and Forecast, 2019-2031
- 9.1. Market Analysis, Insights and Forecast - by Type
- 9.1.1. Acrylic
- 9.1.2. Epoxy
- 9.1.3. Polyester
- 9.1.4. Other Types
- 9.2. Market Analysis, Insights and Forecast - by Application
- 9.2.1. Beverage Can
- 9.2.2. Food Can
- 9.2.3. Aerosol Can
- 9.2.4. Other Applications
- 9.1. Market Analysis, Insights and Forecast - by Type
- 10. Middle East and Africa Can Coatings Market Analysis, Insights and Forecast, 2019-2031
- 10.1. Market Analysis, Insights and Forecast - by Type
- 10.1.1. Acrylic
- 10.1.2. Epoxy
- 10.1.3. Polyester
- 10.1.4. Other Types
- 10.2. Market Analysis, Insights and Forecast - by Application
- 10.2.1. Beverage Can
- 10.2.2. Food Can
- 10.2.3. Aerosol Can
- 10.2.4. Other Applications
- 10.1. Market Analysis, Insights and Forecast - by Type
- 11. North America Can Coatings Market Analysis, Insights and Forecast, 2019-2031
- 11.1. Market Analysis, Insights and Forecast - By Country/Sub-region
- 11.1.1 United States
- 11.1.2 Canada
- 11.1.3 Mexico
- 12. Europe Can Coatings Market Analysis, Insights and Forecast, 2019-2031
- 12.1. Market Analysis, Insights and Forecast - By Country/Sub-region
- 12.1.1 Germany
- 12.1.2 United Kingdom
- 12.1.3 France
- 12.1.4 Spain
- 12.1.5 Italy
- 12.1.6 Spain
- 12.1.7 Belgium
- 12.1.8 Netherland
- 12.1.9 Nordics
- 12.1.10 Rest of Europe
- 13. Asia Pacific Can Coatings Market Analysis, Insights and Forecast, 2019-2031
- 13.1. Market Analysis, Insights and Forecast - By Country/Sub-region
- 13.1.1 China
- 13.1.2 Japan
- 13.1.3 India
- 13.1.4 South Korea
- 13.1.5 Southeast Asia
- 13.1.6 Australia
- 13.1.7 Indonesia
- 13.1.8 Phillipes
- 13.1.9 Singapore
- 13.1.10 Thailandc
- 13.1.11 Rest of Asia Pacific
- 14. South America Can Coatings Market Analysis, Insights and Forecast, 2019-2031
- 14.1. Market Analysis, Insights and Forecast - By Country/Sub-region
- 14.1.1 Brazil
- 14.1.2 Argentina
- 14.1.3 Peru
- 14.1.4 Chile
- 14.1.5 Colombia
- 14.1.6 Ecuador
- 14.1.7 Venezuela
- 14.1.8 Rest of South America
- 15. MEA Can Coatings Market Analysis, Insights and Forecast, 2019-2031
- 15.1. Market Analysis, Insights and Forecast - By Country/Sub-region
- 15.1.1 United Arab Emirates
- 15.1.2 Saudi Arabia
- 15.1.3 South Africa
- 15.1.4 Rest of Middle East and Africa
- 16. Competitive Analysis
- 16.1. Global Market Share Analysis 2024
- 16.2. Company Profiles
- 16.2.1 The Sherwin-Williams Company
- 16.2.1.1. Overview
- 16.2.1.2. Products
- 16.2.1.3. SWOT Analysis
- 16.2.1.4. Recent Developments
- 16.2.1.5. Financials (Based on Availability)
- 16.2.2 TIGER Coatings GmbH & Co KG
- 16.2.2.1. Overview
- 16.2.2.2. Products
- 16.2.2.3. SWOT Analysis
- 16.2.2.4. Recent Developments
- 16.2.2.5. Financials (Based on Availability)
- 16.2.3 RPM International Inc
- 16.2.3.1. Overview
- 16.2.3.2. Products
- 16.2.3.3. SWOT Analysis
- 16.2.3.4. Recent Developments
- 16.2.3.5. Financials (Based on Availability)
- 16.2.4 Kansai Paint Co Ltd
- 16.2.4.1. Overview
- 16.2.4.2. Products
- 16.2.4.3. SWOT Analysis
- 16.2.4.4. Recent Developments
- 16.2.4.5. Financials (Based on Availability)
- 16.2.5 IPC GmbH & Co KG
- 16.2.5.1. Overview
- 16.2.5.2. Products
- 16.2.5.3. SWOT Analysis
- 16.2.5.4. Recent Developments
- 16.2.5.5. Financials (Based on Availability)
- 16.2.6 PPG Industries Inc
- 16.2.6.1. Overview
- 16.2.6.2. Products
- 16.2.6.3. SWOT Analysis
- 16.2.6.4. Recent Developments
- 16.2.6.5. Financials (Based on Availability)
- 16.2.7 TOYOCHEM CO LTD
- 16.2.7.1. Overview
- 16.2.7.2. Products
- 16.2.7.3. SWOT Analysis
- 16.2.7.4. Recent Developments
- 16.2.7.5. Financials (Based on Availability)
- 16.2.8 VPL Coatings GmbH & Co KG*List Not Exhaustive
- 16.2.8.1. Overview
- 16.2.8.2. Products
- 16.2.8.3. SWOT Analysis
- 16.2.8.4. Recent Developments
- 16.2.8.5. Financials (Based on Availability)
- 16.2.9 Axalta Coating Systems
- 16.2.9.1. Overview
- 16.2.9.2. Products
- 16.2.9.3. SWOT Analysis
- 16.2.9.4. Recent Developments
- 16.2.9.5. Financials (Based on Availability)
- 16.2.10 Akzo Nobel N V
- 16.2.10.1. Overview
- 16.2.10.2. Products
- 16.2.10.3. SWOT Analysis
- 16.2.10.4. Recent Developments
- 16.2.10.5. Financials (Based on Availability)
- 16.2.11 National Paints Factories Co Ltd
- 16.2.11.1. Overview
- 16.2.11.2. Products
- 16.2.11.3. SWOT Analysis
- 16.2.11.4. Recent Developments
- 16.2.11.5. Financials (Based on Availability)
- 16.2.12 Kupsa Coatings
- 16.2.12.1. Overview
- 16.2.12.2. Products
- 16.2.12.3. SWOT Analysis
- 16.2.12.4. Recent Developments
- 16.2.12.5. Financials (Based on Availability)
- 16.2.1 The Sherwin-Williams Company
List of Figures
- Figure 1: Global Can Coatings Market Revenue Breakdown (Million, %) by Region 2024 & 2032
- Figure 2: Global Can Coatings Market Volume Breakdown (liter per unit, %) by Region 2024 & 2032
- Figure 3: North America Can Coatings Market Revenue (Million), by Country 2024 & 2032
- Figure 4: North America Can Coatings Market Volume (liter per unit), by Country 2024 & 2032
- Figure 5: North America Can Coatings Market Revenue Share (%), by Country 2024 & 2032
- Figure 6: North America Can Coatings Market Volume Share (%), by Country 2024 & 2032
- Figure 7: Europe Can Coatings Market Revenue (Million), by Country 2024 & 2032
- Figure 8: Europe Can Coatings Market Volume (liter per unit), by Country 2024 & 2032
- Figure 9: Europe Can Coatings Market Revenue Share (%), by Country 2024 & 2032
- Figure 10: Europe Can Coatings Market Volume Share (%), by Country 2024 & 2032
- Figure 11: Asia Pacific Can Coatings Market Revenue (Million), by Country 2024 & 2032
- Figure 12: Asia Pacific Can Coatings Market Volume (liter per unit), by Country 2024 & 2032
- Figure 13: Asia Pacific Can Coatings Market Revenue Share (%), by Country 2024 & 2032
- Figure 14: Asia Pacific Can Coatings Market Volume Share (%), by Country 2024 & 2032
- Figure 15: South America Can Coatings Market Revenue (Million), by Country 2024 & 2032
- Figure 16: South America Can Coatings Market Volume (liter per unit), by Country 2024 & 2032
- Figure 17: South America Can Coatings Market Revenue Share (%), by Country 2024 & 2032
- Figure 18: South America Can Coatings Market Volume Share (%), by Country 2024 & 2032
- Figure 19: MEA Can Coatings Market Revenue (Million), by Country 2024 & 2032
- Figure 20: MEA Can Coatings Market Volume (liter per unit), by Country 2024 & 2032
- Figure 21: MEA Can Coatings Market Revenue Share (%), by Country 2024 & 2032
- Figure 22: MEA Can Coatings Market Volume Share (%), by Country 2024 & 2032
- Figure 23: Asia Pacific Can Coatings Market Revenue (Million), by Type 2024 & 2032
- Figure 24: Asia Pacific Can Coatings Market Volume (liter per unit), by Type 2024 & 2032
- Figure 25: Asia Pacific Can Coatings Market Revenue Share (%), by Type 2024 & 2032
- Figure 26: Asia Pacific Can Coatings Market Volume Share (%), by Type 2024 & 2032
- Figure 27: Asia Pacific Can Coatings Market Revenue (Million), by Application 2024 & 2032
- Figure 28: Asia Pacific Can Coatings Market Volume (liter per unit), by Application 2024 & 2032
- Figure 29: Asia Pacific Can Coatings Market Revenue Share (%), by Application 2024 & 2032
- Figure 30: Asia Pacific Can Coatings Market Volume Share (%), by Application 2024 & 2032
- Figure 31: Asia Pacific Can Coatings Market Revenue (Million), by Country 2024 & 2032
- Figure 32: Asia Pacific Can Coatings Market Volume (liter per unit), by Country 2024 & 2032
- Figure 33: Asia Pacific Can Coatings Market Revenue Share (%), by Country 2024 & 2032
- Figure 34: Asia Pacific Can Coatings Market Volume Share (%), by Country 2024 & 2032
- Figure 35: North America Can Coatings Market Revenue (Million), by Type 2024 & 2032
- Figure 36: North America Can Coatings Market Volume (liter per unit), by Type 2024 & 2032
- Figure 37: North America Can Coatings Market Revenue Share (%), by Type 2024 & 2032
- Figure 38: North America Can Coatings Market Volume Share (%), by Type 2024 & 2032
- Figure 39: North America Can Coatings Market Revenue (Million), by Application 2024 & 2032
- Figure 40: North America Can Coatings Market Volume (liter per unit), by Application 2024 & 2032
- Figure 41: North America Can Coatings Market Revenue Share (%), by Application 2024 & 2032
- Figure 42: North America Can Coatings Market Volume Share (%), by Application 2024 & 2032
- Figure 43: North America Can Coatings Market Revenue (Million), by Country 2024 & 2032
- Figure 44: North America Can Coatings Market Volume (liter per unit), by Country 2024 & 2032
- Figure 45: North America Can Coatings Market Revenue Share (%), by Country 2024 & 2032
- Figure 46: North America Can Coatings Market Volume Share (%), by Country 2024 & 2032
- Figure 47: Europe Can Coatings Market Revenue (Million), by Type 2024 & 2032
- Figure 48: Europe Can Coatings Market Volume (liter per unit), by Type 2024 & 2032
- Figure 49: Europe Can Coatings Market Revenue Share (%), by Type 2024 & 2032
- Figure 50: Europe Can Coatings Market Volume Share (%), by Type 2024 & 2032
- Figure 51: Europe Can Coatings Market Revenue (Million), by Application 2024 & 2032
- Figure 52: Europe Can Coatings Market Volume (liter per unit), by Application 2024 & 2032
- Figure 53: Europe Can Coatings Market Revenue Share (%), by Application 2024 & 2032
- Figure 54: Europe Can Coatings Market Volume Share (%), by Application 2024 & 2032
- Figure 55: Europe Can Coatings Market Revenue (Million), by Country 2024 & 2032
- Figure 56: Europe Can Coatings Market Volume (liter per unit), by Country 2024 & 2032
- Figure 57: Europe Can Coatings Market Revenue Share (%), by Country 2024 & 2032
- Figure 58: Europe Can Coatings Market Volume Share (%), by Country 2024 & 2032
- Figure 59: South America Can Coatings Market Revenue (Million), by Type 2024 & 2032
- Figure 60: South America Can Coatings Market Volume (liter per unit), by Type 2024 & 2032
- Figure 61: South America Can Coatings Market Revenue Share (%), by Type 2024 & 2032
- Figure 62: South America Can Coatings Market Volume Share (%), by Type 2024 & 2032
- Figure 63: South America Can Coatings Market Revenue (Million), by Application 2024 & 2032
- Figure 64: South America Can Coatings Market Volume (liter per unit), by Application 2024 & 2032
- Figure 65: South America Can Coatings Market Revenue Share (%), by Application 2024 & 2032
- Figure 66: South America Can Coatings Market Volume Share (%), by Application 2024 & 2032
- Figure 67: South America Can Coatings Market Revenue (Million), by Country 2024 & 2032
- Figure 68: South America Can Coatings Market Volume (liter per unit), by Country 2024 & 2032
- Figure 69: South America Can Coatings Market Revenue Share (%), by Country 2024 & 2032
- Figure 70: South America Can Coatings Market Volume Share (%), by Country 2024 & 2032
- Figure 71: Middle East and Africa Can Coatings Market Revenue (Million), by Type 2024 & 2032
- Figure 72: Middle East and Africa Can Coatings Market Volume (liter per unit), by Type 2024 & 2032
- Figure 73: Middle East and Africa Can Coatings Market Revenue Share (%), by Type 2024 & 2032
- Figure 74: Middle East and Africa Can Coatings Market Volume Share (%), by Type 2024 & 2032
- Figure 75: Middle East and Africa Can Coatings Market Revenue (Million), by Application 2024 & 2032
- Figure 76: Middle East and Africa Can Coatings Market Volume (liter per unit), by Application 2024 & 2032
- Figure 77: Middle East and Africa Can Coatings Market Revenue Share (%), by Application 2024 & 2032
- Figure 78: Middle East and Africa Can Coatings Market Volume Share (%), by Application 2024 & 2032
- Figure 79: Middle East and Africa Can Coatings Market Revenue (Million), by Country 2024 & 2032
- Figure 80: Middle East and Africa Can Coatings Market Volume (liter per unit), by Country 2024 & 2032
- Figure 81: Middle East and Africa Can Coatings Market Revenue Share (%), by Country 2024 & 2032
- Figure 82: Middle East and Africa Can Coatings Market Volume Share (%), by Country 2024 & 2032
List of Tables
- Table 1: Global Can Coatings Market Revenue Million Forecast, by Region 2019 & 2032
- Table 2: Global Can Coatings Market Volume liter per unit Forecast, by Region 2019 & 2032
- Table 3: Global Can Coatings Market Revenue Million Forecast, by Type 2019 & 2032
- Table 4: Global Can Coatings Market Volume liter per unit Forecast, by Type 2019 & 2032
- Table 5: Global Can Coatings Market Revenue Million Forecast, by Application 2019 & 2032
- Table 6: Global Can Coatings Market Volume liter per unit Forecast, by Application 2019 & 2032
- Table 7: Global Can Coatings Market Revenue Million Forecast, by Region 2019 & 2032
- Table 8: Global Can Coatings Market Volume liter per unit Forecast, by Region 2019 & 2032
- Table 9: Global Can Coatings Market Revenue Million Forecast, by Country 2019 & 2032
- Table 10: Global Can Coatings Market Volume liter per unit Forecast, by Country 2019 & 2032
- Table 11: United States Can Coatings Market Revenue (Million) Forecast, by Application 2019 & 2032
- Table 12: United States Can Coatings Market Volume (liter per unit) Forecast, by Application 2019 & 2032
- Table 13: Canada Can Coatings Market Revenue (Million) Forecast, by Application 2019 & 2032
- Table 14: Canada Can Coatings Market Volume (liter per unit) Forecast, by Application 2019 & 2032
- Table 15: Mexico Can Coatings Market Revenue (Million) Forecast, by Application 2019 & 2032
- Table 16: Mexico Can Coatings Market Volume (liter per unit) Forecast, by Application 2019 & 2032
- Table 17: Global Can Coatings Market Revenue Million Forecast, by Country 2019 & 2032
- Table 18: Global Can Coatings Market Volume liter per unit Forecast, by Country 2019 & 2032
- Table 19: Germany Can Coatings Market Revenue (Million) Forecast, by Application 2019 & 2032
- Table 20: Germany Can Coatings Market Volume (liter per unit) Forecast, by Application 2019 & 2032
- Table 21: United Kingdom Can Coatings Market Revenue (Million) Forecast, by Application 2019 & 2032
- Table 22: United Kingdom Can Coatings Market Volume (liter per unit) Forecast, by Application 2019 & 2032
- Table 23: France Can Coatings Market Revenue (Million) Forecast, by Application 2019 & 2032
- Table 24: France Can Coatings Market Volume (liter per unit) Forecast, by Application 2019 & 2032
- Table 25: Spain Can Coatings Market Revenue (Million) Forecast, by Application 2019 & 2032
- Table 26: Spain Can Coatings Market Volume (liter per unit) Forecast, by Application 2019 & 2032
- Table 27: Italy Can Coatings Market Revenue (Million) Forecast, by Application 2019 & 2032
- Table 28: Italy Can Coatings Market Volume (liter per unit) Forecast, by Application 2019 & 2032
- Table 29: Spain Can Coatings Market Revenue (Million) Forecast, by Application 2019 & 2032
- Table 30: Spain Can Coatings Market Volume (liter per unit) Forecast, by Application 2019 & 2032
- Table 31: Belgium Can Coatings Market Revenue (Million) Forecast, by Application 2019 & 2032
- Table 32: Belgium Can Coatings Market Volume (liter per unit) Forecast, by Application 2019 & 2032
- Table 33: Netherland Can Coatings Market Revenue (Million) Forecast, by Application 2019 & 2032
- Table 34: Netherland Can Coatings Market Volume (liter per unit) Forecast, by Application 2019 & 2032
- Table 35: Nordics Can Coatings Market Revenue (Million) Forecast, by Application 2019 & 2032
- Table 36: Nordics Can Coatings Market Volume (liter per unit) Forecast, by Application 2019 & 2032
- Table 37: Rest of Europe Can Coatings Market Revenue (Million) Forecast, by Application 2019 & 2032
- Table 38: Rest of Europe Can Coatings Market Volume (liter per unit) Forecast, by Application 2019 & 2032
- Table 39: Global Can Coatings Market Revenue Million Forecast, by Country 2019 & 2032
- Table 40: Global Can Coatings Market Volume liter per unit Forecast, by Country 2019 & 2032
- Table 41: China Can Coatings Market Revenue (Million) Forecast, by Application 2019 & 2032
- Table 42: China Can Coatings Market Volume (liter per unit) Forecast, by Application 2019 & 2032
- Table 43: Japan Can Coatings Market Revenue (Million) Forecast, by Application 2019 & 2032
- Table 44: Japan Can Coatings Market Volume (liter per unit) Forecast, by Application 2019 & 2032
- Table 45: India Can Coatings Market Revenue (Million) Forecast, by Application 2019 & 2032
- Table 46: India Can Coatings Market Volume (liter per unit) Forecast, by Application 2019 & 2032
- Table 47: South Korea Can Coatings Market Revenue (Million) Forecast, by Application 2019 & 2032
- Table 48: South Korea Can Coatings Market Volume (liter per unit) Forecast, by Application 2019 & 2032
- Table 49: Southeast Asia Can Coatings Market Revenue (Million) Forecast, by Application 2019 & 2032
- Table 50: Southeast Asia Can Coatings Market Volume (liter per unit) Forecast, by Application 2019 & 2032
- Table 51: Australia Can Coatings Market Revenue (Million) Forecast, by Application 2019 & 2032
- Table 52: Australia Can Coatings Market Volume (liter per unit) Forecast, by Application 2019 & 2032
- Table 53: Indonesia Can Coatings Market Revenue (Million) Forecast, by Application 2019 & 2032
- Table 54: Indonesia Can Coatings Market Volume (liter per unit) Forecast, by Application 2019 & 2032
- Table 55: Phillipes Can Coatings Market Revenue (Million) Forecast, by Application 2019 & 2032
- Table 56: Phillipes Can Coatings Market Volume (liter per unit) Forecast, by Application 2019 & 2032
- Table 57: Singapore Can Coatings Market Revenue (Million) Forecast, by Application 2019 & 2032
- Table 58: Singapore Can Coatings Market Volume (liter per unit) Forecast, by Application 2019 & 2032
- Table 59: Thailandc Can Coatings Market Revenue (Million) Forecast, by Application 2019 & 2032
- Table 60: Thailandc Can Coatings Market Volume (liter per unit) Forecast, by Application 2019 & 2032
- Table 61: Rest of Asia Pacific Can Coatings Market Revenue (Million) Forecast, by Application 2019 & 2032
- Table 62: Rest of Asia Pacific Can Coatings Market Volume (liter per unit) Forecast, by Application 2019 & 2032
- Table 63: Global Can Coatings Market Revenue Million Forecast, by Country 2019 & 2032
- Table 64: Global Can Coatings Market Volume liter per unit Forecast, by Country 2019 & 2032
- Table 65: Brazil Can Coatings Market Revenue (Million) Forecast, by Application 2019 & 2032
- Table 66: Brazil Can Coatings Market Volume (liter per unit) Forecast, by Application 2019 & 2032
- Table 67: Argentina Can Coatings Market Revenue (Million) Forecast, by Application 2019 & 2032
- Table 68: Argentina Can Coatings Market Volume (liter per unit) Forecast, by Application 2019 & 2032
- Table 69: Peru Can Coatings Market Revenue (Million) Forecast, by Application 2019 & 2032
- Table 70: Peru Can Coatings Market Volume (liter per unit) Forecast, by Application 2019 & 2032
- Table 71: Chile Can Coatings Market Revenue (Million) Forecast, by Application 2019 & 2032
- Table 72: Chile Can Coatings Market Volume (liter per unit) Forecast, by Application 2019 & 2032
- Table 73: Colombia Can Coatings Market Revenue (Million) Forecast, by Application 2019 & 2032
- Table 74: Colombia Can Coatings Market Volume (liter per unit) Forecast, by Application 2019 & 2032
- Table 75: Ecuador Can Coatings Market Revenue (Million) Forecast, by Application 2019 & 2032
- Table 76: Ecuador Can Coatings Market Volume (liter per unit) Forecast, by Application 2019 & 2032
- Table 77: Venezuela Can Coatings Market Revenue (Million) Forecast, by Application 2019 & 2032
- Table 78: Venezuela Can Coatings Market Volume (liter per unit) Forecast, by Application 2019 & 2032
- Table 79: Rest of South America Can Coatings Market Revenue (Million) Forecast, by Application 2019 & 2032
- Table 80: Rest of South America Can Coatings Market Volume (liter per unit) Forecast, by Application 2019 & 2032
- Table 81: Global Can Coatings Market Revenue Million Forecast, by Country 2019 & 2032
- Table 82: Global Can Coatings Market Volume liter per unit Forecast, by Country 2019 & 2032
- Table 83: United Arab Emirates Can Coatings Market Revenue (Million) Forecast, by Application 2019 & 2032
- Table 84: United Arab Emirates Can Coatings Market Volume (liter per unit) Forecast, by Application 2019 & 2032
- Table 85: Saudi Arabia Can Coatings Market Revenue (Million) Forecast, by Application 2019 & 2032
- Table 86: Saudi Arabia Can Coatings Market Volume (liter per unit) Forecast, by Application 2019 & 2032
- Table 87: South Africa Can Coatings Market Revenue (Million) Forecast, by Application 2019 & 2032
- Table 88: South Africa Can Coatings Market Volume (liter per unit) Forecast, by Application 2019 & 2032
- Table 89: Rest of Middle East and Africa Can Coatings Market Revenue (Million) Forecast, by Application 2019 & 2032
- Table 90: Rest of Middle East and Africa Can Coatings Market Volume (liter per unit) Forecast, by Application 2019 & 2032
- Table 91: Global Can Coatings Market Revenue Million Forecast, by Type 2019 & 2032
- Table 92: Global Can Coatings Market Volume liter per unit Forecast, by Type 2019 & 2032
- Table 93: Global Can Coatings Market Revenue Million Forecast, by Application 2019 & 2032
- Table 94: Global Can Coatings Market Volume liter per unit Forecast, by Application 2019 & 2032
- Table 95: Global Can Coatings Market Revenue Million Forecast, by Country 2019 & 2032
- Table 96: Global Can Coatings Market Volume liter per unit Forecast, by Country 2019 & 2032
- Table 97: China Can Coatings Market Revenue (Million) Forecast, by Application 2019 & 2032
- Table 98: China Can Coatings Market Volume (liter per unit) Forecast, by Application 2019 & 2032
- Table 99: India Can Coatings Market Revenue (Million) Forecast, by Application 2019 & 2032
- Table 100: India Can Coatings Market Volume (liter per unit) Forecast, by Application 2019 & 2032
- Table 101: Japan Can Coatings Market Revenue (Million) Forecast, by Application 2019 & 2032
- Table 102: Japan Can Coatings Market Volume (liter per unit) Forecast, by Application 2019 & 2032
- Table 103: South Korea Can Coatings Market Revenue (Million) Forecast, by Application 2019 & 2032
- Table 104: South Korea Can Coatings Market Volume (liter per unit) Forecast, by Application 2019 & 2032
- Table 105: Indonesia Can Coatings Market Revenue (Million) Forecast, by Application 2019 & 2032
- Table 106: Indonesia Can Coatings Market Volume (liter per unit) Forecast, by Application 2019 & 2032
- Table 107: Malaysia Can Coatings Market Revenue (Million) Forecast, by Application 2019 & 2032
- Table 108: Malaysia Can Coatings Market Volume (liter per unit) Forecast, by Application 2019 & 2032
- Table 109: Thailand Can Coatings Market Revenue (Million) Forecast, by Application 2019 & 2032
- Table 110: Thailand Can Coatings Market Volume (liter per unit) Forecast, by Application 2019 & 2032
- Table 111: Vietnam Can Coatings Market Revenue (Million) Forecast, by Application 2019 & 2032
- Table 112: Vietnam Can Coatings Market Volume (liter per unit) Forecast, by Application 2019 & 2032
- Table 113: Rest of Asia Pacific Can Coatings Market Revenue (Million) Forecast, by Application 2019 & 2032
- Table 114: Rest of Asia Pacific Can Coatings Market Volume (liter per unit) Forecast, by Application 2019 & 2032
- Table 115: Global Can Coatings Market Revenue Million Forecast, by Type 2019 & 2032
- Table 116: Global Can Coatings Market Volume liter per unit Forecast, by Type 2019 & 2032
- Table 117: Global Can Coatings Market Revenue Million Forecast, by Application 2019 & 2032
- Table 118: Global Can Coatings Market Volume liter per unit Forecast, by Application 2019 & 2032
- Table 119: Global Can Coatings Market Revenue Million Forecast, by Country 2019 & 2032
- Table 120: Global Can Coatings Market Volume liter per unit Forecast, by Country 2019 & 2032
- Table 121: United States Can Coatings Market Revenue (Million) Forecast, by Application 2019 & 2032
- Table 122: United States Can Coatings Market Volume (liter per unit) Forecast, by Application 2019 & 2032
- Table 123: Canada Can Coatings Market Revenue (Million) Forecast, by Application 2019 & 2032
- Table 124: Canada Can Coatings Market Volume (liter per unit) Forecast, by Application 2019 & 2032
- Table 125: Mexico Can Coatings Market Revenue (Million) Forecast, by Application 2019 & 2032
- Table 126: Mexico Can Coatings Market Volume (liter per unit) Forecast, by Application 2019 & 2032
- Table 127: Global Can Coatings Market Revenue Million Forecast, by Type 2019 & 2032
- Table 128: Global Can Coatings Market Volume liter per unit Forecast, by Type 2019 & 2032
- Table 129: Global Can Coatings Market Revenue Million Forecast, by Application 2019 & 2032
- Table 130: Global Can Coatings Market Volume liter per unit Forecast, by Application 2019 & 2032
- Table 131: Global Can Coatings Market Revenue Million Forecast, by Country 2019 & 2032
- Table 132: Global Can Coatings Market Volume liter per unit Forecast, by Country 2019 & 2032
- Table 133: Germany Can Coatings Market Revenue (Million) Forecast, by Application 2019 & 2032
- Table 134: Germany Can Coatings Market Volume (liter per unit) Forecast, by Application 2019 & 2032
- Table 135: United Kingdom Can Coatings Market Revenue (Million) Forecast, by Application 2019 & 2032
- Table 136: United Kingdom Can Coatings Market Volume (liter per unit) Forecast, by Application 2019 & 2032
- Table 137: France Can Coatings Market Revenue (Million) Forecast, by Application 2019 & 2032
- Table 138: France Can Coatings Market Volume (liter per unit) Forecast, by Application 2019 & 2032
- Table 139: Italy Can Coatings Market Revenue (Million) Forecast, by Application 2019 & 2032
- Table 140: Italy Can Coatings Market Volume (liter per unit) Forecast, by Application 2019 & 2032
- Table 141: Spain Can Coatings Market Revenue (Million) Forecast, by Application 2019 & 2032
- Table 142: Spain Can Coatings Market Volume (liter per unit) Forecast, by Application 2019 & 2032
- Table 143: Russia Can Coatings Market Revenue (Million) Forecast, by Application 2019 & 2032
- Table 144: Russia Can Coatings Market Volume (liter per unit) Forecast, by Application 2019 & 2032
- Table 145: Turkey Can Coatings Market Revenue (Million) Forecast, by Application 2019 & 2032
- Table 146: Turkey Can Coatings Market Volume (liter per unit) Forecast, by Application 2019 & 2032
- Table 147: NORDIC Countries Can Coatings Market Revenue (Million) Forecast, by Application 2019 & 2032
- Table 148: NORDIC Countries Can Coatings Market Volume (liter per unit) Forecast, by Application 2019 & 2032
- Table 149: Rest of Europe Can Coatings Market Revenue (Million) Forecast, by Application 2019 & 2032
- Table 150: Rest of Europe Can Coatings Market Volume (liter per unit) Forecast, by Application 2019 & 2032
- Table 151: Global Can Coatings Market Revenue Million Forecast, by Type 2019 & 2032
- Table 152: Global Can Coatings Market Volume liter per unit Forecast, by Type 2019 & 2032
- Table 153: Global Can Coatings Market Revenue Million Forecast, by Application 2019 & 2032
- Table 154: Global Can Coatings Market Volume liter per unit Forecast, by Application 2019 & 2032
- Table 155: Global Can Coatings Market Revenue Million Forecast, by Country 2019 & 2032
- Table 156: Global Can Coatings Market Volume liter per unit Forecast, by Country 2019 & 2032
- Table 157: Brazil Can Coatings Market Revenue (Million) Forecast, by Application 2019 & 2032
- Table 158: Brazil Can Coatings Market Volume (liter per unit) Forecast, by Application 2019 & 2032
- Table 159: Argentina Can Coatings Market Revenue (Million) Forecast, by Application 2019 & 2032
- Table 160: Argentina Can Coatings Market Volume (liter per unit) Forecast, by Application 2019 & 2032
- Table 161: Colombia Can Coatings Market Revenue (Million) Forecast, by Application 2019 & 2032
- Table 162: Colombia Can Coatings Market Volume (liter per unit) Forecast, by Application 2019 & 2032
- Table 163: Rest of South America Can Coatings Market Revenue (Million) Forecast, by Application 2019 & 2032
- Table 164: Rest of South America Can Coatings Market Volume (liter per unit) Forecast, by Application 2019 & 2032
- Table 165: Global Can Coatings Market Revenue Million Forecast, by Type 2019 & 2032
- Table 166: Global Can Coatings Market Volume liter per unit Forecast, by Type 2019 & 2032
- Table 167: Global Can Coatings Market Revenue Million Forecast, by Application 2019 & 2032
- Table 168: Global Can Coatings Market Volume liter per unit Forecast, by Application 2019 & 2032
- Table 169: Global Can Coatings Market Revenue Million Forecast, by Country 2019 & 2032
- Table 170: Global Can Coatings Market Volume liter per unit Forecast, by Country 2019 & 2032
- Table 171: Saudi Arabia Can Coatings Market Revenue (Million) Forecast, by Application 2019 & 2032
- Table 172: Saudi Arabia Can Coatings Market Volume (liter per unit) Forecast, by Application 2019 & 2032
- Table 173: South Africa Can Coatings Market Revenue (Million) Forecast, by Application 2019 & 2032
- Table 174: South Africa Can Coatings Market Volume (liter per unit) Forecast, by Application 2019 & 2032
- Table 175: Qatar Can Coatings Market Revenue (Million) Forecast, by Application 2019 & 2032
- Table 176: Qatar Can Coatings Market Volume (liter per unit) Forecast, by Application 2019 & 2032
- Table 177: UAE Can Coatings Market Revenue (Million) Forecast, by Application 2019 & 2032
- Table 178: UAE Can Coatings Market Volume (liter per unit) Forecast, by Application 2019 & 2032
- Table 179: Egypt Can Coatings Market Revenue (Million) Forecast, by Application 2019 & 2032
- Table 180: Egypt Can Coatings Market Volume (liter per unit) Forecast, by Application 2019 & 2032
- Table 181: Algeria Can Coatings Market Revenue (Million) Forecast, by Application 2019 & 2032
- Table 182: Algeria Can Coatings Market Volume (liter per unit) Forecast, by Application 2019 & 2032
- Table 183: Rest of Middle East and Africa Can Coatings Market Revenue (Million) Forecast, by Application 2019 & 2032
- Table 184: Rest of Middle East and Africa Can Coatings Market Volume (liter per unit) Forecast, by Application 2019 & 2032
Frequently Asked Questions
1. What is the projected Compound Annual Growth Rate (CAGR) of the Can Coatings Market?
The projected CAGR is approximately > 4.50%.
2. Which companies are prominent players in the Can Coatings Market?
Key companies in the market include The Sherwin-Williams Company, TIGER Coatings GmbH & Co KG, RPM International Inc, Kansai Paint Co Ltd, IPC GmbH & Co KG, PPG Industries Inc, TOYOCHEM CO LTD, VPL Coatings GmbH & Co KG*List Not Exhaustive, Axalta Coating Systems, Akzo Nobel N V, National Paints Factories Co Ltd, Kupsa Coatings.
3. What are the main segments of the Can Coatings Market?
The market segments include Type, Application.
4. Can you provide details about the market size?
The market size is estimated to be USD 5.52 Million as of 2022.
5. What are some drivers contributing to market growth?
Increasing Demand from Food and Beverage Packaging; Growing Utilization of Aerosol Cans for Personal Care Industry.
6. What are the notable trends driving market growth?
Beverage Cans to Dominate the market.
7. Are there any restraints impacting market growth?
Stringent VOC Regulatory Policies; Other Restraints.
8. Can you provide examples of recent developments in the market?
November 2023: AkzoNobel will invest EUR 32 million (~USD 34.99 million) in a new factory at its Vilafranca site to manufacture bisphenol-free coatings for the metal packaging industry in EMEA (Europe, Middle East, and Africa). The facility will use advanced automation and has been designed to meet high eco-efficiency requirements, allowing the company to achieve significant improvements in energy and material economy. It is projected to be operational by the middle of 2025.
9. What pricing options are available for accessing the report?
Pricing options include single-user, multi-user, and enterprise licenses priced at USD 4750, USD 5250, and USD 8750 respectively.
10. Is the market size provided in terms of value or volume?
The market size is provided in terms of value, measured in Million and volume, measured in liter per unit.
11. Are there any specific market keywords associated with the report?
Yes, the market keyword associated with the report is "Can Coatings Market," which aids in identifying and referencing the specific market segment covered.
12. How do I determine which pricing option suits my needs best?
The pricing options vary based on user requirements and access needs. Individual users may opt for single-user licenses, while businesses requiring broader access may choose multi-user or enterprise licenses for cost-effective access to the report.
13. Are there any additional resources or data provided in the Can Coatings Market report?
While the report offers comprehensive insights, it's advisable to review the specific contents or supplementary materials provided to ascertain if additional resources or data are available.
14. How can I stay updated on further developments or reports in the Can Coatings Market?
To stay informed about further developments, trends, and reports in the Can Coatings Market, consider subscribing to industry newsletters, following relevant companies and organizations, or regularly checking reputable industry news sources and publications.
Methodology
Step 1 - Identification of Relevant Samples Size from Population Database


Step 2 - Approaches for Defining Global Market Size (Value, Volume* & Price*)

Note*: In applicable scenarios
Step 3 - Data Sources
Primary Research
- Web Analytics
- Survey Reports
- Research Institute
- Latest Research Reports
- Opinion Leaders
Secondary Research
- Annual Reports
- White Paper
- Latest Press Release
- Industry Association
- Paid Database
- Investor Presentations

Step 4 - Data Triangulation
Involves using different sources of information in order to increase the validity of a study
These sources are likely to be stakeholders in a program - participants, other researchers, program staff, other community members, and so on.
Then we put all data in single framework & apply various statistical tools to find out the dynamic on the market.
During the analysis stage, feedback from the stakeholder groups would be compared to determine areas of agreement as well as areas of divergence


