

Key Insights
The global building intercom systems market is poised for significant expansion, driven by an escalating demand for advanced security and communication solutions across residential and commercial properties. The market encompasses a spectrum of technologies, from conventional wired systems to sophisticated IP-based solutions featuring video surveillance, remote access, and seamless integration with smart home ecosystems. This technological evolution is a primary catalyst for market growth. Furthermore, increasing urbanization and robust construction activities globally are key drivers contributing to the market's upward trajectory. Despite potential challenges such as initial investment costs for advanced systems and cybersecurity concerns, the market outlook remains highly favorable. The market is projected to reach $10.04 billion by 2025, with an anticipated Compound Annual Growth Rate (CAGR) of 12.57% from the base year 2025 through 2033. This growth will be propelled by expanding adoption in emerging economies and continuous technological advancements enhancing functionality and user experience.
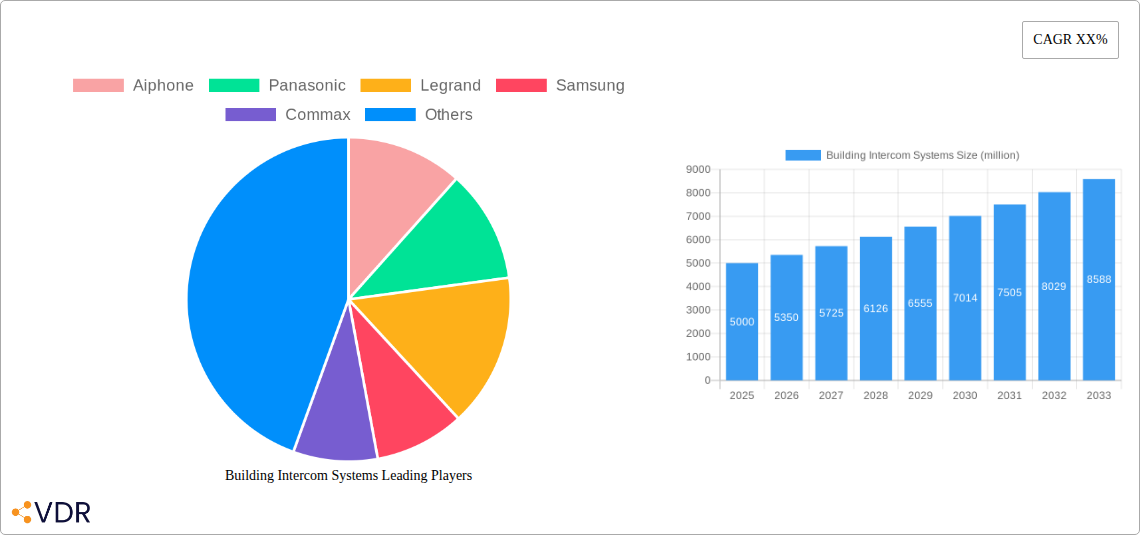
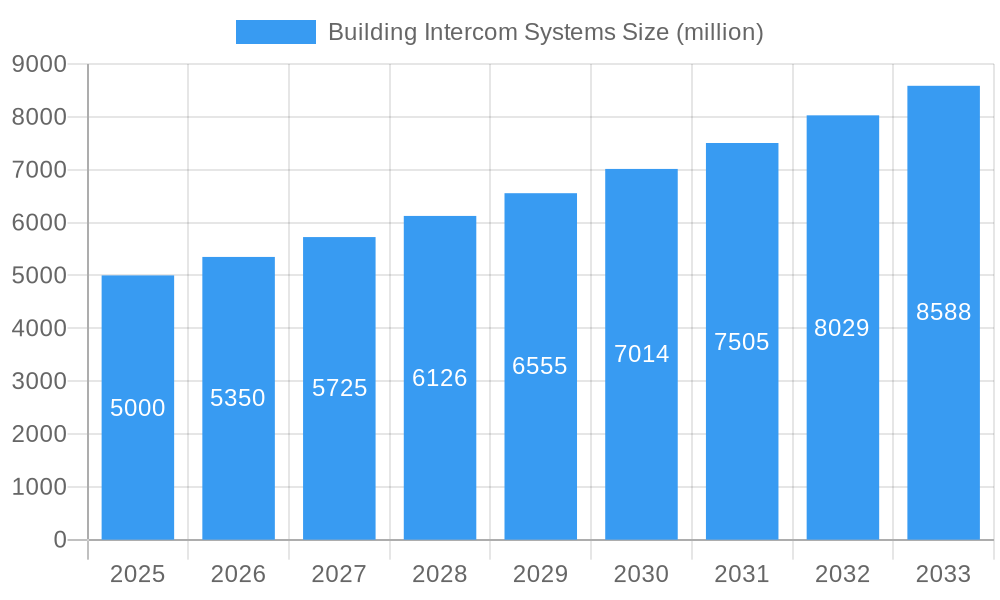
Building Intercom Systems Market Size (In Billion)
Leading companies, including Aiphone, Panasonic, Legrand, and Samsung, are at the vanguard of innovation, consistently refining their product portfolios to meet dynamic market requirements. The market is segmented by technology (wired, wireless, IP-based), application (residential, commercial), and geography. The competitive arena features both established industry leaders and agile new entrants competing for market share. The growing integration of building intercom systems with other smart building technologies, such as access control and comprehensive security management platforms, presents substantial growth avenues. This synergy enhances operational efficiency and facilitates a unified security strategy, making it an attractive proposition for property owners and managers seeking integrated solutions. Continued investment in research and development aimed at delivering cost-effective and user-friendly solutions will define the future landscape of the building intercom systems market.
Building Intercom Systems Company Market Share
Building Intercom Systems Market Report: 2019-2033
This comprehensive report provides an in-depth analysis of the global building intercom systems market, offering invaluable insights for industry professionals, investors, and strategic decision-makers. The study covers the period from 2019 to 2033, with a focus on the forecast period of 2025-2033, using 2025 as the base year and estimated year. The report segments the market by various factors (specific segmentation details are provided within the report) and analyzes key players such as Aiphone, Panasonic, Legrand, Samsung, and others. The market is expected to reach xx million units by 2033, showcasing significant growth potential.
Building Intercom Systems Market Dynamics & Structure
This section analyzes the competitive landscape, technological advancements, and regulatory influences shaping the building intercom systems market. The market is moderately concentrated, with key players holding significant market share. However, the emergence of innovative technologies and new entrants is increasing competition.
- Market Concentration: The top 5 players hold an estimated xx% market share in 2025. This is expected to slightly decrease to xx% by 2033 due to increased competition.
- Technological Innovation: The integration of IP-based systems, cloud connectivity, and advanced security features are major drivers of innovation. Barriers include high R&D costs and the need for interoperability standards.
- Regulatory Frameworks: Building codes and safety regulations influence product design and adoption rates, varying across regions.
- Competitive Product Substitutes: Alternatives like mobile communication apps present competitive pressures, though dedicated intercom systems offer enhanced security and reliability.
- End-User Demographics: The market is driven by residential, commercial, and industrial building construction, with growth potential across all segments. Demand is influenced by factors such as building size, security needs, and budget.
- M&A Trends: The number of M&A deals in the industry averaged xx per year during the historical period (2019-2024), indicating consolidation and strategic expansion among key players.
Building Intercom Systems Growth Trends & Insights
The global building intercom systems market experienced steady growth during the historical period (2019-2024), driven by factors such as increasing urbanization, rising construction activity, and the growing adoption of smart home technologies. The market size reached xx million units in 2024 and is projected to achieve a compound annual growth rate (CAGR) of xx% during the forecast period (2025-2033). This growth is fueled by a combination of factors: increased demand for enhanced security systems in residential and commercial buildings, technological advancements leading to improved functionalities and user experience, and government initiatives promoting smart city development. The market penetration rate is expected to increase from xx% in 2025 to xx% in 2033.
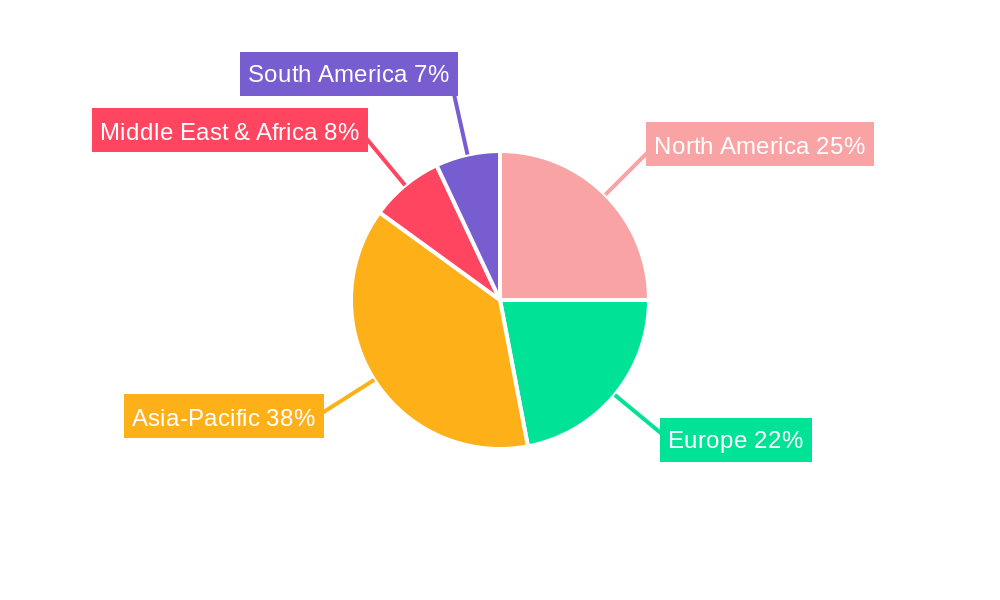
Dominant Regions, Countries, or Segments in Building Intercom Systems
The North American and European markets have traditionally been dominant, but rapid growth in Asia-Pacific regions is reshaping the landscape. China and India are exhibiting significant growth potential due to increased construction activity and rising disposable incomes.
- Key Drivers:
- Strong economic growth in developing nations
- Increasing government investments in infrastructure development
- Favorable regulatory environments in certain regions
- Growing adoption of smart building technologies
- Dominance Factors: High construction rates, strong demand for security, and established technological infrastructure in certain regions contribute to market dominance. North America maintains a strong lead due to high adoption rates and advanced technology integration.
Building Intercom Systems Product Landscape
Building intercom systems now encompass a wide range of products, from traditional wired systems to advanced IP-based solutions offering features like video surveillance, remote access, and integration with other smart home devices. The focus is shifting towards wireless and cloud-based solutions, offering greater flexibility and scalability. Technological advancements are concentrated on improving audio and video quality, enhancing security features (e.g., encryption), and creating user-friendly interfaces. Unique selling propositions frequently include superior connectivity, seamless integration with other systems, and advanced security features.
Key Drivers, Barriers & Challenges in Building Intercom Systems
Key Drivers:
- Rising urbanization and construction activities
- Increasing demand for security and safety features in buildings
- Advancements in technology, such as IP-based and cloud-based systems
- Government initiatives promoting smart city development
Challenges and Restraints:
- High initial investment costs can hinder adoption, particularly in smaller projects. This translates to a slower growth rate for some developing regions.
- Complexity of installation and integration with existing building systems presents hurdles.
- Intense competition among established players and new entrants puts downward pressure on pricing.
- Supply chain disruptions, especially concerning electronic components, can lead to project delays and increased costs.
Emerging Opportunities in Building Intercom Systems
Emerging opportunities lie in:
- Expansion into untapped markets (e.g., developing countries in Africa and Latin America)
- Development of specialized intercom systems for niche applications (e.g., healthcare, education)
- Integration with other smart home and building management systems
- Growing adoption of wireless and cloud-based solutions to simplify installation.
Growth Accelerators in the Building Intercom Systems Industry
Technological innovation, strategic partnerships, and market expansion strategies are key growth accelerators. The development of more user-friendly and feature-rich systems, particularly those with advanced security and integration capabilities, will drive future adoption. Strategic alliances between intercom system manufacturers and building automation companies are expected to expand market reach. Aggressive expansion into developing economies is another major accelerator.
Key Players Shaping the Building Intercom Systems Market
Notable Milestones in Building Intercom Systems Sector
- 2020: Increased adoption of IP-based intercom systems driven by the need for remote access and improved security.
- 2022: Several key players launched cloud-based intercom solutions, enhancing scalability and remote management capabilities.
- 2023: Significant investments in R&D focused on improving integration with smart home ecosystems.
- 2024: Several mergers and acquisitions consolidated market share among leading players. (Specific details provided in the full report.)
In-Depth Building Intercom Systems Market Outlook
The building intercom systems market is poised for continued growth, driven by technological advancements and a growing preference for enhanced security features. The market is expected to witness significant expansion, particularly in developing economies. Strategic partnerships, expansion into niche markets, and development of innovative solutions will be key success factors for market players in the coming years. The integration of artificial intelligence and machine learning will play an increasingly important role in enhancing the functionality and user experience of these systems.
Building Intercom Systems Segmentation
-
1. Application
- 1.1. Commercial Construction
- 1.2. Apartment House
-
2. Types
- 2.1. Audio Intercom System
- 2.2. Video Intercom System
Building Intercom Systems Segmentation By Geography
-
1. North America
- 1.1. United States
- 1.2. Canada
- 1.3. Mexico
-
2. South America
- 2.1. Brazil
- 2.2. Argentina
- 2.3. Rest of South America
-
3. Europe
- 3.1. United Kingdom
- 3.2. Germany
- 3.3. France
- 3.4. Italy
- 3.5. Spain
- 3.6. Russia
- 3.7. Benelux
- 3.8. Nordics
- 3.9. Rest of Europe
-
4. Middle East & Africa
- 4.1. Turkey
- 4.2. Israel
- 4.3. GCC
- 4.4. North Africa
- 4.5. South Africa
- 4.6. Rest of Middle East & Africa
-
5. Asia Pacific
- 5.1. China
- 5.2. India
- 5.3. Japan
- 5.4. South Korea
- 5.5. ASEAN
- 5.6. Oceania
- 5.7. Rest of Asia Pacific
Building Intercom Systems Regional Market Share
Geographic Coverage of Building Intercom Systems
Building Intercom Systems REPORT HIGHLIGHTS
| Aspects | Details |
|---|---|
| Study Period | 2020-2034 |
| Base Year | 2025 |
| Estimated Year | 2026 |
| Forecast Period | 2026-2034 |
| Historical Period | 2020-2025 |
| Growth Rate | CAGR of 12.57% from 2020-2034 |
| Segmentation |
|
Table of Contents
- 1. Introduction
- 1.1. Research Scope
- 1.2. Market Segmentation
- 1.3. Research Objective
- 1.4. Definitions and Assumptions
- 2. Executive Summary
- 2.1. Market Snapshot
- 3. Market Dynamics
- 3.1. Market Drivers
- 3.2. Market Restrains
- 3.3. Market Trends
- 3.4. Market Opportunities
- 4. Market Factor Analysis
- 4.1. Porters Five Forces
- 4.1.1. Bargaining Power of Suppliers
- 4.1.2. Bargaining Power of Buyers
- 4.1.3. Threat of New Entrants
- 4.1.4. Threat of Substitutes
- 4.1.5. Competitive Rivalry
- 4.2. PESTEL analysis
- 4.3. BCG Analysis
- 4.3.1. Stars (High Growth, High Market Share)
- 4.3.2. Cash Cows (Low Growth, High Market Share)
- 4.3.3. Question Mark (High Growth, Low Market Share)
- 4.3.4. Dogs (Low Growth, Low Market Share)
- 4.4. Ansoff Matrix Analysis
- 4.5. Supply Chain Analysis
- 4.6. Regulatory Landscape
- 4.7. Current Market Potential and Opportunity Assessment (TAM–SAM–SOM Framework)
- 4.8. VDR Analyst Note
- 4.1. Porters Five Forces
- 5. Market Analysis, Insights and Forecast 2021-2033
- 5.1. Market Analysis, Insights and Forecast - by Application
- 5.1.1. Commercial Construction
- 5.1.2. Apartment House
- 5.2. Market Analysis, Insights and Forecast - by Types
- 5.2.1. Audio Intercom System
- 5.2.2. Video Intercom System
- 5.3. Market Analysis, Insights and Forecast - by Region
- 5.3.1. North America
- 5.3.2. South America
- 5.3.3. Europe
- 5.3.4. Middle East & Africa
- 5.3.5. Asia Pacific
- 5.1. Market Analysis, Insights and Forecast - by Application
- 6. Global Building Intercom Systems Analysis, Insights and Forecast, 2021-2033
- 6.1. Market Analysis, Insights and Forecast - by Application
- 6.1.1. Commercial Construction
- 6.1.2. Apartment House
- 6.2. Market Analysis, Insights and Forecast - by Types
- 6.2.1. Audio Intercom System
- 6.2.2. Video Intercom System
- 6.1. Market Analysis, Insights and Forecast - by Application
- 7. North America Building Intercom Systems Analysis, Insights and Forecast, 2021-2033
- 7.1. Market Analysis, Insights and Forecast - by Application
- 7.1.1. Commercial Construction
- 7.1.2. Apartment House
- 7.2. Market Analysis, Insights and Forecast - by Types
- 7.2.1. Audio Intercom System
- 7.2.2. Video Intercom System
- 7.1. Market Analysis, Insights and Forecast - by Application
- 8. South America Building Intercom Systems Analysis, Insights and Forecast, 2021-2033
- 8.1. Market Analysis, Insights and Forecast - by Application
- 8.1.1. Commercial Construction
- 8.1.2. Apartment House
- 8.2. Market Analysis, Insights and Forecast - by Types
- 8.2.1. Audio Intercom System
- 8.2.2. Video Intercom System
- 8.1. Market Analysis, Insights and Forecast - by Application
- 9. Europe Building Intercom Systems Analysis, Insights and Forecast, 2021-2033
- 9.1. Market Analysis, Insights and Forecast - by Application
- 9.1.1. Commercial Construction
- 9.1.2. Apartment House
- 9.2. Market Analysis, Insights and Forecast - by Types
- 9.2.1. Audio Intercom System
- 9.2.2. Video Intercom System
- 9.1. Market Analysis, Insights and Forecast - by Application
- 10. Middle East & Africa Building Intercom Systems Analysis, Insights and Forecast, 2021-2033
- 10.1. Market Analysis, Insights and Forecast - by Application
- 10.1.1. Commercial Construction
- 10.1.2. Apartment House
- 10.2. Market Analysis, Insights and Forecast - by Types
- 10.2.1. Audio Intercom System
- 10.2.2. Video Intercom System
- 10.1. Market Analysis, Insights and Forecast - by Application
- 11. Asia Pacific Building Intercom Systems Analysis, Insights and Forecast, 2021-2033
- 11.1. Market Analysis, Insights and Forecast - by Application
- 11.1.1. Commercial Construction
- 11.1.2. Apartment House
- 11.2. Market Analysis, Insights and Forecast - by Types
- 11.2.1. Audio Intercom System
- 11.2.2. Video Intercom System
- 11.1. Market Analysis, Insights and Forecast - by Application
- 12. Competitive Analysis
- 12.1. Company Profiles
- 12.1.1 Aiphone
- 12.1.1.1. Company Overview
- 12.1.1.2. Products
- 12.1.1.3. Company Financials
- 12.1.1.4. SWOT Analysis
- 12.1.2 Panasonic
- 12.1.2.1. Company Overview
- 12.1.2.2. Products
- 12.1.2.3. Company Financials
- 12.1.2.4. SWOT Analysis
- 12.1.3 Legrand
- 12.1.3.1. Company Overview
- 12.1.3.2. Products
- 12.1.3.3. Company Financials
- 12.1.3.4. SWOT Analysis
- 12.1.4 Samsung
- 12.1.4.1. Company Overview
- 12.1.4.2. Products
- 12.1.4.3. Company Financials
- 12.1.4.4. SWOT Analysis
- 12.1.5 Commax
- 12.1.5.1. Company Overview
- 12.1.5.2. Products
- 12.1.5.3. Company Financials
- 12.1.5.4. SWOT Analysis
- 12.1.6 ABB
- 12.1.6.1. Company Overview
- 12.1.6.2. Products
- 12.1.6.3. Company Financials
- 12.1.6.4. SWOT Analysis
- 12.1.7 Guangdong Anjubao
- 12.1.7.1. Company Overview
- 12.1.7.2. Products
- 12.1.7.3. Company Financials
- 12.1.7.4. SWOT Analysis
- 12.1.8 TCS
- 12.1.8.1. Company Overview
- 12.1.8.2. Products
- 12.1.8.3. Company Financials
- 12.1.8.4. SWOT Analysis
- 12.1.9 Fermax
- 12.1.9.1. Company Overview
- 12.1.9.2. Products
- 12.1.9.3. Company Financials
- 12.1.9.4. SWOT Analysis
- 12.1.10 Aurine Technology
- 12.1.10.1. Company Overview
- 12.1.10.2. Products
- 12.1.10.3. Company Financials
- 12.1.10.4. SWOT Analysis
- 12.1.11 Honeywell
- 12.1.11.1. Company Overview
- 12.1.11.2. Products
- 12.1.11.3. Company Financials
- 12.1.11.4. SWOT Analysis
- 12.1.12 Siedle
- 12.1.12.1. Company Overview
- 12.1.12.2. Products
- 12.1.12.3. Company Financials
- 12.1.12.4. SWOT Analysis
- 12.1.13 Urmet
- 12.1.13.1. Company Overview
- 12.1.13.2. Products
- 12.1.13.3. Company Financials
- 12.1.13.4. SWOT Analysis
- 12.1.14 Comelit Group
- 12.1.14.1. Company Overview
- 12.1.14.2. Products
- 12.1.14.3. Company Financials
- 12.1.14.4. SWOT Analysis
- 12.1.15 Kocom
- 12.1.15.1. Company Overview
- 12.1.15.2. Products
- 12.1.15.3. Company Financials
- 12.1.15.4. SWOT Analysis
- 12.1.16 Nortek Security & Control
- 12.1.16.1. Company Overview
- 12.1.16.2. Products
- 12.1.16.3. Company Financials
- 12.1.16.4. SWOT Analysis
- 12.1.17 Axis
- 12.1.17.1. Company Overview
- 12.1.17.2. Products
- 12.1.17.3. Company Financials
- 12.1.17.4. SWOT Analysis
- 12.1.18 Zhuhai Taichuan
- 12.1.18.1. Company Overview
- 12.1.18.2. Products
- 12.1.18.3. Company Financials
- 12.1.18.4. SWOT Analysis
- 12.1.19 Leelen Technology
- 12.1.19.1. Company Overview
- 12.1.19.2. Products
- 12.1.19.3. Company Financials
- 12.1.19.4. SWOT Analysis
- 12.1.20 WRT Security System
- 12.1.20.1. Company Overview
- 12.1.20.2. Products
- 12.1.20.3. Company Financials
- 12.1.20.4. SWOT Analysis
- 12.1.21 ShenZhen SoBen
- 12.1.21.1. Company Overview
- 12.1.21.2. Products
- 12.1.21.3. Company Financials
- 12.1.21.4. SWOT Analysis
- 12.1.22 Doorking
- 12.1.22.1. Company Overview
- 12.1.22.2. Products
- 12.1.22.3. Company Financials
- 12.1.22.4. SWOT Analysis
- 12.1.23 Fujiang QSR
- 12.1.23.1. Company Overview
- 12.1.23.2. Products
- 12.1.23.3. Company Financials
- 12.1.23.4. SWOT Analysis
- 12.1.24 Zicom
- 12.1.24.1. Company Overview
- 12.1.24.2. Products
- 12.1.24.3. Company Financials
- 12.1.24.4. SWOT Analysis
- 12.1.25 Shenzhen Competition
- 12.1.25.1. Company Overview
- 12.1.25.2. Products
- 12.1.25.3. Company Financials
- 12.1.25.4. SWOT Analysis
- 12.1.26 Quanzhou Jiale
- 12.1.26.1. Company Overview
- 12.1.26.2. Products
- 12.1.26.3. Company Financials
- 12.1.26.4. SWOT Analysis
- 12.1.1 Aiphone
- 12.2. Market Entropy
- 12.2.1 Company's Key Areas Served
- 12.2.2 Recent Developments
- 12.3. Company Market Share Analysis 2025
- 12.3.1 Top 5 Companies Market Share Analysis
- 12.3.2 Top 3 Companies Market Share Analysis
- 12.4. List of Potential Customers
- 13. Research Methodology
List of Figures
- Figure 1: Global Building Intercom Systems Revenue Breakdown (billion, %) by Region 2025 & 2033
- Figure 2: Global Building Intercom Systems Volume Breakdown (K, %) by Region 2025 & 2033
- Figure 3: North America Building Intercom Systems Revenue (billion), by Application 2025 & 2033
- Figure 4: North America Building Intercom Systems Volume (K), by Application 2025 & 2033
- Figure 5: North America Building Intercom Systems Revenue Share (%), by Application 2025 & 2033
- Figure 6: North America Building Intercom Systems Volume Share (%), by Application 2025 & 2033
- Figure 7: North America Building Intercom Systems Revenue (billion), by Types 2025 & 2033
- Figure 8: North America Building Intercom Systems Volume (K), by Types 2025 & 2033
- Figure 9: North America Building Intercom Systems Revenue Share (%), by Types 2025 & 2033
- Figure 10: North America Building Intercom Systems Volume Share (%), by Types 2025 & 2033
- Figure 11: North America Building Intercom Systems Revenue (billion), by Country 2025 & 2033
- Figure 12: North America Building Intercom Systems Volume (K), by Country 2025 & 2033
- Figure 13: North America Building Intercom Systems Revenue Share (%), by Country 2025 & 2033
- Figure 14: North America Building Intercom Systems Volume Share (%), by Country 2025 & 2033
- Figure 15: South America Building Intercom Systems Revenue (billion), by Application 2025 & 2033
- Figure 16: South America Building Intercom Systems Volume (K), by Application 2025 & 2033
- Figure 17: South America Building Intercom Systems Revenue Share (%), by Application 2025 & 2033
- Figure 18: South America Building Intercom Systems Volume Share (%), by Application 2025 & 2033
- Figure 19: South America Building Intercom Systems Revenue (billion), by Types 2025 & 2033
- Figure 20: South America Building Intercom Systems Volume (K), by Types 2025 & 2033
- Figure 21: South America Building Intercom Systems Revenue Share (%), by Types 2025 & 2033
- Figure 22: South America Building Intercom Systems Volume Share (%), by Types 2025 & 2033
- Figure 23: South America Building Intercom Systems Revenue (billion), by Country 2025 & 2033
- Figure 24: South America Building Intercom Systems Volume (K), by Country 2025 & 2033
- Figure 25: South America Building Intercom Systems Revenue Share (%), by Country 2025 & 2033
- Figure 26: South America Building Intercom Systems Volume Share (%), by Country 2025 & 2033
- Figure 27: Europe Building Intercom Systems Revenue (billion), by Application 2025 & 2033
- Figure 28: Europe Building Intercom Systems Volume (K), by Application 2025 & 2033
- Figure 29: Europe Building Intercom Systems Revenue Share (%), by Application 2025 & 2033
- Figure 30: Europe Building Intercom Systems Volume Share (%), by Application 2025 & 2033
- Figure 31: Europe Building Intercom Systems Revenue (billion), by Types 2025 & 2033
- Figure 32: Europe Building Intercom Systems Volume (K), by Types 2025 & 2033
- Figure 33: Europe Building Intercom Systems Revenue Share (%), by Types 2025 & 2033
- Figure 34: Europe Building Intercom Systems Volume Share (%), by Types 2025 & 2033
- Figure 35: Europe Building Intercom Systems Revenue (billion), by Country 2025 & 2033
- Figure 36: Europe Building Intercom Systems Volume (K), by Country 2025 & 2033
- Figure 37: Europe Building Intercom Systems Revenue Share (%), by Country 2025 & 2033
- Figure 38: Europe Building Intercom Systems Volume Share (%), by Country 2025 & 2033
- Figure 39: Middle East & Africa Building Intercom Systems Revenue (billion), by Application 2025 & 2033
- Figure 40: Middle East & Africa Building Intercom Systems Volume (K), by Application 2025 & 2033
- Figure 41: Middle East & Africa Building Intercom Systems Revenue Share (%), by Application 2025 & 2033
- Figure 42: Middle East & Africa Building Intercom Systems Volume Share (%), by Application 2025 & 2033
- Figure 43: Middle East & Africa Building Intercom Systems Revenue (billion), by Types 2025 & 2033
- Figure 44: Middle East & Africa Building Intercom Systems Volume (K), by Types 2025 & 2033
- Figure 45: Middle East & Africa Building Intercom Systems Revenue Share (%), by Types 2025 & 2033
- Figure 46: Middle East & Africa Building Intercom Systems Volume Share (%), by Types 2025 & 2033
- Figure 47: Middle East & Africa Building Intercom Systems Revenue (billion), by Country 2025 & 2033
- Figure 48: Middle East & Africa Building Intercom Systems Volume (K), by Country 2025 & 2033
- Figure 49: Middle East & Africa Building Intercom Systems Revenue Share (%), by Country 2025 & 2033
- Figure 50: Middle East & Africa Building Intercom Systems Volume Share (%), by Country 2025 & 2033
- Figure 51: Asia Pacific Building Intercom Systems Revenue (billion), by Application 2025 & 2033
- Figure 52: Asia Pacific Building Intercom Systems Volume (K), by Application 2025 & 2033
- Figure 53: Asia Pacific Building Intercom Systems Revenue Share (%), by Application 2025 & 2033
- Figure 54: Asia Pacific Building Intercom Systems Volume Share (%), by Application 2025 & 2033
- Figure 55: Asia Pacific Building Intercom Systems Revenue (billion), by Types 2025 & 2033
- Figure 56: Asia Pacific Building Intercom Systems Volume (K), by Types 2025 & 2033
- Figure 57: Asia Pacific Building Intercom Systems Revenue Share (%), by Types 2025 & 2033
- Figure 58: Asia Pacific Building Intercom Systems Volume Share (%), by Types 2025 & 2033
- Figure 59: Asia Pacific Building Intercom Systems Revenue (billion), by Country 2025 & 2033
- Figure 60: Asia Pacific Building Intercom Systems Volume (K), by Country 2025 & 2033
- Figure 61: Asia Pacific Building Intercom Systems Revenue Share (%), by Country 2025 & 2033
- Figure 62: Asia Pacific Building Intercom Systems Volume Share (%), by Country 2025 & 2033
List of Tables
- Table 1: Global Building Intercom Systems Revenue billion Forecast, by Application 2020 & 2033
- Table 2: Global Building Intercom Systems Volume K Forecast, by Application 2020 & 2033
- Table 3: Global Building Intercom Systems Revenue billion Forecast, by Types 2020 & 2033
- Table 4: Global Building Intercom Systems Volume K Forecast, by Types 2020 & 2033
- Table 5: Global Building Intercom Systems Revenue billion Forecast, by Region 2020 & 2033
- Table 6: Global Building Intercom Systems Volume K Forecast, by Region 2020 & 2033
- Table 7: Global Building Intercom Systems Revenue billion Forecast, by Application 2020 & 2033
- Table 8: Global Building Intercom Systems Volume K Forecast, by Application 2020 & 2033
- Table 9: Global Building Intercom Systems Revenue billion Forecast, by Types 2020 & 2033
- Table 10: Global Building Intercom Systems Volume K Forecast, by Types 2020 & 2033
- Table 11: Global Building Intercom Systems Revenue billion Forecast, by Country 2020 & 2033
- Table 12: Global Building Intercom Systems Volume K Forecast, by Country 2020 & 2033
- Table 13: United States Building Intercom Systems Revenue (billion) Forecast, by Application 2020 & 2033
- Table 14: United States Building Intercom Systems Volume (K) Forecast, by Application 2020 & 2033
- Table 15: Canada Building Intercom Systems Revenue (billion) Forecast, by Application 2020 & 2033
- Table 16: Canada Building Intercom Systems Volume (K) Forecast, by Application 2020 & 2033
- Table 17: Mexico Building Intercom Systems Revenue (billion) Forecast, by Application 2020 & 2033
- Table 18: Mexico Building Intercom Systems Volume (K) Forecast, by Application 2020 & 2033
- Table 19: Global Building Intercom Systems Revenue billion Forecast, by Application 2020 & 2033
- Table 20: Global Building Intercom Systems Volume K Forecast, by Application 2020 & 2033
- Table 21: Global Building Intercom Systems Revenue billion Forecast, by Types 2020 & 2033
- Table 22: Global Building Intercom Systems Volume K Forecast, by Types 2020 & 2033
- Table 23: Global Building Intercom Systems Revenue billion Forecast, by Country 2020 & 2033
- Table 24: Global Building Intercom Systems Volume K Forecast, by Country 2020 & 2033
- Table 25: Brazil Building Intercom Systems Revenue (billion) Forecast, by Application 2020 & 2033
- Table 26: Brazil Building Intercom Systems Volume (K) Forecast, by Application 2020 & 2033
- Table 27: Argentina Building Intercom Systems Revenue (billion) Forecast, by Application 2020 & 2033
- Table 28: Argentina Building Intercom Systems Volume (K) Forecast, by Application 2020 & 2033
- Table 29: Rest of South America Building Intercom Systems Revenue (billion) Forecast, by Application 2020 & 2033
- Table 30: Rest of South America Building Intercom Systems Volume (K) Forecast, by Application 2020 & 2033
- Table 31: Global Building Intercom Systems Revenue billion Forecast, by Application 2020 & 2033
- Table 32: Global Building Intercom Systems Volume K Forecast, by Application 2020 & 2033
- Table 33: Global Building Intercom Systems Revenue billion Forecast, by Types 2020 & 2033
- Table 34: Global Building Intercom Systems Volume K Forecast, by Types 2020 & 2033
- Table 35: Global Building Intercom Systems Revenue billion Forecast, by Country 2020 & 2033
- Table 36: Global Building Intercom Systems Volume K Forecast, by Country 2020 & 2033
- Table 37: United Kingdom Building Intercom Systems Revenue (billion) Forecast, by Application 2020 & 2033
- Table 38: United Kingdom Building Intercom Systems Volume (K) Forecast, by Application 2020 & 2033
- Table 39: Germany Building Intercom Systems Revenue (billion) Forecast, by Application 2020 & 2033
- Table 40: Germany Building Intercom Systems Volume (K) Forecast, by Application 2020 & 2033
- Table 41: France Building Intercom Systems Revenue (billion) Forecast, by Application 2020 & 2033
- Table 42: France Building Intercom Systems Volume (K) Forecast, by Application 2020 & 2033
- Table 43: Italy Building Intercom Systems Revenue (billion) Forecast, by Application 2020 & 2033
- Table 44: Italy Building Intercom Systems Volume (K) Forecast, by Application 2020 & 2033
- Table 45: Spain Building Intercom Systems Revenue (billion) Forecast, by Application 2020 & 2033
- Table 46: Spain Building Intercom Systems Volume (K) Forecast, by Application 2020 & 2033
- Table 47: Russia Building Intercom Systems Revenue (billion) Forecast, by Application 2020 & 2033
- Table 48: Russia Building Intercom Systems Volume (K) Forecast, by Application 2020 & 2033
- Table 49: Benelux Building Intercom Systems Revenue (billion) Forecast, by Application 2020 & 2033
- Table 50: Benelux Building Intercom Systems Volume (K) Forecast, by Application 2020 & 2033
- Table 51: Nordics Building Intercom Systems Revenue (billion) Forecast, by Application 2020 & 2033
- Table 52: Nordics Building Intercom Systems Volume (K) Forecast, by Application 2020 & 2033
- Table 53: Rest of Europe Building Intercom Systems Revenue (billion) Forecast, by Application 2020 & 2033
- Table 54: Rest of Europe Building Intercom Systems Volume (K) Forecast, by Application 2020 & 2033
- Table 55: Global Building Intercom Systems Revenue billion Forecast, by Application 2020 & 2033
- Table 56: Global Building Intercom Systems Volume K Forecast, by Application 2020 & 2033
- Table 57: Global Building Intercom Systems Revenue billion Forecast, by Types 2020 & 2033
- Table 58: Global Building Intercom Systems Volume K Forecast, by Types 2020 & 2033
- Table 59: Global Building Intercom Systems Revenue billion Forecast, by Country 2020 & 2033
- Table 60: Global Building Intercom Systems Volume K Forecast, by Country 2020 & 2033
- Table 61: Turkey Building Intercom Systems Revenue (billion) Forecast, by Application 2020 & 2033
- Table 62: Turkey Building Intercom Systems Volume (K) Forecast, by Application 2020 & 2033
- Table 63: Israel Building Intercom Systems Revenue (billion) Forecast, by Application 2020 & 2033
- Table 64: Israel Building Intercom Systems Volume (K) Forecast, by Application 2020 & 2033
- Table 65: GCC Building Intercom Systems Revenue (billion) Forecast, by Application 2020 & 2033
- Table 66: GCC Building Intercom Systems Volume (K) Forecast, by Application 2020 & 2033
- Table 67: North Africa Building Intercom Systems Revenue (billion) Forecast, by Application 2020 & 2033
- Table 68: North Africa Building Intercom Systems Volume (K) Forecast, by Application 2020 & 2033
- Table 69: South Africa Building Intercom Systems Revenue (billion) Forecast, by Application 2020 & 2033
- Table 70: South Africa Building Intercom Systems Volume (K) Forecast, by Application 2020 & 2033
- Table 71: Rest of Middle East & Africa Building Intercom Systems Revenue (billion) Forecast, by Application 2020 & 2033
- Table 72: Rest of Middle East & Africa Building Intercom Systems Volume (K) Forecast, by Application 2020 & 2033
- Table 73: Global Building Intercom Systems Revenue billion Forecast, by Application 2020 & 2033
- Table 74: Global Building Intercom Systems Volume K Forecast, by Application 2020 & 2033
- Table 75: Global Building Intercom Systems Revenue billion Forecast, by Types 2020 & 2033
- Table 76: Global Building Intercom Systems Volume K Forecast, by Types 2020 & 2033
- Table 77: Global Building Intercom Systems Revenue billion Forecast, by Country 2020 & 2033
- Table 78: Global Building Intercom Systems Volume K Forecast, by Country 2020 & 2033
- Table 79: China Building Intercom Systems Revenue (billion) Forecast, by Application 2020 & 2033
- Table 80: China Building Intercom Systems Volume (K) Forecast, by Application 2020 & 2033
- Table 81: India Building Intercom Systems Revenue (billion) Forecast, by Application 2020 & 2033
- Table 82: India Building Intercom Systems Volume (K) Forecast, by Application 2020 & 2033
- Table 83: Japan Building Intercom Systems Revenue (billion) Forecast, by Application 2020 & 2033
- Table 84: Japan Building Intercom Systems Volume (K) Forecast, by Application 2020 & 2033
- Table 85: South Korea Building Intercom Systems Revenue (billion) Forecast, by Application 2020 & 2033
- Table 86: South Korea Building Intercom Systems Volume (K) Forecast, by Application 2020 & 2033
- Table 87: ASEAN Building Intercom Systems Revenue (billion) Forecast, by Application 2020 & 2033
- Table 88: ASEAN Building Intercom Systems Volume (K) Forecast, by Application 2020 & 2033
- Table 89: Oceania Building Intercom Systems Revenue (billion) Forecast, by Application 2020 & 2033
- Table 90: Oceania Building Intercom Systems Volume (K) Forecast, by Application 2020 & 2033
- Table 91: Rest of Asia Pacific Building Intercom Systems Revenue (billion) Forecast, by Application 2020 & 2033
- Table 92: Rest of Asia Pacific Building Intercom Systems Volume (K) Forecast, by Application 2020 & 2033
Frequently Asked Questions
1. What is the projected Compound Annual Growth Rate (CAGR) of the Building Intercom Systems?
The projected CAGR is approximately 12.57%.
2. Which companies are prominent players in the Building Intercom Systems?
Key companies in the market include Aiphone, Panasonic, Legrand, Samsung, Commax, ABB, Guangdong Anjubao, TCS, Fermax, Aurine Technology, Honeywell, Siedle, Urmet, Comelit Group, Kocom, Nortek Security & Control, Axis, Zhuhai Taichuan, Leelen Technology, WRT Security System, ShenZhen SoBen, Doorking, Fujiang QSR, Zicom, Shenzhen Competition, Quanzhou Jiale.
3. What are the main segments of the Building Intercom Systems?
The market segments include Application, Types.
4. Can you provide details about the market size?
The market size is estimated to be USD 10.04 billion as of 2022.
5. What are some drivers contributing to market growth?
N/A
6. What are the notable trends driving market growth?
N/A
7. Are there any restraints impacting market growth?
N/A
8. Can you provide examples of recent developments in the market?
N/A
9. What pricing options are available for accessing the report?
Pricing options include single-user, multi-user, and enterprise licenses priced at USD 3350.00, USD 5025.00, and USD 6700.00 respectively.
10. Is the market size provided in terms of value or volume?
The market size is provided in terms of value, measured in billion and volume, measured in K.
11. Are there any specific market keywords associated with the report?
Yes, the market keyword associated with the report is "Building Intercom Systems," which aids in identifying and referencing the specific market segment covered.
12. How do I determine which pricing option suits my needs best?
The pricing options vary based on user requirements and access needs. Individual users may opt for single-user licenses, while businesses requiring broader access may choose multi-user or enterprise licenses for cost-effective access to the report.
13. Are there any additional resources or data provided in the Building Intercom Systems report?
While the report offers comprehensive insights, it's advisable to review the specific contents or supplementary materials provided to ascertain if additional resources or data are available.
14. How can I stay updated on further developments or reports in the Building Intercom Systems?
To stay informed about further developments, trends, and reports in the Building Intercom Systems, consider subscribing to industry newsletters, following relevant companies and organizations, or regularly checking reputable industry news sources and publications.
Methodology
Step 1 - Identification of Relevant Samples Size from Population Database


Step 2 - Approaches for Defining Global Market Size (Value, Volume* & Price*)

Note*: In applicable scenarios
Step 3 - Data Sources
Primary Research
- Web Analytics
- Survey Reports
- Research Institute
- Latest Research Reports
- Opinion Leaders
Secondary Research
- Annual Reports
- White Paper
- Latest Press Release
- Industry Association
- Paid Database
- Investor Presentations

Step 4 - Data Triangulation
Involves using different sources of information in order to increase the validity of a study
These sources are likely to be stakeholders in a program - participants, other researchers, program staff, other community members, and so on.
Then we put all data in single framework & apply various statistical tools to find out the dynamic on the market.
During the analysis stage, feedback from the stakeholder groups would be compared to determine areas of agreement as well as areas of divergence