

Key Insights
The global Broadband Remote Access Server (BNG) market is poised for significant expansion, projected to reach an estimated $1,500 million by 2025, with a robust Compound Annual Growth Rate (CAGR) of 12.5% over the forecast period of 2025-2033. This impressive growth is primarily fueled by the escalating demand for high-speed internet across both residential and commercial sectors. The proliferation of data-intensive applications, including cloud computing, high-definition streaming, and online gaming, necessitates robust and scalable network infrastructure, making BNGs an indispensable component. Furthermore, the ongoing transition from traditional copper-based networks to fiber optics and the increasing adoption of 5G technology are creating substantial opportunities for BNG manufacturers and service providers. The market's expansion is also bolstered by government initiatives aimed at bridging the digital divide and promoting broadband penetration in underserved areas.
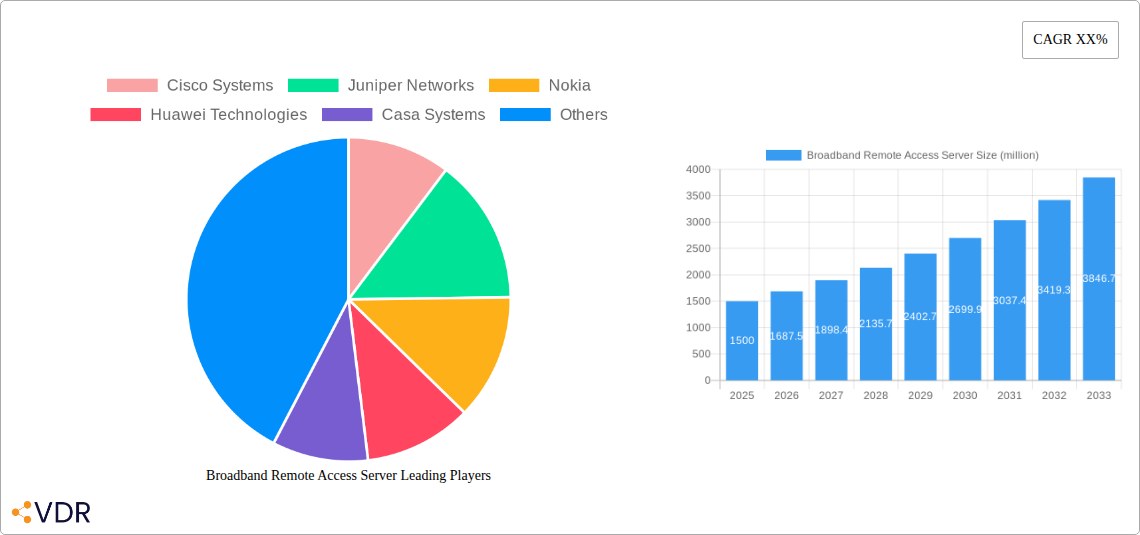
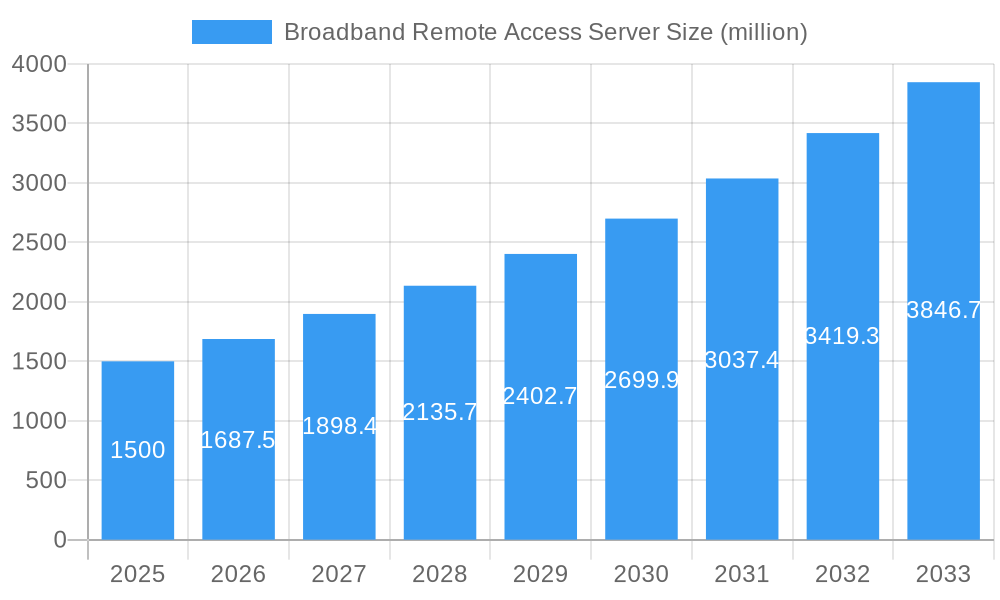
Broadband Remote Access Server Market Size (In Billion)
Key drivers propelling this market forward include the continuous need for enhanced network performance, improved subscriber management capabilities, and cost-effective solutions for service providers. The evolution towards virtualized BNG (vBNG) solutions is a significant trend, offering greater flexibility, scalability, and agility compared to traditional hardware-based systems. This shift allows operators to optimize resource utilization and reduce operational expenses. However, the market faces certain restraints, such as the high initial investment required for network upgrades and the complex integration of new BNG technologies with existing infrastructure. Despite these challenges, the increasing adoption of advanced networking technologies and the persistent global appetite for faster and more reliable internet connectivity are expected to sustain the market's upward trajectory throughout the study period.
Broadband Remote Access Server Company Market Share
Comprehensive Report: Broadband Remote Access Server (BRAS) Market Dynamics, Growth & Future Outlook (2019-2033)
This in-depth report provides a granular analysis of the global Broadband Remote Access Server (BRAS) market, offering critical insights for industry stakeholders. Covering the historical period from 2019 to 2024, the base and estimated year of 2025, and a comprehensive forecast period extending to 2033, this report details market dynamics, growth trends, regional dominance, product landscape, key drivers, barriers, emerging opportunities, and a detailed player analysis. We delve into both parent and child market segments, analyzing the intricate interplay of technological advancements, regulatory shifts, and evolving consumer demands that shape the BRAS ecosystem. All quantitative data is presented in millions of units for clarity and impact.
Broadband Remote Access Server Market Dynamics & Structure
The global Broadband Remote Access Server (BRAS) market is characterized by a moderate to high degree of concentration, with leading players like Cisco Systems, Juniper Networks, and Nokia holding significant market shares. Technological innovation serves as a primary growth driver, fueled by the escalating demand for higher bandwidth, lower latency, and enhanced subscriber management capabilities. The proliferation of 5G, IoT, and cloud-based services necessitates sophisticated BRAS solutions capable of handling massive data volumes and complex traffic patterns. Regulatory frameworks, particularly those mandating net neutrality and data privacy, influence deployment strategies and the feature sets of BRAS devices. Competitive product substitutes, such as cloud-native gateways and software-defined networking (SDN) solutions, are emerging, prompting BRAS vendors to innovate and integrate advanced functionalities. End-user demographics are shifting, with an increasing demand for seamless and reliable broadband experiences from both residential and commercial sectors. Mergers and acquisitions (M&A) trends within the telecommunications and networking infrastructure sectors are impacting market structure, with consolidation aimed at achieving economies of scale and expanding product portfolios.
- Market Concentration: Leading vendors hold approximately 65% of the market share, with the remaining distributed among specialized and emerging players.
- Technological Innovation Drivers: Increasing demand for 8K streaming, cloud gaming, and enterprise VPN services.
- Regulatory Frameworks: GDPR and CCPA compliance are critical considerations for BRAS vendors.
- Competitive Product Substitutes: Rise of vBRAS and disaggregated networking solutions.
- End-User Demographics: Growing demand for symmetrical bandwidth and low-latency connections for remote work and home entertainment.
- M&A Trends: An average of 3-5 significant M&A deals annually in the broader telecom infrastructure space impacting BRAS vendors.
Broadband Remote Access Server Growth Trends & Insights
The global Broadband Remote Access Server (BRAS) market is projected for robust growth, driven by the relentless expansion of internet penetration and the burgeoning demand for high-speed connectivity across residential and commercial applications. The market size, valued at approximately $3,500 million in 2023, is forecast to reach an estimated $6,200 million by 2033, exhibiting a Compound Annual Growth Rate (CAGR) of around 5.8% during the forecast period. This expansion is underpinned by the continuous evolution of broadband technologies, including the widespread adoption of fiber-to-the-home (FTTH) and the ongoing rollout of 5G networks, both of which necessitate advanced and scalable BRAS solutions. Adoption rates for virtualized BRAS (vBRAS) are accelerating as service providers seek greater flexibility, cost-efficiency, and agility in network deployment and management. This shift from traditional hardware-centric BRAS to software-defined, cloud-native architectures represents a significant technological disruption, enabling faster service provisioning and dynamic resource allocation.
Consumer behavior is also a pivotal factor, with an increasing reliance on broadband for remote work, online education, entertainment streaming (including high-definition and immersive content), and the proliferation of smart home devices. This evolving demand profile is pushing the boundaries of existing network infrastructure, creating a direct need for more powerful and intelligent BRAS capabilities. The integration of Artificial Intelligence (AI) and Machine Learning (ML) into BRAS platforms is another emerging trend, promising enhanced traffic management, predictive maintenance, and personalized service delivery. Furthermore, the increasing adoption of business-critical applications for enterprises, such as cloud computing, big data analytics, and real-time collaboration tools, is amplifying the demand for reliable, secure, and high-performance broadband access, thus propelling the BRAS market forward. The penetration of advanced broadband services is expected to cross 75% globally by 2030, directly impacting BRAS deployment numbers.
- Market Size Evolution: From an estimated $3,500 million in 2023 to a projected $6,200 million by 2033.
- CAGR: Approximately 5.8% during the 2025–2033 forecast period.
- Adoption Rates: Significant increase in vBRAS adoption, expected to reach 45% of new deployments by 2028.
- Technological Disruptions: Transition towards SDN/NFV-enabled BRAS, cloud-native architectures, and AI/ML integration.
- Consumer Behavior Shifts: Growing demand for symmetrical speeds, low latency for gaming and AR/VR, and seamless connectivity for multiple devices.
- Market Penetration: Global advanced broadband service penetration projected to exceed 75% by 2030.
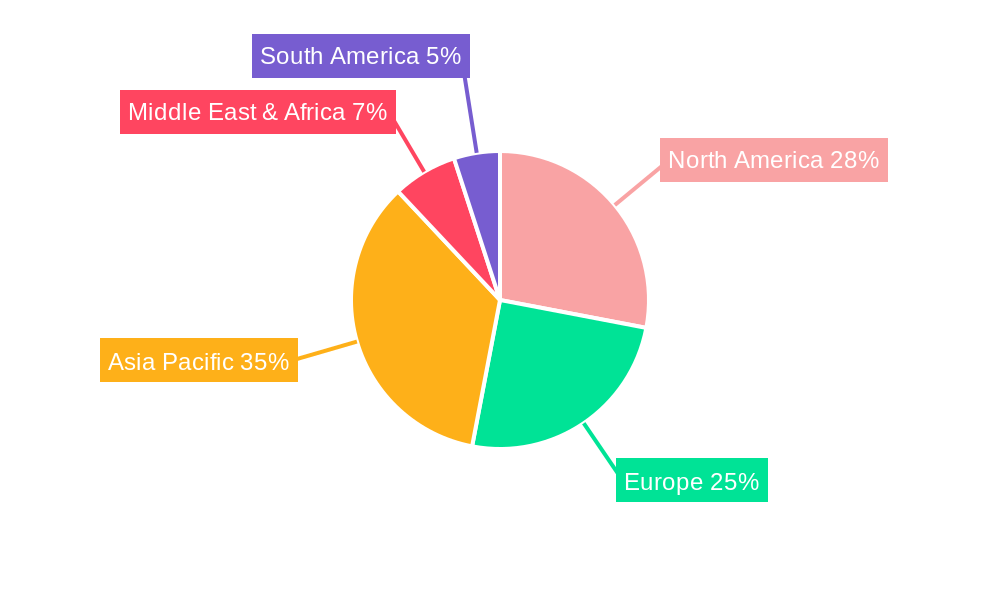
Dominant Regions, Countries, or Segments in Broadband Remote Access Server
The North America region, particularly the United States, currently holds a dominant position in the global Broadband Remote Access Server (BRAS) market. This regional leadership is attributed to a confluence of factors, including advanced telecommunications infrastructure, high disposable incomes, a robust economy, and a strong propensity for adopting cutting-edge technologies. The presence of major telecommunications providers and a concentrated enterprise sector fuels the demand for high-performance and scalable BRAS solutions. The Residential application segment within North America is a primary growth engine, driven by increasing demand for faster internet speeds to support a growing number of connected devices, high-definition streaming, online gaming, and remote work. Market share in North America for BRAS is estimated at approximately 30% of the global market.
Key drivers for this dominance include proactive government initiatives promoting broadband expansion, significant private sector investments in network upgrades, and a highly competitive market environment that spurs innovation and adoption. Countries like the United States are at the forefront of fiber optic deployment, which directly translates to a higher demand for sophisticated BRAS platforms capable of managing increased bandwidth and subscriber density. The Commercial application segment also contributes significantly, with businesses requiring reliable and secure internet access for critical operations, cloud services, and inter-branch connectivity. The Type segment of vBRAS (virtual Broadband Remote Access Server) is witnessing accelerated growth in North America, mirroring the global trend towards software-defined networking and network function virtualization (NFV). Service providers in the region are increasingly migrating towards vBRAS to achieve greater operational flexibility, cost savings, and faster service deployment cycles.
- Dominant Region: North America, with an estimated 30% global market share.
- Leading Country: United States, accounting for a significant portion of the regional market.
- Primary Application Driver: Residential, fueled by demand for high-speed internet and multi-device connectivity.
- Key Drivers for Dominance: Advanced infrastructure, strong economic conditions, government support for broadband, and competitive market landscape.
- Growth Potential in Type Segment: Accelerated adoption of vBRAS due to flexibility and cost-efficiency.
- Economic Policies: Favorable policies encouraging private investment in broadband infrastructure.
Broadband Remote Access Server Product Landscape
The Broadband Remote Access Server (BRAS) product landscape is rapidly evolving, characterized by a strong emphasis on software-defined networking (SDN) and network function virtualization (NFV). Vendors are increasingly offering virtualized BRAS (vBRAS) solutions that can be deployed on generic hardware, providing greater flexibility and scalability compared to traditional hardware-based systems. Innovations are focused on enhancing subscriber management, enabling granular policy control, facilitating dynamic bandwidth allocation, and ensuring robust security features. Performance metrics are continuously improving, with newer BRAS platforms supporting higher subscriber densities, increased throughput, and lower latency, critical for emerging applications like 5G mobile backhaul and augmented reality (AR). Unique selling propositions often revolve around seamless integration with existing network architectures, advanced analytics capabilities for network optimization, and support for a wide range of broadband access technologies.
Key Drivers, Barriers & Challenges in Broadband Remote Access Server
The Broadband Remote Access Server (BRAS) market is propelled by several key drivers. The escalating global demand for high-speed internet, fueled by the proliferation of connected devices, cloud services, and bandwidth-intensive applications like 4K/8K streaming and online gaming, is a primary growth catalyst. The ongoing deployment of fiber-to-the-home (FTTH) networks and the expansion of 5G infrastructure necessitate robust and scalable BRAS solutions to manage increased subscriber capacity and traffic volumes. Furthermore, the growing adoption of virtual BRAS (vBRAS) offers service providers enhanced agility, reduced operational costs, and faster service provisioning, driving market expansion.
Conversely, several barriers and challenges impede market growth. The high upfront cost associated with deploying and upgrading BRAS infrastructure, especially for smaller telecommunications operators, can be a significant restraint. Intense competition among vendors can lead to price erosion, impacting profitability. Evolving cybersecurity threats necessitate continuous investment in advanced security features, adding to operational complexity and cost. Regulatory complexities and compliance requirements in different regions can also create hurdles for global market penetration. Supply chain disruptions and the availability of skilled personnel for implementing and managing advanced BRAS solutions present ongoing challenges.
- Key Drivers:
- Increasing demand for high-speed broadband and bandwidth-intensive applications.
- Expansion of FTTH and 5G network rollouts.
- Growing adoption of vBRAS for flexibility and cost savings.
- Barriers & Challenges:
- High initial investment costs for infrastructure upgrades.
- Intense vendor competition and price pressures.
- Evolving cybersecurity threats and the need for advanced security features.
- Complex regulatory landscapes and compliance demands.
- Supply chain vulnerabilities and talent shortages.
Emerging Opportunities in Broadband Remote Access Server
Emerging opportunities in the Broadband Remote Access Server (BRAS) market are largely driven by the increasing integration of advanced technologies and the demand for specialized connectivity solutions. The burgeoning Internet of Things (IoT) ecosystem presents a significant opportunity, as BRAS platforms will be crucial for managing the massive number of connected devices and their unique traffic patterns. The development of edge computing further opens avenues for BRAS solutions that can provide localized processing and low-latency connectivity, essential for real-time applications. Furthermore, the increasing focus on private 5G networks for enterprises and industrial applications creates a niche market for customized BRAS deployments that can cater to specific business needs, offering enhanced security and performance. The growing demand for managed Wi-Fi services in both residential and commercial settings also presents opportunities for BRAS vendors to offer integrated solutions that simplify network management and enhance user experience.
Growth Accelerators in the Broadband Remote Access Server Industry
Several factors are acting as significant growth accelerators for the Broadband Remote Access Server (BRAS) industry. The relentless push towards higher bandwidth and lower latency by telecommunications operators globally, driven by consumer demand for seamless digital experiences, is a primary accelerator. The ongoing technological evolution towards Software-Defined Networking (SDN) and Network Function Virtualization (NFV) is enabling the development of more agile, scalable, and cost-effective vBRAS solutions, fostering wider adoption. Strategic partnerships and collaborations between BRAS vendors and cloud providers, as well as with original equipment manufacturers (OEMs), are facilitating the integration of BRAS functionalities into broader network ecosystems. Furthermore, the increasing pervasiveness of smart city initiatives and the deployment of industrial IoT are creating new use cases and driving demand for robust broadband access management.
Key Players Shaping the Broadband Remote Access Server Market
- Cisco Systems
- Juniper Networks
- Nokia
- Huawei Technologies
- Casa Systems
- Ciena
- netElastic
- Waystream AB
- Sanctum Networks
- RtBrick
Notable Milestones in Broadband Remote Access Server Sector
- 2019: Increased adoption of vBRAS solutions for network agility.
- 2020: Focus on enhanced subscriber management features to support remote work trends.
- 2021: Integration of AI/ML for predictive network management and optimization.
- 2022: Significant investments in 5G-ready BRAS platforms by major carriers.
- 2023: Growing demand for secure and scalable BRAS for IoT deployments.
- Early 2024: Expansion of cloud-native BRAS offerings.
In-Depth Broadband Remote Access Server Market Outlook
The outlook for the Broadband Remote Access Server (BRAS) market remains exceptionally positive, driven by sustained global demand for enhanced connectivity. Growth accelerators like the continued build-out of fiber and 5G networks, coupled with the increasing sophistication of residential and commercial applications, will ensure a steady upward trajectory. The transition to virtualized and cloud-native BRAS architectures will unlock new efficiencies and foster innovation. Strategic opportunities lie in leveraging BRAS for emerging use cases such as edge computing, private 5G networks, and comprehensive IoT management. The market's future will be shaped by vendors who can deliver scalable, secure, and intelligent solutions that meet the evolving demands of a hyper-connected world.
Broadband Remote Access Server Segmentation
-
1. Application
- 1.1. Residential
- 1.2. Commercial
-
2. Types
- 2.1. Traditional BNG
- 2.2. vBNG
Broadband Remote Access Server Segmentation By Geography
-
1. North America
- 1.1. United States
- 1.2. Canada
- 1.3. Mexico
-
2. South America
- 2.1. Brazil
- 2.2. Argentina
- 2.3. Rest of South America
-
3. Europe
- 3.1. United Kingdom
- 3.2. Germany
- 3.3. France
- 3.4. Italy
- 3.5. Spain
- 3.6. Russia
- 3.7. Benelux
- 3.8. Nordics
- 3.9. Rest of Europe
-
4. Middle East & Africa
- 4.1. Turkey
- 4.2. Israel
- 4.3. GCC
- 4.4. North Africa
- 4.5. South Africa
- 4.6. Rest of Middle East & Africa
-
5. Asia Pacific
- 5.1. China
- 5.2. India
- 5.3. Japan
- 5.4. South Korea
- 5.5. ASEAN
- 5.6. Oceania
- 5.7. Rest of Asia Pacific
Broadband Remote Access Server Regional Market Share
Geographic Coverage of Broadband Remote Access Server
Broadband Remote Access Server REPORT HIGHLIGHTS
| Aspects | Details |
|---|---|
| Study Period | 2020-2034 |
| Base Year | 2025 |
| Estimated Year | 2026 |
| Forecast Period | 2026-2034 |
| Historical Period | 2020-2025 |
| Growth Rate | CAGR of 6.1% from 2020-2034 |
| Segmentation |
|
Table of Contents
- 1. Introduction
- 1.1. Research Scope
- 1.2. Market Segmentation
- 1.3. Research Objective
- 1.4. Definitions and Assumptions
- 2. Executive Summary
- 2.1. Market Snapshot
- 3. Market Dynamics
- 3.1. Market Drivers
- 3.2. Market Restrains
- 3.3. Market Trends
- 3.4. Market Opportunities
- 4. Market Factor Analysis
- 4.1. Porters Five Forces
- 4.1.1. Bargaining Power of Suppliers
- 4.1.2. Bargaining Power of Buyers
- 4.1.3. Threat of New Entrants
- 4.1.4. Threat of Substitutes
- 4.1.5. Competitive Rivalry
- 4.2. PESTEL analysis
- 4.3. BCG Analysis
- 4.3.1. Stars (High Growth, High Market Share)
- 4.3.2. Cash Cows (Low Growth, High Market Share)
- 4.3.3. Question Mark (High Growth, Low Market Share)
- 4.3.4. Dogs (Low Growth, Low Market Share)
- 4.4. Ansoff Matrix Analysis
- 4.5. Supply Chain Analysis
- 4.6. Regulatory Landscape
- 4.7. Current Market Potential and Opportunity Assessment (TAM–SAM–SOM Framework)
- 4.8. VDR Analyst Note
- 4.1. Porters Five Forces
- 5. Market Analysis, Insights and Forecast 2021-2033
- 5.1. Market Analysis, Insights and Forecast - by Application
- 5.1.1. Residential
- 5.1.2. Commercial
- 5.2. Market Analysis, Insights and Forecast - by Types
- 5.2.1. Traditional BNG
- 5.2.2. vBNG
- 5.3. Market Analysis, Insights and Forecast - by Region
- 5.3.1. North America
- 5.3.2. South America
- 5.3.3. Europe
- 5.3.4. Middle East & Africa
- 5.3.5. Asia Pacific
- 5.1. Market Analysis, Insights and Forecast - by Application
- 6. Global Broadband Remote Access Server Analysis, Insights and Forecast, 2021-2033
- 6.1. Market Analysis, Insights and Forecast - by Application
- 6.1.1. Residential
- 6.1.2. Commercial
- 6.2. Market Analysis, Insights and Forecast - by Types
- 6.2.1. Traditional BNG
- 6.2.2. vBNG
- 6.1. Market Analysis, Insights and Forecast - by Application
- 7. North America Broadband Remote Access Server Analysis, Insights and Forecast, 2021-2033
- 7.1. Market Analysis, Insights and Forecast - by Application
- 7.1.1. Residential
- 7.1.2. Commercial
- 7.2. Market Analysis, Insights and Forecast - by Types
- 7.2.1. Traditional BNG
- 7.2.2. vBNG
- 7.1. Market Analysis, Insights and Forecast - by Application
- 8. South America Broadband Remote Access Server Analysis, Insights and Forecast, 2021-2033
- 8.1. Market Analysis, Insights and Forecast - by Application
- 8.1.1. Residential
- 8.1.2. Commercial
- 8.2. Market Analysis, Insights and Forecast - by Types
- 8.2.1. Traditional BNG
- 8.2.2. vBNG
- 8.1. Market Analysis, Insights and Forecast - by Application
- 9. Europe Broadband Remote Access Server Analysis, Insights and Forecast, 2021-2033
- 9.1. Market Analysis, Insights and Forecast - by Application
- 9.1.1. Residential
- 9.1.2. Commercial
- 9.2. Market Analysis, Insights and Forecast - by Types
- 9.2.1. Traditional BNG
- 9.2.2. vBNG
- 9.1. Market Analysis, Insights and Forecast - by Application
- 10. Middle East & Africa Broadband Remote Access Server Analysis, Insights and Forecast, 2021-2033
- 10.1. Market Analysis, Insights and Forecast - by Application
- 10.1.1. Residential
- 10.1.2. Commercial
- 10.2. Market Analysis, Insights and Forecast - by Types
- 10.2.1. Traditional BNG
- 10.2.2. vBNG
- 10.1. Market Analysis, Insights and Forecast - by Application
- 11. Asia Pacific Broadband Remote Access Server Analysis, Insights and Forecast, 2021-2033
- 11.1. Market Analysis, Insights and Forecast - by Application
- 11.1.1. Residential
- 11.1.2. Commercial
- 11.2. Market Analysis, Insights and Forecast - by Types
- 11.2.1. Traditional BNG
- 11.2.2. vBNG
- 11.1. Market Analysis, Insights and Forecast - by Application
- 12. Competitive Analysis
- 12.1. Company Profiles
- 12.1.1 Cisco Systems
- 12.1.1.1. Company Overview
- 12.1.1.2. Products
- 12.1.1.3. Company Financials
- 12.1.1.4. SWOT Analysis
- 12.1.2 Juniper Networks
- 12.1.2.1. Company Overview
- 12.1.2.2. Products
- 12.1.2.3. Company Financials
- 12.1.2.4. SWOT Analysis
- 12.1.3 Nokia
- 12.1.3.1. Company Overview
- 12.1.3.2. Products
- 12.1.3.3. Company Financials
- 12.1.3.4. SWOT Analysis
- 12.1.4 Huawei Technologies
- 12.1.4.1. Company Overview
- 12.1.4.2. Products
- 12.1.4.3. Company Financials
- 12.1.4.4. SWOT Analysis
- 12.1.5 Casa Systems
- 12.1.5.1. Company Overview
- 12.1.5.2. Products
- 12.1.5.3. Company Financials
- 12.1.5.4. SWOT Analysis
- 12.1.6 Ciena
- 12.1.6.1. Company Overview
- 12.1.6.2. Products
- 12.1.6.3. Company Financials
- 12.1.6.4. SWOT Analysis
- 12.1.7 netElastic
- 12.1.7.1. Company Overview
- 12.1.7.2. Products
- 12.1.7.3. Company Financials
- 12.1.7.4. SWOT Analysis
- 12.1.8 Waystream AB
- 12.1.8.1. Company Overview
- 12.1.8.2. Products
- 12.1.8.3. Company Financials
- 12.1.8.4. SWOT Analysis
- 12.1.9 Sanctum Networks
- 12.1.9.1. Company Overview
- 12.1.9.2. Products
- 12.1.9.3. Company Financials
- 12.1.9.4. SWOT Analysis
- 12.1.10 RtBrick
- 12.1.10.1. Company Overview
- 12.1.10.2. Products
- 12.1.10.3. Company Financials
- 12.1.10.4. SWOT Analysis
- 12.1.1 Cisco Systems
- 12.2. Market Entropy
- 12.2.1 Company's Key Areas Served
- 12.2.2 Recent Developments
- 12.3. Company Market Share Analysis 2025
- 12.3.1 Top 5 Companies Market Share Analysis
- 12.3.2 Top 3 Companies Market Share Analysis
- 12.4. List of Potential Customers
- 13. Research Methodology
List of Figures
- Figure 1: Global Broadband Remote Access Server Revenue Breakdown (undefined, %) by Region 2025 & 2033
- Figure 2: Global Broadband Remote Access Server Volume Breakdown (K, %) by Region 2025 & 2033
- Figure 3: North America Broadband Remote Access Server Revenue (undefined), by Application 2025 & 2033
- Figure 4: North America Broadband Remote Access Server Volume (K), by Application 2025 & 2033
- Figure 5: North America Broadband Remote Access Server Revenue Share (%), by Application 2025 & 2033
- Figure 6: North America Broadband Remote Access Server Volume Share (%), by Application 2025 & 2033
- Figure 7: North America Broadband Remote Access Server Revenue (undefined), by Types 2025 & 2033
- Figure 8: North America Broadband Remote Access Server Volume (K), by Types 2025 & 2033
- Figure 9: North America Broadband Remote Access Server Revenue Share (%), by Types 2025 & 2033
- Figure 10: North America Broadband Remote Access Server Volume Share (%), by Types 2025 & 2033
- Figure 11: North America Broadband Remote Access Server Revenue (undefined), by Country 2025 & 2033
- Figure 12: North America Broadband Remote Access Server Volume (K), by Country 2025 & 2033
- Figure 13: North America Broadband Remote Access Server Revenue Share (%), by Country 2025 & 2033
- Figure 14: North America Broadband Remote Access Server Volume Share (%), by Country 2025 & 2033
- Figure 15: South America Broadband Remote Access Server Revenue (undefined), by Application 2025 & 2033
- Figure 16: South America Broadband Remote Access Server Volume (K), by Application 2025 & 2033
- Figure 17: South America Broadband Remote Access Server Revenue Share (%), by Application 2025 & 2033
- Figure 18: South America Broadband Remote Access Server Volume Share (%), by Application 2025 & 2033
- Figure 19: South America Broadband Remote Access Server Revenue (undefined), by Types 2025 & 2033
- Figure 20: South America Broadband Remote Access Server Volume (K), by Types 2025 & 2033
- Figure 21: South America Broadband Remote Access Server Revenue Share (%), by Types 2025 & 2033
- Figure 22: South America Broadband Remote Access Server Volume Share (%), by Types 2025 & 2033
- Figure 23: South America Broadband Remote Access Server Revenue (undefined), by Country 2025 & 2033
- Figure 24: South America Broadband Remote Access Server Volume (K), by Country 2025 & 2033
- Figure 25: South America Broadband Remote Access Server Revenue Share (%), by Country 2025 & 2033
- Figure 26: South America Broadband Remote Access Server Volume Share (%), by Country 2025 & 2033
- Figure 27: Europe Broadband Remote Access Server Revenue (undefined), by Application 2025 & 2033
- Figure 28: Europe Broadband Remote Access Server Volume (K), by Application 2025 & 2033
- Figure 29: Europe Broadband Remote Access Server Revenue Share (%), by Application 2025 & 2033
- Figure 30: Europe Broadband Remote Access Server Volume Share (%), by Application 2025 & 2033
- Figure 31: Europe Broadband Remote Access Server Revenue (undefined), by Types 2025 & 2033
- Figure 32: Europe Broadband Remote Access Server Volume (K), by Types 2025 & 2033
- Figure 33: Europe Broadband Remote Access Server Revenue Share (%), by Types 2025 & 2033
- Figure 34: Europe Broadband Remote Access Server Volume Share (%), by Types 2025 & 2033
- Figure 35: Europe Broadband Remote Access Server Revenue (undefined), by Country 2025 & 2033
- Figure 36: Europe Broadband Remote Access Server Volume (K), by Country 2025 & 2033
- Figure 37: Europe Broadband Remote Access Server Revenue Share (%), by Country 2025 & 2033
- Figure 38: Europe Broadband Remote Access Server Volume Share (%), by Country 2025 & 2033
- Figure 39: Middle East & Africa Broadband Remote Access Server Revenue (undefined), by Application 2025 & 2033
- Figure 40: Middle East & Africa Broadband Remote Access Server Volume (K), by Application 2025 & 2033
- Figure 41: Middle East & Africa Broadband Remote Access Server Revenue Share (%), by Application 2025 & 2033
- Figure 42: Middle East & Africa Broadband Remote Access Server Volume Share (%), by Application 2025 & 2033
- Figure 43: Middle East & Africa Broadband Remote Access Server Revenue (undefined), by Types 2025 & 2033
- Figure 44: Middle East & Africa Broadband Remote Access Server Volume (K), by Types 2025 & 2033
- Figure 45: Middle East & Africa Broadband Remote Access Server Revenue Share (%), by Types 2025 & 2033
- Figure 46: Middle East & Africa Broadband Remote Access Server Volume Share (%), by Types 2025 & 2033
- Figure 47: Middle East & Africa Broadband Remote Access Server Revenue (undefined), by Country 2025 & 2033
- Figure 48: Middle East & Africa Broadband Remote Access Server Volume (K), by Country 2025 & 2033
- Figure 49: Middle East & Africa Broadband Remote Access Server Revenue Share (%), by Country 2025 & 2033
- Figure 50: Middle East & Africa Broadband Remote Access Server Volume Share (%), by Country 2025 & 2033
- Figure 51: Asia Pacific Broadband Remote Access Server Revenue (undefined), by Application 2025 & 2033
- Figure 52: Asia Pacific Broadband Remote Access Server Volume (K), by Application 2025 & 2033
- Figure 53: Asia Pacific Broadband Remote Access Server Revenue Share (%), by Application 2025 & 2033
- Figure 54: Asia Pacific Broadband Remote Access Server Volume Share (%), by Application 2025 & 2033
- Figure 55: Asia Pacific Broadband Remote Access Server Revenue (undefined), by Types 2025 & 2033
- Figure 56: Asia Pacific Broadband Remote Access Server Volume (K), by Types 2025 & 2033
- Figure 57: Asia Pacific Broadband Remote Access Server Revenue Share (%), by Types 2025 & 2033
- Figure 58: Asia Pacific Broadband Remote Access Server Volume Share (%), by Types 2025 & 2033
- Figure 59: Asia Pacific Broadband Remote Access Server Revenue (undefined), by Country 2025 & 2033
- Figure 60: Asia Pacific Broadband Remote Access Server Volume (K), by Country 2025 & 2033
- Figure 61: Asia Pacific Broadband Remote Access Server Revenue Share (%), by Country 2025 & 2033
- Figure 62: Asia Pacific Broadband Remote Access Server Volume Share (%), by Country 2025 & 2033
List of Tables
- Table 1: Global Broadband Remote Access Server Revenue undefined Forecast, by Application 2020 & 2033
- Table 2: Global Broadband Remote Access Server Volume K Forecast, by Application 2020 & 2033
- Table 3: Global Broadband Remote Access Server Revenue undefined Forecast, by Types 2020 & 2033
- Table 4: Global Broadband Remote Access Server Volume K Forecast, by Types 2020 & 2033
- Table 5: Global Broadband Remote Access Server Revenue undefined Forecast, by Region 2020 & 2033
- Table 6: Global Broadband Remote Access Server Volume K Forecast, by Region 2020 & 2033
- Table 7: Global Broadband Remote Access Server Revenue undefined Forecast, by Application 2020 & 2033
- Table 8: Global Broadband Remote Access Server Volume K Forecast, by Application 2020 & 2033
- Table 9: Global Broadband Remote Access Server Revenue undefined Forecast, by Types 2020 & 2033
- Table 10: Global Broadband Remote Access Server Volume K Forecast, by Types 2020 & 2033
- Table 11: Global Broadband Remote Access Server Revenue undefined Forecast, by Country 2020 & 2033
- Table 12: Global Broadband Remote Access Server Volume K Forecast, by Country 2020 & 2033
- Table 13: United States Broadband Remote Access Server Revenue (undefined) Forecast, by Application 2020 & 2033
- Table 14: United States Broadband Remote Access Server Volume (K) Forecast, by Application 2020 & 2033
- Table 15: Canada Broadband Remote Access Server Revenue (undefined) Forecast, by Application 2020 & 2033
- Table 16: Canada Broadband Remote Access Server Volume (K) Forecast, by Application 2020 & 2033
- Table 17: Mexico Broadband Remote Access Server Revenue (undefined) Forecast, by Application 2020 & 2033
- Table 18: Mexico Broadband Remote Access Server Volume (K) Forecast, by Application 2020 & 2033
- Table 19: Global Broadband Remote Access Server Revenue undefined Forecast, by Application 2020 & 2033
- Table 20: Global Broadband Remote Access Server Volume K Forecast, by Application 2020 & 2033
- Table 21: Global Broadband Remote Access Server Revenue undefined Forecast, by Types 2020 & 2033
- Table 22: Global Broadband Remote Access Server Volume K Forecast, by Types 2020 & 2033
- Table 23: Global Broadband Remote Access Server Revenue undefined Forecast, by Country 2020 & 2033
- Table 24: Global Broadband Remote Access Server Volume K Forecast, by Country 2020 & 2033
- Table 25: Brazil Broadband Remote Access Server Revenue (undefined) Forecast, by Application 2020 & 2033
- Table 26: Brazil Broadband Remote Access Server Volume (K) Forecast, by Application 2020 & 2033
- Table 27: Argentina Broadband Remote Access Server Revenue (undefined) Forecast, by Application 2020 & 2033
- Table 28: Argentina Broadband Remote Access Server Volume (K) Forecast, by Application 2020 & 2033
- Table 29: Rest of South America Broadband Remote Access Server Revenue (undefined) Forecast, by Application 2020 & 2033
- Table 30: Rest of South America Broadband Remote Access Server Volume (K) Forecast, by Application 2020 & 2033
- Table 31: Global Broadband Remote Access Server Revenue undefined Forecast, by Application 2020 & 2033
- Table 32: Global Broadband Remote Access Server Volume K Forecast, by Application 2020 & 2033
- Table 33: Global Broadband Remote Access Server Revenue undefined Forecast, by Types 2020 & 2033
- Table 34: Global Broadband Remote Access Server Volume K Forecast, by Types 2020 & 2033
- Table 35: Global Broadband Remote Access Server Revenue undefined Forecast, by Country 2020 & 2033
- Table 36: Global Broadband Remote Access Server Volume K Forecast, by Country 2020 & 2033
- Table 37: United Kingdom Broadband Remote Access Server Revenue (undefined) Forecast, by Application 2020 & 2033
- Table 38: United Kingdom Broadband Remote Access Server Volume (K) Forecast, by Application 2020 & 2033
- Table 39: Germany Broadband Remote Access Server Revenue (undefined) Forecast, by Application 2020 & 2033
- Table 40: Germany Broadband Remote Access Server Volume (K) Forecast, by Application 2020 & 2033
- Table 41: France Broadband Remote Access Server Revenue (undefined) Forecast, by Application 2020 & 2033
- Table 42: France Broadband Remote Access Server Volume (K) Forecast, by Application 2020 & 2033
- Table 43: Italy Broadband Remote Access Server Revenue (undefined) Forecast, by Application 2020 & 2033
- Table 44: Italy Broadband Remote Access Server Volume (K) Forecast, by Application 2020 & 2033
- Table 45: Spain Broadband Remote Access Server Revenue (undefined) Forecast, by Application 2020 & 2033
- Table 46: Spain Broadband Remote Access Server Volume (K) Forecast, by Application 2020 & 2033
- Table 47: Russia Broadband Remote Access Server Revenue (undefined) Forecast, by Application 2020 & 2033
- Table 48: Russia Broadband Remote Access Server Volume (K) Forecast, by Application 2020 & 2033
- Table 49: Benelux Broadband Remote Access Server Revenue (undefined) Forecast, by Application 2020 & 2033
- Table 50: Benelux Broadband Remote Access Server Volume (K) Forecast, by Application 2020 & 2033
- Table 51: Nordics Broadband Remote Access Server Revenue (undefined) Forecast, by Application 2020 & 2033
- Table 52: Nordics Broadband Remote Access Server Volume (K) Forecast, by Application 2020 & 2033
- Table 53: Rest of Europe Broadband Remote Access Server Revenue (undefined) Forecast, by Application 2020 & 2033
- Table 54: Rest of Europe Broadband Remote Access Server Volume (K) Forecast, by Application 2020 & 2033
- Table 55: Global Broadband Remote Access Server Revenue undefined Forecast, by Application 2020 & 2033
- Table 56: Global Broadband Remote Access Server Volume K Forecast, by Application 2020 & 2033
- Table 57: Global Broadband Remote Access Server Revenue undefined Forecast, by Types 2020 & 2033
- Table 58: Global Broadband Remote Access Server Volume K Forecast, by Types 2020 & 2033
- Table 59: Global Broadband Remote Access Server Revenue undefined Forecast, by Country 2020 & 2033
- Table 60: Global Broadband Remote Access Server Volume K Forecast, by Country 2020 & 2033
- Table 61: Turkey Broadband Remote Access Server Revenue (undefined) Forecast, by Application 2020 & 2033
- Table 62: Turkey Broadband Remote Access Server Volume (K) Forecast, by Application 2020 & 2033
- Table 63: Israel Broadband Remote Access Server Revenue (undefined) Forecast, by Application 2020 & 2033
- Table 64: Israel Broadband Remote Access Server Volume (K) Forecast, by Application 2020 & 2033
- Table 65: GCC Broadband Remote Access Server Revenue (undefined) Forecast, by Application 2020 & 2033
- Table 66: GCC Broadband Remote Access Server Volume (K) Forecast, by Application 2020 & 2033
- Table 67: North Africa Broadband Remote Access Server Revenue (undefined) Forecast, by Application 2020 & 2033
- Table 68: North Africa Broadband Remote Access Server Volume (K) Forecast, by Application 2020 & 2033
- Table 69: South Africa Broadband Remote Access Server Revenue (undefined) Forecast, by Application 2020 & 2033
- Table 70: South Africa Broadband Remote Access Server Volume (K) Forecast, by Application 2020 & 2033
- Table 71: Rest of Middle East & Africa Broadband Remote Access Server Revenue (undefined) Forecast, by Application 2020 & 2033
- Table 72: Rest of Middle East & Africa Broadband Remote Access Server Volume (K) Forecast, by Application 2020 & 2033
- Table 73: Global Broadband Remote Access Server Revenue undefined Forecast, by Application 2020 & 2033
- Table 74: Global Broadband Remote Access Server Volume K Forecast, by Application 2020 & 2033
- Table 75: Global Broadband Remote Access Server Revenue undefined Forecast, by Types 2020 & 2033
- Table 76: Global Broadband Remote Access Server Volume K Forecast, by Types 2020 & 2033
- Table 77: Global Broadband Remote Access Server Revenue undefined Forecast, by Country 2020 & 2033
- Table 78: Global Broadband Remote Access Server Volume K Forecast, by Country 2020 & 2033
- Table 79: China Broadband Remote Access Server Revenue (undefined) Forecast, by Application 2020 & 2033
- Table 80: China Broadband Remote Access Server Volume (K) Forecast, by Application 2020 & 2033
- Table 81: India Broadband Remote Access Server Revenue (undefined) Forecast, by Application 2020 & 2033
- Table 82: India Broadband Remote Access Server Volume (K) Forecast, by Application 2020 & 2033
- Table 83: Japan Broadband Remote Access Server Revenue (undefined) Forecast, by Application 2020 & 2033
- Table 84: Japan Broadband Remote Access Server Volume (K) Forecast, by Application 2020 & 2033
- Table 85: South Korea Broadband Remote Access Server Revenue (undefined) Forecast, by Application 2020 & 2033
- Table 86: South Korea Broadband Remote Access Server Volume (K) Forecast, by Application 2020 & 2033
- Table 87: ASEAN Broadband Remote Access Server Revenue (undefined) Forecast, by Application 2020 & 2033
- Table 88: ASEAN Broadband Remote Access Server Volume (K) Forecast, by Application 2020 & 2033
- Table 89: Oceania Broadband Remote Access Server Revenue (undefined) Forecast, by Application 2020 & 2033
- Table 90: Oceania Broadband Remote Access Server Volume (K) Forecast, by Application 2020 & 2033
- Table 91: Rest of Asia Pacific Broadband Remote Access Server Revenue (undefined) Forecast, by Application 2020 & 2033
- Table 92: Rest of Asia Pacific Broadband Remote Access Server Volume (K) Forecast, by Application 2020 & 2033
Frequently Asked Questions
1. What is the projected Compound Annual Growth Rate (CAGR) of the Broadband Remote Access Server?
The projected CAGR is approximately 6.1%.
2. Which companies are prominent players in the Broadband Remote Access Server?
Key companies in the market include Cisco Systems, Juniper Networks, Nokia, Huawei Technologies, Casa Systems, Ciena, netElastic, Waystream AB, Sanctum Networks, RtBrick.
3. What are the main segments of the Broadband Remote Access Server?
The market segments include Application, Types.
4. Can you provide details about the market size?
The market size is estimated to be USD XXX N/A as of 2022.
5. What are some drivers contributing to market growth?
N/A
6. What are the notable trends driving market growth?
N/A
7. Are there any restraints impacting market growth?
N/A
8. Can you provide examples of recent developments in the market?
N/A
9. What pricing options are available for accessing the report?
Pricing options include single-user, multi-user, and enterprise licenses priced at USD 3950.00, USD 5925.00, and USD 7900.00 respectively.
10. Is the market size provided in terms of value or volume?
The market size is provided in terms of value, measured in N/A and volume, measured in K.
11. Are there any specific market keywords associated with the report?
Yes, the market keyword associated with the report is "Broadband Remote Access Server," which aids in identifying and referencing the specific market segment covered.
12. How do I determine which pricing option suits my needs best?
The pricing options vary based on user requirements and access needs. Individual users may opt for single-user licenses, while businesses requiring broader access may choose multi-user or enterprise licenses for cost-effective access to the report.
13. Are there any additional resources or data provided in the Broadband Remote Access Server report?
While the report offers comprehensive insights, it's advisable to review the specific contents or supplementary materials provided to ascertain if additional resources or data are available.
14. How can I stay updated on further developments or reports in the Broadband Remote Access Server?
To stay informed about further developments, trends, and reports in the Broadband Remote Access Server, consider subscribing to industry newsletters, following relevant companies and organizations, or regularly checking reputable industry news sources and publications.
Methodology
Step 1 - Identification of Relevant Samples Size from Population Database


Step 2 - Approaches for Defining Global Market Size (Value, Volume* & Price*)

Note*: In applicable scenarios
Step 3 - Data Sources
Primary Research
- Web Analytics
- Survey Reports
- Research Institute
- Latest Research Reports
- Opinion Leaders
Secondary Research
- Annual Reports
- White Paper
- Latest Press Release
- Industry Association
- Paid Database
- Investor Presentations

Step 4 - Data Triangulation
Involves using different sources of information in order to increase the validity of a study
These sources are likely to be stakeholders in a program - participants, other researchers, program staff, other community members, and so on.
Then we put all data in single framework & apply various statistical tools to find out the dynamic on the market.
During the analysis stage, feedback from the stakeholder groups would be compared to determine areas of agreement as well as areas of divergence