

Key Insights
The global booster amplifier market, projected to reach $1.5 billion by 2025, is poised for significant expansion. This growth, anticipated at a compound annual growth rate (CAGR) of 10.52% from 2025 to 2033, is primarily attributed to escalating demand for high-speed data transmission across diverse industries. Key drivers include the widespread deployment of 5G networks, the expansion of cloud computing infrastructure, and the accelerating adoption of fiber optic communication technologies. These advancements require high-performance amplifiers to mitigate signal degradation and ensure consistent, long-distance data integrity.
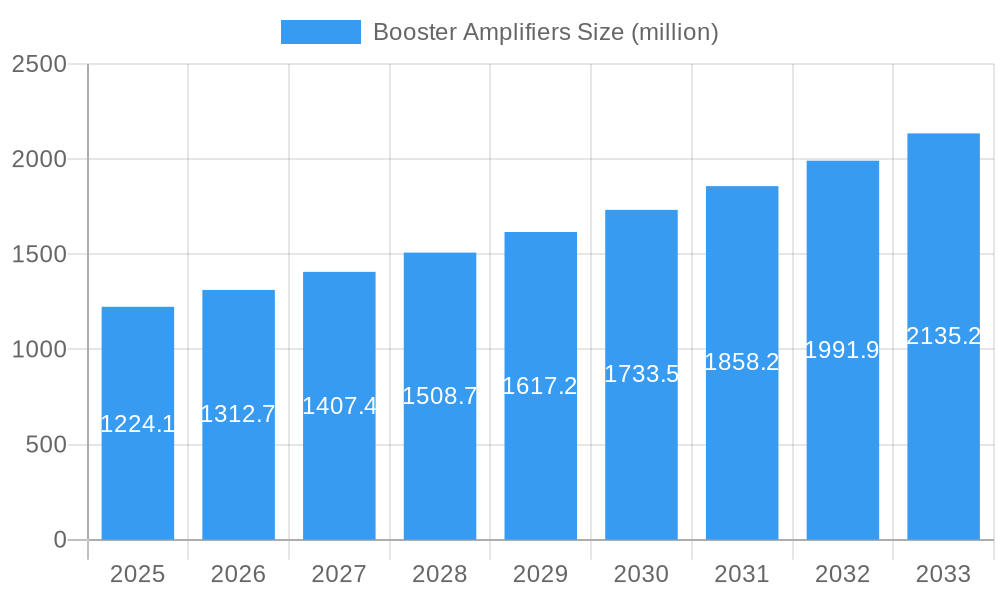
Booster Amplifiers Market Size (In Billion)
The market's upward trajectory is further supported by the increasing density of data centers and the critical need for robust network infrastructure development in emerging economies. Technological innovations, focusing on developing more efficient, compact amplifiers with superior signal-to-noise ratios, are also pivotal in driving market penetration.
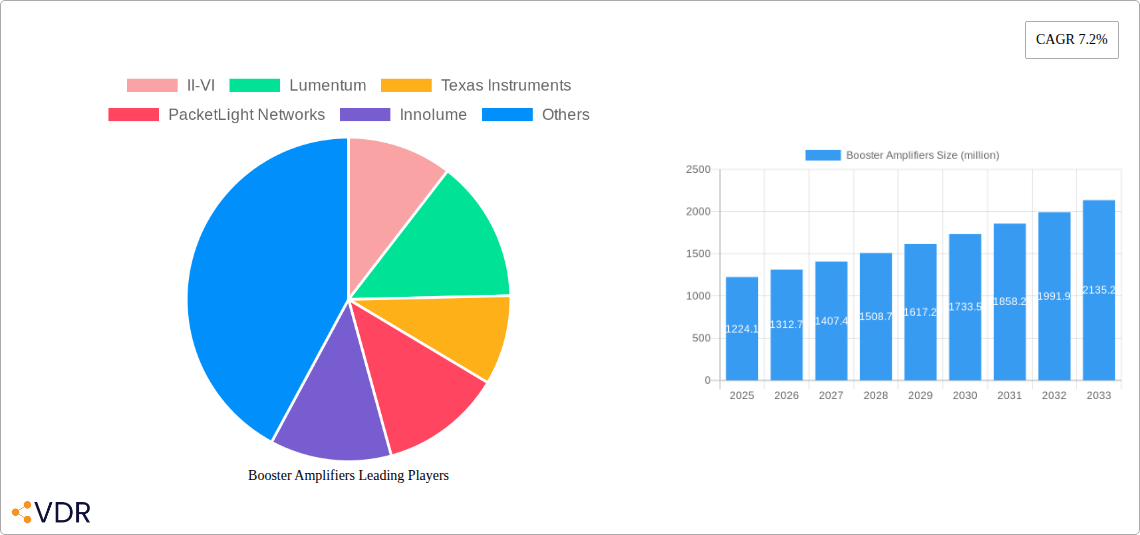
Booster Amplifiers Company Market Share
Despite this positive outlook, the market confronts certain hurdles. The premium pricing of advanced booster amplifier technologies may pose adoption challenges, particularly in price-sensitive regions. Intensified competition from established vendors and new market entrants could also lead to price pressures. Nevertheless, ongoing efforts to develop more affordable solutions and strategic collaborations are expected to counterbalance these restraints. The market is witnessing a pronounced demand for high-capacity amplifiers, with the Asia-Pacific region anticipated to lead growth, propelled by substantial infrastructure investments. Leading companies such as II-VI, Lumentum, and Texas Instruments are actively engaged in research and development and expanding their product offerings to secure a competitive advantage.
Booster Amplifiers Market Report: 2019-2033
This comprehensive report provides an in-depth analysis of the global booster amplifier market, encompassing market dynamics, growth trends, regional analysis, product landscape, key players, and future outlook. The study period covers 2019-2033, with 2025 as the base year and a forecast period of 2025-2033. This report is crucial for industry professionals, investors, and strategic decision-makers seeking a detailed understanding of this rapidly evolving market. The parent market is optical communication and the child market is optical amplifier.
Booster Amplifiers Market Dynamics & Structure
The global booster amplifier market, valued at xx million units in 2025, exhibits a moderately concentrated structure with key players like II-VI, Lumentum, and Texas Instruments holding significant market share. Technological innovation, driven by advancements in semiconductor materials and optical fiber technology, is a primary growth driver. Stringent regulatory frameworks concerning optical communication infrastructure influence market dynamics, while the emergence of alternative technologies (like improved signal processing techniques) poses competitive pressure. The market is significantly influenced by end-user demographics, particularly the growth of data centers and the expansion of 5G networks. Mergers and acquisitions (M&A) activity has been relatively moderate in recent years, with xx major deals recorded between 2019 and 2024.
- Market Concentration: Moderately concentrated, with top 3 players holding approximately xx% market share in 2025.
- Technological Innovation: Significant advancements in semiconductor materials (e.g., III-V materials) and optical fiber designs are driving efficiency and performance improvements.
- Regulatory Frameworks: Government regulations concerning network infrastructure deployments and spectrum allocation impact market growth.
- Competitive Substitutes: Improved signal processing techniques and software-defined networking present competitive challenges.
- End-User Demographics: Growth in data centers, cloud computing, and 5G networks fuels demand.
- M&A Activity: xx major M&A deals recorded between 2019 and 2024, indicating consolidation trends.
Booster Amplifiers Growth Trends & Insights
The global booster amplifier market witnessed robust growth during the historical period (2019-2024), with a CAGR of xx%. This growth is primarily attributed to the increasing demand for high-bandwidth, long-haul optical communication systems. The adoption rate of booster amplifiers across various applications (e.g., long-haul transmission, metro networks) has increased steadily, reflecting the rising need for efficient and reliable data transmission. Technological disruptions, particularly in the development of more energy-efficient and higher-capacity amplifiers, have further propelled market growth. Shifting consumer behavior towards higher data consumption rates and increased reliance on cloud-based services are key factors driving market expansion. Market penetration in developing economies is expected to accelerate in the forecast period. The overall market is projected to reach xx million units by 2033, maintaining a healthy CAGR of xx% during the forecast period (2025-2033).
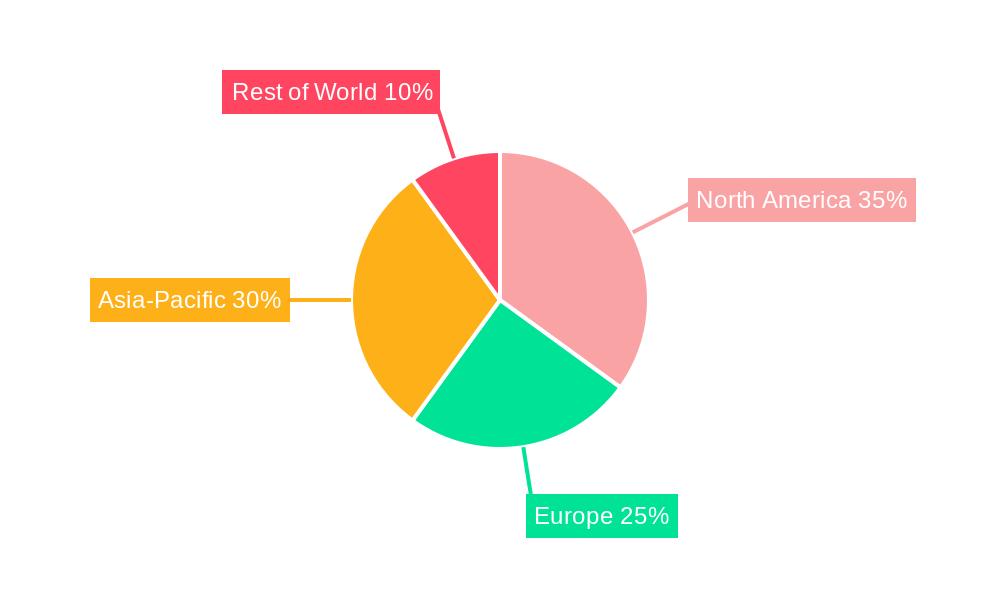
Dominant Regions, Countries, or Segments in Booster Amplifiers
North America currently dominates the global booster amplifier market, driven by substantial investments in advanced telecommunication infrastructure and the presence of major technology companies. Asia-Pacific is anticipated to experience the fastest growth, fuelled by rapid economic development, expanding digitalization, and significant infrastructure investments in countries like China and India. The long-haul segment holds the largest market share due to the high capacity requirements of long-distance optical communication links.
- North America: Strong market presence due to advanced infrastructure and significant technology investments.
- Asia-Pacific: Fastest-growing region, propelled by economic growth, digitalization, and infrastructure investments.
- Europe: Steady growth driven by the expansion of 5G networks and increasing demand for high-speed internet.
- Long-haul segment: Largest market share due to the need for high-capacity transmission over long distances.
Booster Amplifiers Product Landscape
Booster amplifiers are characterized by diverse designs catering to various applications and bandwidth requirements. Recent innovations focus on enhancing efficiency, power output, and spectral reach. Key features driving product differentiation include improved signal-to-noise ratio (SNR), reduced power consumption, and compatibility with advanced modulation formats. The integration of advanced semiconductor materials, such as III-V compounds, has significantly advanced amplifier performance.
Key Drivers, Barriers & Challenges in Booster Amplifiers
Key Drivers: The escalating demand for higher bandwidth in optical communication networks, fueled by the growth of cloud computing, data centers, and 5G deployments, is a primary driver. Advancements in semiconductor technology leading to more efficient and higher-capacity amplifiers also contribute significantly. Favorable government policies and initiatives supporting infrastructure development further bolster market growth.
Key Challenges: The high initial investment cost associated with installing booster amplifiers presents a barrier to entry for some market participants. The intense competition among established players, coupled with the emergence of alternative technologies, creates a challenging competitive landscape. Supply chain disruptions and fluctuations in raw material prices can impact production costs and profitability.
Emerging Opportunities in Booster Amplifiers
The integration of booster amplifiers into next-generation optical communication networks, such as coherent optical systems, presents significant opportunities. Expanding into emerging markets with growing infrastructure needs, coupled with exploring applications in areas like submarine cable systems and satellite communications, offers substantial growth potential. The development of energy-efficient, compact, and cost-effective amplifier designs will further drive adoption.
Growth Accelerators in the Booster Amplifiers Industry
Strategic partnerships between amplifier manufacturers and telecommunication operators are accelerating market penetration. Technological breakthroughs, focusing on improved performance metrics and reduced operational costs, are key drivers of growth. The expansion into new applications and markets, along with a sustained focus on research and development, further contributes to long-term market expansion.
Key Players Shaping the Booster Amplifiers Market
- II-VI
- Lumentum
- Texas Instruments
- PacketLight Networks
- Innolume
- Cisco
- MPBC
- American Microsemiconductor
- Pan Dacom Direkt
- Amonics
- Wuxi Taclink Optoelectronics Technology
- Acce Link
- HUAWEI
Notable Milestones in Booster Amplifiers Sector
- 2020, Q4: II-VI announced the launch of a new high-power booster amplifier with enhanced spectral efficiency.
- 2021, Q2: Lumentum acquired a smaller amplifier manufacturer, expanding its product portfolio.
- 2022, Q3: Texas Instruments introduced a new chip design for improved amplifier performance and power efficiency.
- 2023, Q1: Significant investments in R&D were reported by several major players in the sector. (Specific amounts are unavailable at this time - xx million units invested)
In-Depth Booster Amplifiers Market Outlook
The future of the booster amplifier market looks promising, with ongoing technological advancements and increasing demand driving continued growth. Strategic partnerships and investments in R&D will further propel market expansion. The focus on improving energy efficiency, compactness, and cost-effectiveness will be crucial for sustaining market growth. The overall market is poised for robust growth, presenting lucrative opportunities for both established players and new entrants.
Booster Amplifiers Segmentation
-
1. Application
- 1.1. 4G Fronthaul
- 1.2. 5G Fronthaul
- 1.3. Data Link Acquisition
- 1.4. Ultra Long Distance Transmission
-
2. Types
- 2.1. Distributed Hybrid Fiber Amplifier
- 2.2. Lumped Hybrid Fiber Amplifier
Booster Amplifiers Segmentation By Geography
-
1. North America
- 1.1. United States
- 1.2. Canada
- 1.3. Mexico
-
2. South America
- 2.1. Brazil
- 2.2. Argentina
- 2.3. Rest of South America
-
3. Europe
- 3.1. United Kingdom
- 3.2. Germany
- 3.3. France
- 3.4. Italy
- 3.5. Spain
- 3.6. Russia
- 3.7. Benelux
- 3.8. Nordics
- 3.9. Rest of Europe
-
4. Middle East & Africa
- 4.1. Turkey
- 4.2. Israel
- 4.3. GCC
- 4.4. North Africa
- 4.5. South Africa
- 4.6. Rest of Middle East & Africa
-
5. Asia Pacific
- 5.1. China
- 5.2. India
- 5.3. Japan
- 5.4. South Korea
- 5.5. ASEAN
- 5.6. Oceania
- 5.7. Rest of Asia Pacific
Booster Amplifiers Regional Market Share
Geographic Coverage of Booster Amplifiers
Booster Amplifiers REPORT HIGHLIGHTS
| Aspects | Details |
|---|---|
| Study Period | 2020-2034 |
| Base Year | 2025 |
| Estimated Year | 2026 |
| Forecast Period | 2026-2034 |
| Historical Period | 2020-2025 |
| Growth Rate | CAGR of 10.52% from 2020-2034 |
| Segmentation |
|
Table of Contents
- 1. Introduction
- 1.1. Research Scope
- 1.2. Market Segmentation
- 1.3. Research Objective
- 1.4. Definitions and Assumptions
- 2. Executive Summary
- 2.1. Market Snapshot
- 3. Market Dynamics
- 3.1. Market Drivers
- 3.2. Market Restrains
- 3.3. Market Trends
- 3.4. Market Opportunities
- 4. Market Factor Analysis
- 4.1. Porters Five Forces
- 4.1.1. Bargaining Power of Suppliers
- 4.1.2. Bargaining Power of Buyers
- 4.1.3. Threat of New Entrants
- 4.1.4. Threat of Substitutes
- 4.1.5. Competitive Rivalry
- 4.2. PESTEL analysis
- 4.3. BCG Analysis
- 4.3.1. Stars (High Growth, High Market Share)
- 4.3.2. Cash Cows (Low Growth, High Market Share)
- 4.3.3. Question Mark (High Growth, Low Market Share)
- 4.3.4. Dogs (Low Growth, Low Market Share)
- 4.4. Ansoff Matrix Analysis
- 4.5. Supply Chain Analysis
- 4.6. Regulatory Landscape
- 4.7. Current Market Potential and Opportunity Assessment (TAM–SAM–SOM Framework)
- 4.8. VDR Analyst Note
- 4.1. Porters Five Forces
- 5. Market Analysis, Insights and Forecast 2021-2033
- 5.1. Market Analysis, Insights and Forecast - by Application
- 5.1.1. 4G Fronthaul
- 5.1.2. 5G Fronthaul
- 5.1.3. Data Link Acquisition
- 5.1.4. Ultra Long Distance Transmission
- 5.2. Market Analysis, Insights and Forecast - by Types
- 5.2.1. Distributed Hybrid Fiber Amplifier
- 5.2.2. Lumped Hybrid Fiber Amplifier
- 5.3. Market Analysis, Insights and Forecast - by Region
- 5.3.1. North America
- 5.3.2. South America
- 5.3.3. Europe
- 5.3.4. Middle East & Africa
- 5.3.5. Asia Pacific
- 5.1. Market Analysis, Insights and Forecast - by Application
- 6. Global Booster Amplifiers Analysis, Insights and Forecast, 2021-2033
- 6.1. Market Analysis, Insights and Forecast - by Application
- 6.1.1. 4G Fronthaul
- 6.1.2. 5G Fronthaul
- 6.1.3. Data Link Acquisition
- 6.1.4. Ultra Long Distance Transmission
- 6.2. Market Analysis, Insights and Forecast - by Types
- 6.2.1. Distributed Hybrid Fiber Amplifier
- 6.2.2. Lumped Hybrid Fiber Amplifier
- 6.1. Market Analysis, Insights and Forecast - by Application
- 7. North America Booster Amplifiers Analysis, Insights and Forecast, 2021-2033
- 7.1. Market Analysis, Insights and Forecast - by Application
- 7.1.1. 4G Fronthaul
- 7.1.2. 5G Fronthaul
- 7.1.3. Data Link Acquisition
- 7.1.4. Ultra Long Distance Transmission
- 7.2. Market Analysis, Insights and Forecast - by Types
- 7.2.1. Distributed Hybrid Fiber Amplifier
- 7.2.2. Lumped Hybrid Fiber Amplifier
- 7.1. Market Analysis, Insights and Forecast - by Application
- 8. South America Booster Amplifiers Analysis, Insights and Forecast, 2021-2033
- 8.1. Market Analysis, Insights and Forecast - by Application
- 8.1.1. 4G Fronthaul
- 8.1.2. 5G Fronthaul
- 8.1.3. Data Link Acquisition
- 8.1.4. Ultra Long Distance Transmission
- 8.2. Market Analysis, Insights and Forecast - by Types
- 8.2.1. Distributed Hybrid Fiber Amplifier
- 8.2.2. Lumped Hybrid Fiber Amplifier
- 8.1. Market Analysis, Insights and Forecast - by Application
- 9. Europe Booster Amplifiers Analysis, Insights and Forecast, 2021-2033
- 9.1. Market Analysis, Insights and Forecast - by Application
- 9.1.1. 4G Fronthaul
- 9.1.2. 5G Fronthaul
- 9.1.3. Data Link Acquisition
- 9.1.4. Ultra Long Distance Transmission
- 9.2. Market Analysis, Insights and Forecast - by Types
- 9.2.1. Distributed Hybrid Fiber Amplifier
- 9.2.2. Lumped Hybrid Fiber Amplifier
- 9.1. Market Analysis, Insights and Forecast - by Application
- 10. Middle East & Africa Booster Amplifiers Analysis, Insights and Forecast, 2021-2033
- 10.1. Market Analysis, Insights and Forecast - by Application
- 10.1.1. 4G Fronthaul
- 10.1.2. 5G Fronthaul
- 10.1.3. Data Link Acquisition
- 10.1.4. Ultra Long Distance Transmission
- 10.2. Market Analysis, Insights and Forecast - by Types
- 10.2.1. Distributed Hybrid Fiber Amplifier
- 10.2.2. Lumped Hybrid Fiber Amplifier
- 10.1. Market Analysis, Insights and Forecast - by Application
- 11. Asia Pacific Booster Amplifiers Analysis, Insights and Forecast, 2021-2033
- 11.1. Market Analysis, Insights and Forecast - by Application
- 11.1.1. 4G Fronthaul
- 11.1.2. 5G Fronthaul
- 11.1.3. Data Link Acquisition
- 11.1.4. Ultra Long Distance Transmission
- 11.2. Market Analysis, Insights and Forecast - by Types
- 11.2.1. Distributed Hybrid Fiber Amplifier
- 11.2.2. Lumped Hybrid Fiber Amplifier
- 11.1. Market Analysis, Insights and Forecast - by Application
- 12. Competitive Analysis
- 12.1. Company Profiles
- 12.1.1 II-VI
- 12.1.1.1. Company Overview
- 12.1.1.2. Products
- 12.1.1.3. Company Financials
- 12.1.1.4. SWOT Analysis
- 12.1.2 Lumentum
- 12.1.2.1. Company Overview
- 12.1.2.2. Products
- 12.1.2.3. Company Financials
- 12.1.2.4. SWOT Analysis
- 12.1.3 Texas Instruments
- 12.1.3.1. Company Overview
- 12.1.3.2. Products
- 12.1.3.3. Company Financials
- 12.1.3.4. SWOT Analysis
- 12.1.4 PacketLight Networks
- 12.1.4.1. Company Overview
- 12.1.4.2. Products
- 12.1.4.3. Company Financials
- 12.1.4.4. SWOT Analysis
- 12.1.5 Innolume
- 12.1.5.1. Company Overview
- 12.1.5.2. Products
- 12.1.5.3. Company Financials
- 12.1.5.4. SWOT Analysis
- 12.1.6 Cisco
- 12.1.6.1. Company Overview
- 12.1.6.2. Products
- 12.1.6.3. Company Financials
- 12.1.6.4. SWOT Analysis
- 12.1.7 MPBC
- 12.1.7.1. Company Overview
- 12.1.7.2. Products
- 12.1.7.3. Company Financials
- 12.1.7.4. SWOT Analysis
- 12.1.8 American Microsemiconductor
- 12.1.8.1. Company Overview
- 12.1.8.2. Products
- 12.1.8.3. Company Financials
- 12.1.8.4. SWOT Analysis
- 12.1.9 Pan Dacom Direkt
- 12.1.9.1. Company Overview
- 12.1.9.2. Products
- 12.1.9.3. Company Financials
- 12.1.9.4. SWOT Analysis
- 12.1.10 Amonics
- 12.1.10.1. Company Overview
- 12.1.10.2. Products
- 12.1.10.3. Company Financials
- 12.1.10.4. SWOT Analysis
- 12.1.11 Wuxi Taclink Optoelectronics Technology
- 12.1.11.1. Company Overview
- 12.1.11.2. Products
- 12.1.11.3. Company Financials
- 12.1.11.4. SWOT Analysis
- 12.1.12 Acce Link
- 12.1.12.1. Company Overview
- 12.1.12.2. Products
- 12.1.12.3. Company Financials
- 12.1.12.4. SWOT Analysis
- 12.1.13 HUAWEI
- 12.1.13.1. Company Overview
- 12.1.13.2. Products
- 12.1.13.3. Company Financials
- 12.1.13.4. SWOT Analysis
- 12.1.1 II-VI
- 12.2. Market Entropy
- 12.2.1 Company's Key Areas Served
- 12.2.2 Recent Developments
- 12.3. Company Market Share Analysis 2025
- 12.3.1 Top 5 Companies Market Share Analysis
- 12.3.2 Top 3 Companies Market Share Analysis
- 12.4. List of Potential Customers
- 13. Research Methodology
List of Figures
- Figure 1: Global Booster Amplifiers Revenue Breakdown (billion, %) by Region 2025 & 2033
- Figure 2: Global Booster Amplifiers Volume Breakdown (K, %) by Region 2025 & 2033
- Figure 3: North America Booster Amplifiers Revenue (billion), by Application 2025 & 2033
- Figure 4: North America Booster Amplifiers Volume (K), by Application 2025 & 2033
- Figure 5: North America Booster Amplifiers Revenue Share (%), by Application 2025 & 2033
- Figure 6: North America Booster Amplifiers Volume Share (%), by Application 2025 & 2033
- Figure 7: North America Booster Amplifiers Revenue (billion), by Types 2025 & 2033
- Figure 8: North America Booster Amplifiers Volume (K), by Types 2025 & 2033
- Figure 9: North America Booster Amplifiers Revenue Share (%), by Types 2025 & 2033
- Figure 10: North America Booster Amplifiers Volume Share (%), by Types 2025 & 2033
- Figure 11: North America Booster Amplifiers Revenue (billion), by Country 2025 & 2033
- Figure 12: North America Booster Amplifiers Volume (K), by Country 2025 & 2033
- Figure 13: North America Booster Amplifiers Revenue Share (%), by Country 2025 & 2033
- Figure 14: North America Booster Amplifiers Volume Share (%), by Country 2025 & 2033
- Figure 15: South America Booster Amplifiers Revenue (billion), by Application 2025 & 2033
- Figure 16: South America Booster Amplifiers Volume (K), by Application 2025 & 2033
- Figure 17: South America Booster Amplifiers Revenue Share (%), by Application 2025 & 2033
- Figure 18: South America Booster Amplifiers Volume Share (%), by Application 2025 & 2033
- Figure 19: South America Booster Amplifiers Revenue (billion), by Types 2025 & 2033
- Figure 20: South America Booster Amplifiers Volume (K), by Types 2025 & 2033
- Figure 21: South America Booster Amplifiers Revenue Share (%), by Types 2025 & 2033
- Figure 22: South America Booster Amplifiers Volume Share (%), by Types 2025 & 2033
- Figure 23: South America Booster Amplifiers Revenue (billion), by Country 2025 & 2033
- Figure 24: South America Booster Amplifiers Volume (K), by Country 2025 & 2033
- Figure 25: South America Booster Amplifiers Revenue Share (%), by Country 2025 & 2033
- Figure 26: South America Booster Amplifiers Volume Share (%), by Country 2025 & 2033
- Figure 27: Europe Booster Amplifiers Revenue (billion), by Application 2025 & 2033
- Figure 28: Europe Booster Amplifiers Volume (K), by Application 2025 & 2033
- Figure 29: Europe Booster Amplifiers Revenue Share (%), by Application 2025 & 2033
- Figure 30: Europe Booster Amplifiers Volume Share (%), by Application 2025 & 2033
- Figure 31: Europe Booster Amplifiers Revenue (billion), by Types 2025 & 2033
- Figure 32: Europe Booster Amplifiers Volume (K), by Types 2025 & 2033
- Figure 33: Europe Booster Amplifiers Revenue Share (%), by Types 2025 & 2033
- Figure 34: Europe Booster Amplifiers Volume Share (%), by Types 2025 & 2033
- Figure 35: Europe Booster Amplifiers Revenue (billion), by Country 2025 & 2033
- Figure 36: Europe Booster Amplifiers Volume (K), by Country 2025 & 2033
- Figure 37: Europe Booster Amplifiers Revenue Share (%), by Country 2025 & 2033
- Figure 38: Europe Booster Amplifiers Volume Share (%), by Country 2025 & 2033
- Figure 39: Middle East & Africa Booster Amplifiers Revenue (billion), by Application 2025 & 2033
- Figure 40: Middle East & Africa Booster Amplifiers Volume (K), by Application 2025 & 2033
- Figure 41: Middle East & Africa Booster Amplifiers Revenue Share (%), by Application 2025 & 2033
- Figure 42: Middle East & Africa Booster Amplifiers Volume Share (%), by Application 2025 & 2033
- Figure 43: Middle East & Africa Booster Amplifiers Revenue (billion), by Types 2025 & 2033
- Figure 44: Middle East & Africa Booster Amplifiers Volume (K), by Types 2025 & 2033
- Figure 45: Middle East & Africa Booster Amplifiers Revenue Share (%), by Types 2025 & 2033
- Figure 46: Middle East & Africa Booster Amplifiers Volume Share (%), by Types 2025 & 2033
- Figure 47: Middle East & Africa Booster Amplifiers Revenue (billion), by Country 2025 & 2033
- Figure 48: Middle East & Africa Booster Amplifiers Volume (K), by Country 2025 & 2033
- Figure 49: Middle East & Africa Booster Amplifiers Revenue Share (%), by Country 2025 & 2033
- Figure 50: Middle East & Africa Booster Amplifiers Volume Share (%), by Country 2025 & 2033
- Figure 51: Asia Pacific Booster Amplifiers Revenue (billion), by Application 2025 & 2033
- Figure 52: Asia Pacific Booster Amplifiers Volume (K), by Application 2025 & 2033
- Figure 53: Asia Pacific Booster Amplifiers Revenue Share (%), by Application 2025 & 2033
- Figure 54: Asia Pacific Booster Amplifiers Volume Share (%), by Application 2025 & 2033
- Figure 55: Asia Pacific Booster Amplifiers Revenue (billion), by Types 2025 & 2033
- Figure 56: Asia Pacific Booster Amplifiers Volume (K), by Types 2025 & 2033
- Figure 57: Asia Pacific Booster Amplifiers Revenue Share (%), by Types 2025 & 2033
- Figure 58: Asia Pacific Booster Amplifiers Volume Share (%), by Types 2025 & 2033
- Figure 59: Asia Pacific Booster Amplifiers Revenue (billion), by Country 2025 & 2033
- Figure 60: Asia Pacific Booster Amplifiers Volume (K), by Country 2025 & 2033
- Figure 61: Asia Pacific Booster Amplifiers Revenue Share (%), by Country 2025 & 2033
- Figure 62: Asia Pacific Booster Amplifiers Volume Share (%), by Country 2025 & 2033
List of Tables
- Table 1: Global Booster Amplifiers Revenue billion Forecast, by Application 2020 & 2033
- Table 2: Global Booster Amplifiers Volume K Forecast, by Application 2020 & 2033
- Table 3: Global Booster Amplifiers Revenue billion Forecast, by Types 2020 & 2033
- Table 4: Global Booster Amplifiers Volume K Forecast, by Types 2020 & 2033
- Table 5: Global Booster Amplifiers Revenue billion Forecast, by Region 2020 & 2033
- Table 6: Global Booster Amplifiers Volume K Forecast, by Region 2020 & 2033
- Table 7: Global Booster Amplifiers Revenue billion Forecast, by Application 2020 & 2033
- Table 8: Global Booster Amplifiers Volume K Forecast, by Application 2020 & 2033
- Table 9: Global Booster Amplifiers Revenue billion Forecast, by Types 2020 & 2033
- Table 10: Global Booster Amplifiers Volume K Forecast, by Types 2020 & 2033
- Table 11: Global Booster Amplifiers Revenue billion Forecast, by Country 2020 & 2033
- Table 12: Global Booster Amplifiers Volume K Forecast, by Country 2020 & 2033
- Table 13: United States Booster Amplifiers Revenue (billion) Forecast, by Application 2020 & 2033
- Table 14: United States Booster Amplifiers Volume (K) Forecast, by Application 2020 & 2033
- Table 15: Canada Booster Amplifiers Revenue (billion) Forecast, by Application 2020 & 2033
- Table 16: Canada Booster Amplifiers Volume (K) Forecast, by Application 2020 & 2033
- Table 17: Mexico Booster Amplifiers Revenue (billion) Forecast, by Application 2020 & 2033
- Table 18: Mexico Booster Amplifiers Volume (K) Forecast, by Application 2020 & 2033
- Table 19: Global Booster Amplifiers Revenue billion Forecast, by Application 2020 & 2033
- Table 20: Global Booster Amplifiers Volume K Forecast, by Application 2020 & 2033
- Table 21: Global Booster Amplifiers Revenue billion Forecast, by Types 2020 & 2033
- Table 22: Global Booster Amplifiers Volume K Forecast, by Types 2020 & 2033
- Table 23: Global Booster Amplifiers Revenue billion Forecast, by Country 2020 & 2033
- Table 24: Global Booster Amplifiers Volume K Forecast, by Country 2020 & 2033
- Table 25: Brazil Booster Amplifiers Revenue (billion) Forecast, by Application 2020 & 2033
- Table 26: Brazil Booster Amplifiers Volume (K) Forecast, by Application 2020 & 2033
- Table 27: Argentina Booster Amplifiers Revenue (billion) Forecast, by Application 2020 & 2033
- Table 28: Argentina Booster Amplifiers Volume (K) Forecast, by Application 2020 & 2033
- Table 29: Rest of South America Booster Amplifiers Revenue (billion) Forecast, by Application 2020 & 2033
- Table 30: Rest of South America Booster Amplifiers Volume (K) Forecast, by Application 2020 & 2033
- Table 31: Global Booster Amplifiers Revenue billion Forecast, by Application 2020 & 2033
- Table 32: Global Booster Amplifiers Volume K Forecast, by Application 2020 & 2033
- Table 33: Global Booster Amplifiers Revenue billion Forecast, by Types 2020 & 2033
- Table 34: Global Booster Amplifiers Volume K Forecast, by Types 2020 & 2033
- Table 35: Global Booster Amplifiers Revenue billion Forecast, by Country 2020 & 2033
- Table 36: Global Booster Amplifiers Volume K Forecast, by Country 2020 & 2033
- Table 37: United Kingdom Booster Amplifiers Revenue (billion) Forecast, by Application 2020 & 2033
- Table 38: United Kingdom Booster Amplifiers Volume (K) Forecast, by Application 2020 & 2033
- Table 39: Germany Booster Amplifiers Revenue (billion) Forecast, by Application 2020 & 2033
- Table 40: Germany Booster Amplifiers Volume (K) Forecast, by Application 2020 & 2033
- Table 41: France Booster Amplifiers Revenue (billion) Forecast, by Application 2020 & 2033
- Table 42: France Booster Amplifiers Volume (K) Forecast, by Application 2020 & 2033
- Table 43: Italy Booster Amplifiers Revenue (billion) Forecast, by Application 2020 & 2033
- Table 44: Italy Booster Amplifiers Volume (K) Forecast, by Application 2020 & 2033
- Table 45: Spain Booster Amplifiers Revenue (billion) Forecast, by Application 2020 & 2033
- Table 46: Spain Booster Amplifiers Volume (K) Forecast, by Application 2020 & 2033
- Table 47: Russia Booster Amplifiers Revenue (billion) Forecast, by Application 2020 & 2033
- Table 48: Russia Booster Amplifiers Volume (K) Forecast, by Application 2020 & 2033
- Table 49: Benelux Booster Amplifiers Revenue (billion) Forecast, by Application 2020 & 2033
- Table 50: Benelux Booster Amplifiers Volume (K) Forecast, by Application 2020 & 2033
- Table 51: Nordics Booster Amplifiers Revenue (billion) Forecast, by Application 2020 & 2033
- Table 52: Nordics Booster Amplifiers Volume (K) Forecast, by Application 2020 & 2033
- Table 53: Rest of Europe Booster Amplifiers Revenue (billion) Forecast, by Application 2020 & 2033
- Table 54: Rest of Europe Booster Amplifiers Volume (K) Forecast, by Application 2020 & 2033
- Table 55: Global Booster Amplifiers Revenue billion Forecast, by Application 2020 & 2033
- Table 56: Global Booster Amplifiers Volume K Forecast, by Application 2020 & 2033
- Table 57: Global Booster Amplifiers Revenue billion Forecast, by Types 2020 & 2033
- Table 58: Global Booster Amplifiers Volume K Forecast, by Types 2020 & 2033
- Table 59: Global Booster Amplifiers Revenue billion Forecast, by Country 2020 & 2033
- Table 60: Global Booster Amplifiers Volume K Forecast, by Country 2020 & 2033
- Table 61: Turkey Booster Amplifiers Revenue (billion) Forecast, by Application 2020 & 2033
- Table 62: Turkey Booster Amplifiers Volume (K) Forecast, by Application 2020 & 2033
- Table 63: Israel Booster Amplifiers Revenue (billion) Forecast, by Application 2020 & 2033
- Table 64: Israel Booster Amplifiers Volume (K) Forecast, by Application 2020 & 2033
- Table 65: GCC Booster Amplifiers Revenue (billion) Forecast, by Application 2020 & 2033
- Table 66: GCC Booster Amplifiers Volume (K) Forecast, by Application 2020 & 2033
- Table 67: North Africa Booster Amplifiers Revenue (billion) Forecast, by Application 2020 & 2033
- Table 68: North Africa Booster Amplifiers Volume (K) Forecast, by Application 2020 & 2033
- Table 69: South Africa Booster Amplifiers Revenue (billion) Forecast, by Application 2020 & 2033
- Table 70: South Africa Booster Amplifiers Volume (K) Forecast, by Application 2020 & 2033
- Table 71: Rest of Middle East & Africa Booster Amplifiers Revenue (billion) Forecast, by Application 2020 & 2033
- Table 72: Rest of Middle East & Africa Booster Amplifiers Volume (K) Forecast, by Application 2020 & 2033
- Table 73: Global Booster Amplifiers Revenue billion Forecast, by Application 2020 & 2033
- Table 74: Global Booster Amplifiers Volume K Forecast, by Application 2020 & 2033
- Table 75: Global Booster Amplifiers Revenue billion Forecast, by Types 2020 & 2033
- Table 76: Global Booster Amplifiers Volume K Forecast, by Types 2020 & 2033
- Table 77: Global Booster Amplifiers Revenue billion Forecast, by Country 2020 & 2033
- Table 78: Global Booster Amplifiers Volume K Forecast, by Country 2020 & 2033
- Table 79: China Booster Amplifiers Revenue (billion) Forecast, by Application 2020 & 2033
- Table 80: China Booster Amplifiers Volume (K) Forecast, by Application 2020 & 2033
- Table 81: India Booster Amplifiers Revenue (billion) Forecast, by Application 2020 & 2033
- Table 82: India Booster Amplifiers Volume (K) Forecast, by Application 2020 & 2033
- Table 83: Japan Booster Amplifiers Revenue (billion) Forecast, by Application 2020 & 2033
- Table 84: Japan Booster Amplifiers Volume (K) Forecast, by Application 2020 & 2033
- Table 85: South Korea Booster Amplifiers Revenue (billion) Forecast, by Application 2020 & 2033
- Table 86: South Korea Booster Amplifiers Volume (K) Forecast, by Application 2020 & 2033
- Table 87: ASEAN Booster Amplifiers Revenue (billion) Forecast, by Application 2020 & 2033
- Table 88: ASEAN Booster Amplifiers Volume (K) Forecast, by Application 2020 & 2033
- Table 89: Oceania Booster Amplifiers Revenue (billion) Forecast, by Application 2020 & 2033
- Table 90: Oceania Booster Amplifiers Volume (K) Forecast, by Application 2020 & 2033
- Table 91: Rest of Asia Pacific Booster Amplifiers Revenue (billion) Forecast, by Application 2020 & 2033
- Table 92: Rest of Asia Pacific Booster Amplifiers Volume (K) Forecast, by Application 2020 & 2033
Frequently Asked Questions
1. What is the projected Compound Annual Growth Rate (CAGR) of the Booster Amplifiers?
The projected CAGR is approximately 10.52%.
2. Which companies are prominent players in the Booster Amplifiers?
Key companies in the market include II-VI, Lumentum, Texas Instruments, PacketLight Networks, Innolume, Cisco, MPBC, American Microsemiconductor, Pan Dacom Direkt, Amonics, Wuxi Taclink Optoelectronics Technology, Acce Link, HUAWEI.
3. What are the main segments of the Booster Amplifiers?
The market segments include Application, Types.
4. Can you provide details about the market size?
The market size is estimated to be USD 1.5 billion as of 2022.
5. What are some drivers contributing to market growth?
N/A
6. What are the notable trends driving market growth?
N/A
7. Are there any restraints impacting market growth?
N/A
8. Can you provide examples of recent developments in the market?
N/A
9. What pricing options are available for accessing the report?
Pricing options include single-user, multi-user, and enterprise licenses priced at USD 3350.00, USD 5025.00, and USD 6700.00 respectively.
10. Is the market size provided in terms of value or volume?
The market size is provided in terms of value, measured in billion and volume, measured in K.
11. Are there any specific market keywords associated with the report?
Yes, the market keyword associated with the report is "Booster Amplifiers," which aids in identifying and referencing the specific market segment covered.
12. How do I determine which pricing option suits my needs best?
The pricing options vary based on user requirements and access needs. Individual users may opt for single-user licenses, while businesses requiring broader access may choose multi-user or enterprise licenses for cost-effective access to the report.
13. Are there any additional resources or data provided in the Booster Amplifiers report?
While the report offers comprehensive insights, it's advisable to review the specific contents or supplementary materials provided to ascertain if additional resources or data are available.
14. How can I stay updated on further developments or reports in the Booster Amplifiers?
To stay informed about further developments, trends, and reports in the Booster Amplifiers, consider subscribing to industry newsletters, following relevant companies and organizations, or regularly checking reputable industry news sources and publications.
Methodology
Step 1 - Identification of Relevant Samples Size from Population Database


Step 2 - Approaches for Defining Global Market Size (Value, Volume* & Price*)

Note*: In applicable scenarios
Step 3 - Data Sources
Primary Research
- Web Analytics
- Survey Reports
- Research Institute
- Latest Research Reports
- Opinion Leaders
Secondary Research
- Annual Reports
- White Paper
- Latest Press Release
- Industry Association
- Paid Database
- Investor Presentations

Step 4 - Data Triangulation
Involves using different sources of information in order to increase the validity of a study
These sources are likely to be stakeholders in a program - participants, other researchers, program staff, other community members, and so on.
Then we put all data in single framework & apply various statistical tools to find out the dynamic on the market.
During the analysis stage, feedback from the stakeholder groups would be compared to determine areas of agreement as well as areas of divergence