
Key Insights
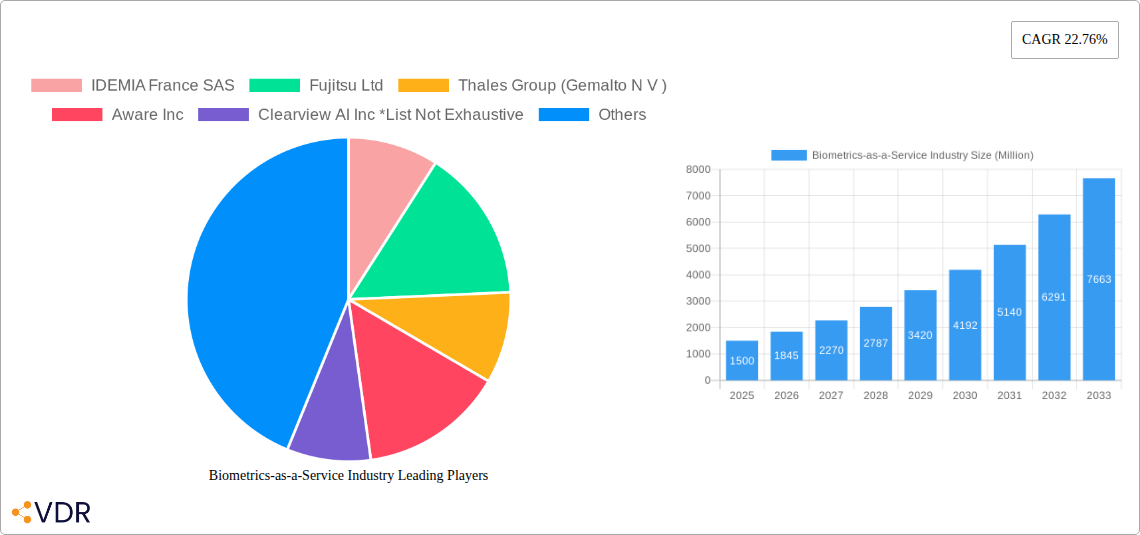
The Biometrics-as-a-Service (BaaS) market is experiencing rapid growth, driven by increasing demand for secure and convenient authentication solutions across various sectors. The market, valued at approximately $XX million in 2025, is projected to expand at a Compound Annual Growth Rate (CAGR) of 22.76% from 2025 to 2033. This robust growth is fueled by several key factors. The rising adoption of cloud-based solutions and the increasing need for enhanced security in both the public and private sectors are significant contributors. Furthermore, the expanding use of biometric technologies in mobile applications, access control systems, and time and attendance management is boosting market expansion. The diverse range of biometric modalities available, including fingerprint, facial, iris, and voice recognition, caters to a wide array of applications and user preferences, further fueling market growth. Government initiatives promoting digital identity and security are also playing a crucial role in driving market adoption. However, data privacy concerns and the potential for misuse remain key challenges that need to be addressed to ensure responsible and sustainable growth of the BaaS market.
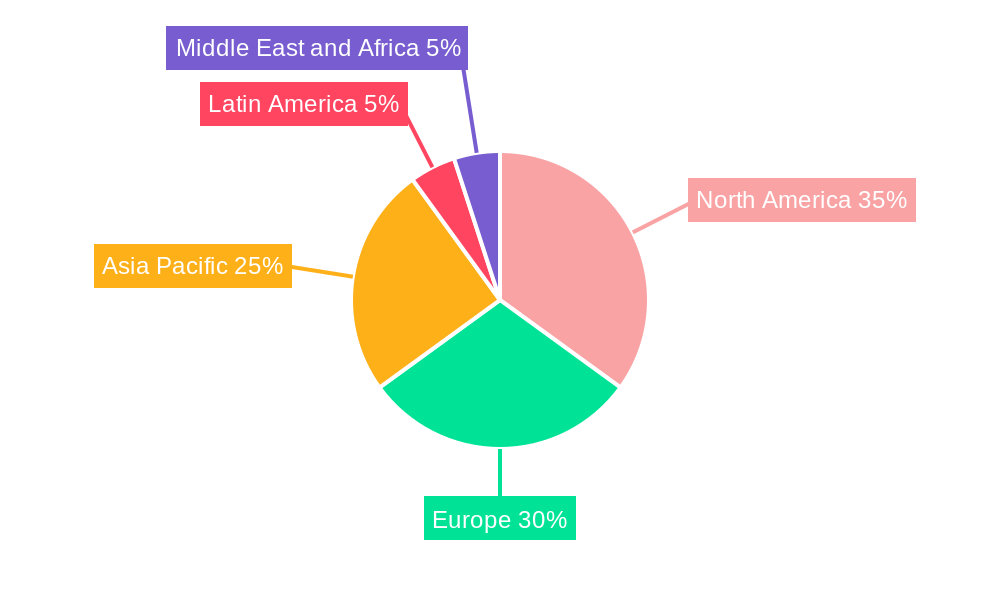
The segmentation of the BaaS market reveals further insights. The BFSI (Banking, Financial Services, and Insurance) sector is expected to be a major consumer of BaaS solutions, driven by the need for robust fraud prevention and secure customer authentication. The healthcare industry is also showing significant growth potential, with biometric authentication increasingly used for patient identification and access control in sensitive medical facilities. Among application types, site access control and time recording continue to hold considerable market share, while the mobile application segment is witnessing the fastest growth, reflecting the rising penetration of smartphones and mobile-first applications. Geographically, North America and Europe are currently leading the BaaS market, but the Asia-Pacific region is expected to experience the most significant growth in the coming years due to its large population and increasing digitalization efforts. The competitive landscape is characterized by a mix of established players and emerging technology companies, leading to continuous innovation and competition in the market.
Biometrics-as-a-Service (BaaS) Industry Market Report: 2019-2033
This comprehensive report provides a detailed analysis of the Biometrics-as-a-Service (BaaS) industry, encompassing market dynamics, growth trends, regional segmentation, product landscape, and key player strategies. With a study period spanning 2019-2033, a base year of 2025, and a forecast period of 2025-2033, this report offers invaluable insights for industry professionals, investors, and strategic decision-makers. The report covers parent markets such as the broader security and identification market and child markets like government authentication and mobile banking security. The global BaaS market is projected to reach xx Million by 2033.
Biometrics-as-a-Service Industry Market Dynamics & Structure
This section analyzes the competitive landscape, technological advancements, regulatory environment, and market forces shaping the BaaS industry. The market is characterized by a moderate level of concentration, with key players holding significant market share, but also witnessing increased competition from emerging innovative entrants. Technological innovation, particularly in AI and machine learning, is a key driver, enhancing accuracy, speed, and security. However, stringent data privacy regulations and ethical concerns pose challenges. Mergers and acquisitions are increasingly common, indicating consolidation and expansion within the sector.
- Market Concentration: Moderately concentrated, with the top 5 players holding approximately 40% market share in 2024.
- Technological Drivers: AI-powered biometrics, improved sensor technology, cloud computing.
- Regulatory Frameworks: GDPR, CCPA, and other regional data privacy regulations significantly impact market growth.
- Competitive Substitutes: Traditional security methods (passwords, tokens) pose competitive pressure.
- M&A Trends: xx M&A deals were recorded between 2019 and 2024, with an average deal value of xx Million.
- Innovation Barriers: High R&D costs, data security concerns, and ethical implications.
Biometrics-as-a-Service Industry Growth Trends & Insights
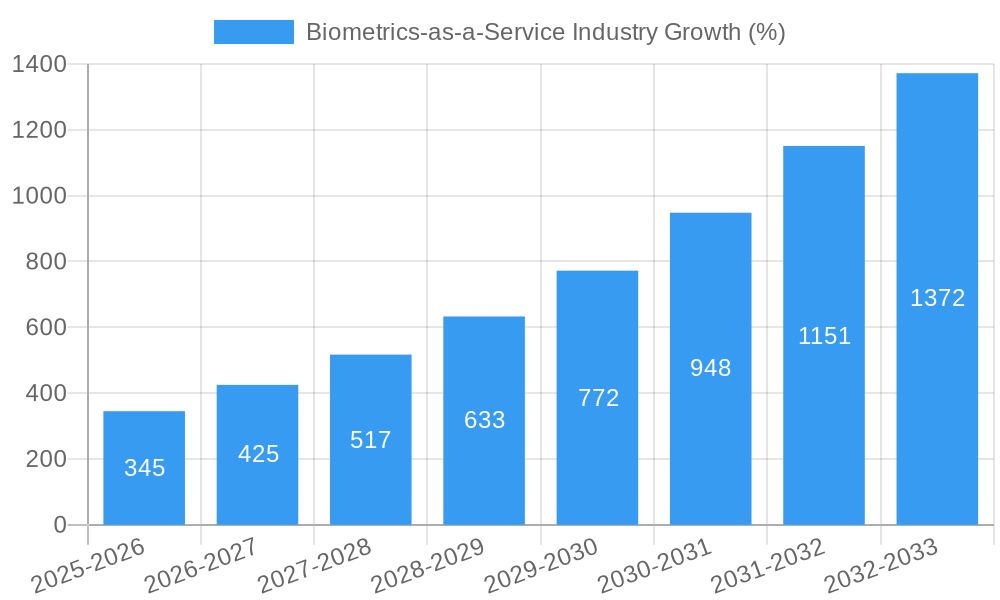
The BaaS market experienced significant growth during the historical period (2019-2024), driven by increasing demand for secure authentication solutions across various sectors. The market size in 2024 was estimated at xx Million, with a CAGR of xx% from 2019 to 2024. This growth is projected to continue during the forecast period (2025-2033), propelled by the rising adoption of biometric technologies in mobile applications, government initiatives promoting digital identity verification, and the expanding use of BaaS in various sectors. Technological advancements, such as improved accuracy and reduced latency, further fuel market expansion. Consumer behavior is shifting towards increased acceptance and reliance on biometric authentication, contributing to the market's growth trajectory. The market penetration rate is expected to increase from xx% in 2024 to xx% by 2033.
Dominant Regions, Countries, or Segments in Biometrics-as-a-Service Industry
North America currently dominates the BaaS market, driven by strong government initiatives and advanced technological infrastructure. However, Asia-Pacific is experiencing rapid growth, fueled by increasing smartphone penetration and a large consumer base. Within industry segments, Government and BFSI (Banking, Financial Services, and Insurance) are leading adopters, while the mobile application segment is projected to demonstrate the highest growth rate due to its integration into various digital platforms. Facial recognition is the most widely adopted scanner type, but other technologies such as fingerprint and iris recognition are also witnessing significant traction.
- Leading Region: North America (holding xx% market share in 2024)
- Fastest-Growing Region: Asia-Pacific (projected CAGR of xx% during 2025-2033)
- Leading End-user Industry: Government (xx% market share in 2024)
- Fastest-Growing Application: Mobile Application (projected CAGR of xx% during 2025-2033)
- Dominant Scanner Type: Facial Recognition (xx% market share in 2024)
Biometrics-as-a-Service Industry Product Landscape
The BaaS market offers a diverse range of products, from simple fingerprint scanners to sophisticated multi-modal biometric systems. These systems are integrated into various applications, providing secure authentication and access control. Key product differentiators include accuracy, speed, security features, and ease of integration. Continuous innovation is focused on improving the accuracy and speed of biometric recognition while minimizing false acceptance and rejection rates. The industry is also witnessing the development of more user-friendly interfaces and improved data security protocols.
Key Drivers, Barriers & Challenges in Biometrics-as-a-Service Industry
Key Drivers: Increased security concerns, government regulations promoting digital identity, rising adoption of mobile devices, and the need for seamless user authentication across multiple platforms.
Challenges: Data privacy concerns, regulatory hurdles, interoperability issues, high implementation costs, and potential bias in biometric algorithms. The impact of these challenges on market growth is estimated to be a reduction of approximately xx% in annual growth by 2030.
Emerging Opportunities in Biometrics-as-a-Service Industry
Emerging opportunities lie in the expansion of BaaS into new markets, such as healthcare and smart homes. The integration of biometric authentication into IoT devices and the development of more advanced and secure multi-modal biometric systems present significant potential for growth. Personalized biometric solutions, customized to individual user needs, are also gaining traction.
Growth Accelerators in the Biometrics-as-a-Service Industry Industry
Technological advancements such as AI-driven improvements in accuracy and speed, strategic partnerships between BaaS providers and technology companies, and increasing government support for the development and adoption of secure biometric systems are key accelerators of long-term market growth.
Key Players Shaping the Biometrics-as-a-Service Industry Market
- IDEMIA France SAS
- Fujitsu Ltd
- Thales Group (Gemalto N V)
- Aware Inc
- Clearview AI Inc
- ImageWare Systems Inc
- NEC Corporation
- Leidos Holdings Inc
- Mobbeel Solutions S L L
- BioEngagable Technologies Pvt Ltd
- M2SYS Technology - KernellÓ Inc
Notable Milestones in Biometrics-as-a-Service Industry Sector
- 2020: Increased adoption of facial recognition technology in mobile banking applications.
- 2021: Launch of several new multi-modal biometric authentication platforms.
- 2022: Significant investments in R&D to improve biometric accuracy and security.
- 2023: Several major M&A deals consolidating the market.
- 2024: Stringent data privacy regulations impacting industry development.
In-Depth Biometrics-as-a-Service Industry Market Outlook
The BaaS market is poised for substantial growth in the coming years, driven by ongoing technological advancements, increasing demand for secure authentication solutions, and expansion into new applications and markets. Strategic partnerships, focus on innovation, and robust data security protocols will be critical for success in this dynamic industry. The market is expected to experience a CAGR of xx% from 2025 to 2033, presenting lucrative opportunities for existing and new players alike.
Biometrics-as-a-Service Industry Segmentation
-
1. Application
- 1.1. Site Access Control
- 1.2. Time Recording
- 1.3. Mobile Application
- 1.4. Web and Workplace
-
2. Scanner Type
- 2.1. Fingerprint Recognition
- 2.2. Iris Recognition
- 2.3. Palm Recognition
- 2.4. Facial Recognition
- 2.5. Voice Recognition
- 2.6. Other Scanner Types
-
3. End-user Industry
- 3.1. Government
- 3.2. Retail
- 3.3. IT and Telecom
- 3.4. BFSI
- 3.5. Healthcare
- 3.6. Other End-user Industries
Biometrics-as-a-Service Industry Segmentation By Geography
- 1. North America
- 2. Europe
- 3. Asia Pacific
- 4. Latin America
- 5. Middle East and Africa
Biometrics-as-a-Service Industry REPORT HIGHLIGHTS
| Aspects | Details |
|---|---|
| Study Period | 2019-2033 |
| Base Year | 2024 |
| Estimated Year | 2025 |
| Forecast Period | 2025-2033 |
| Historical Period | 2019-2024 |
| Growth Rate | CAGR of 22.76% from 2019-2033 |
| Segmentation |
|
Table of Contents
- 1. Introduction
- 1.1. Research Scope
- 1.2. Market Segmentation
- 1.3. Research Methodology
- 1.4. Definitions and Assumptions
- 2. Executive Summary
- 2.1. Introduction
- 3. Market Dynamics
- 3.1. Introduction
- 3.2. Market Drivers
- 3.2.1. ; Need to Secure Increasing Online Transaction; Increased Sophistication of Security Threat; Governments Adopting Technology to Secure Citizens
- 3.3. Market Restrains
- 3.3.1. Regulatory and Policy Constraints; Technical Complexity and Expertise
- 3.4. Market Trends
- 3.4.1. Retail is Expected to Hold Significant Share
- 4. Market Factor Analysis
- 4.1. Porters Five Forces
- 4.2. Supply/Value Chain
- 4.3. PESTEL analysis
- 4.4. Market Entropy
- 4.5. Patent/Trademark Analysis
- 5. Global Biometrics-as-a-Service Industry Analysis, Insights and Forecast, 2019-2031
- 5.1. Market Analysis, Insights and Forecast - by Application
- 5.1.1. Site Access Control
- 5.1.2. Time Recording
- 5.1.3. Mobile Application
- 5.1.4. Web and Workplace
- 5.2. Market Analysis, Insights and Forecast - by Scanner Type
- 5.2.1. Fingerprint Recognition
- 5.2.2. Iris Recognition
- 5.2.3. Palm Recognition
- 5.2.4. Facial Recognition
- 5.2.5. Voice Recognition
- 5.2.6. Other Scanner Types
- 5.3. Market Analysis, Insights and Forecast - by End-user Industry
- 5.3.1. Government
- 5.3.2. Retail
- 5.3.3. IT and Telecom
- 5.3.4. BFSI
- 5.3.5. Healthcare
- 5.3.6. Other End-user Industries
- 5.4. Market Analysis, Insights and Forecast - by Region
- 5.4.1. North America
- 5.4.2. Europe
- 5.4.3. Asia Pacific
- 5.4.4. Latin America
- 5.4.5. Middle East and Africa
- 5.1. Market Analysis, Insights and Forecast - by Application
- 6. North America Biometrics-as-a-Service Industry Analysis, Insights and Forecast, 2019-2031
- 6.1. Market Analysis, Insights and Forecast - by Application
- 6.1.1. Site Access Control
- 6.1.2. Time Recording
- 6.1.3. Mobile Application
- 6.1.4. Web and Workplace
- 6.2. Market Analysis, Insights and Forecast - by Scanner Type
- 6.2.1. Fingerprint Recognition
- 6.2.2. Iris Recognition
- 6.2.3. Palm Recognition
- 6.2.4. Facial Recognition
- 6.2.5. Voice Recognition
- 6.2.6. Other Scanner Types
- 6.3. Market Analysis, Insights and Forecast - by End-user Industry
- 6.3.1. Government
- 6.3.2. Retail
- 6.3.3. IT and Telecom
- 6.3.4. BFSI
- 6.3.5. Healthcare
- 6.3.6. Other End-user Industries
- 6.1. Market Analysis, Insights and Forecast - by Application
- 7. Europe Biometrics-as-a-Service Industry Analysis, Insights and Forecast, 2019-2031
- 7.1. Market Analysis, Insights and Forecast - by Application
- 7.1.1. Site Access Control
- 7.1.2. Time Recording
- 7.1.3. Mobile Application
- 7.1.4. Web and Workplace
- 7.2. Market Analysis, Insights and Forecast - by Scanner Type
- 7.2.1. Fingerprint Recognition
- 7.2.2. Iris Recognition
- 7.2.3. Palm Recognition
- 7.2.4. Facial Recognition
- 7.2.5. Voice Recognition
- 7.2.6. Other Scanner Types
- 7.3. Market Analysis, Insights and Forecast - by End-user Industry
- 7.3.1. Government
- 7.3.2. Retail
- 7.3.3. IT and Telecom
- 7.3.4. BFSI
- 7.3.5. Healthcare
- 7.3.6. Other End-user Industries
- 7.1. Market Analysis, Insights and Forecast - by Application
- 8. Asia Pacific Biometrics-as-a-Service Industry Analysis, Insights and Forecast, 2019-2031
- 8.1. Market Analysis, Insights and Forecast - by Application
- 8.1.1. Site Access Control
- 8.1.2. Time Recording
- 8.1.3. Mobile Application
- 8.1.4. Web and Workplace
- 8.2. Market Analysis, Insights and Forecast - by Scanner Type
- 8.2.1. Fingerprint Recognition
- 8.2.2. Iris Recognition
- 8.2.3. Palm Recognition
- 8.2.4. Facial Recognition
- 8.2.5. Voice Recognition
- 8.2.6. Other Scanner Types
- 8.3. Market Analysis, Insights and Forecast - by End-user Industry
- 8.3.1. Government
- 8.3.2. Retail
- 8.3.3. IT and Telecom
- 8.3.4. BFSI
- 8.3.5. Healthcare
- 8.3.6. Other End-user Industries
- 8.1. Market Analysis, Insights and Forecast - by Application
- 9. Latin America Biometrics-as-a-Service Industry Analysis, Insights and Forecast, 2019-2031
- 9.1. Market Analysis, Insights and Forecast - by Application
- 9.1.1. Site Access Control
- 9.1.2. Time Recording
- 9.1.3. Mobile Application
- 9.1.4. Web and Workplace
- 9.2. Market Analysis, Insights and Forecast - by Scanner Type
- 9.2.1. Fingerprint Recognition
- 9.2.2. Iris Recognition
- 9.2.3. Palm Recognition
- 9.2.4. Facial Recognition
- 9.2.5. Voice Recognition
- 9.2.6. Other Scanner Types
- 9.3. Market Analysis, Insights and Forecast - by End-user Industry
- 9.3.1. Government
- 9.3.2. Retail
- 9.3.3. IT and Telecom
- 9.3.4. BFSI
- 9.3.5. Healthcare
- 9.3.6. Other End-user Industries
- 9.1. Market Analysis, Insights and Forecast - by Application
- 10. Middle East and Africa Biometrics-as-a-Service Industry Analysis, Insights and Forecast, 2019-2031
- 10.1. Market Analysis, Insights and Forecast - by Application
- 10.1.1. Site Access Control
- 10.1.2. Time Recording
- 10.1.3. Mobile Application
- 10.1.4. Web and Workplace
- 10.2. Market Analysis, Insights and Forecast - by Scanner Type
- 10.2.1. Fingerprint Recognition
- 10.2.2. Iris Recognition
- 10.2.3. Palm Recognition
- 10.2.4. Facial Recognition
- 10.2.5. Voice Recognition
- 10.2.6. Other Scanner Types
- 10.3. Market Analysis, Insights and Forecast - by End-user Industry
- 10.3.1. Government
- 10.3.2. Retail
- 10.3.3. IT and Telecom
- 10.3.4. BFSI
- 10.3.5. Healthcare
- 10.3.6. Other End-user Industries
- 10.1. Market Analysis, Insights and Forecast - by Application
- 11. North America Biometrics-as-a-Service Industry Analysis, Insights and Forecast, 2019-2031
- 11.1. Market Analysis, Insights and Forecast - By Country/Sub-region
- 11.1.1.
- 12. Europe Biometrics-as-a-Service Industry Analysis, Insights and Forecast, 2019-2031
- 12.1. Market Analysis, Insights and Forecast - By Country/Sub-region
- 12.1.1.
- 13. Asia Pacific Biometrics-as-a-Service Industry Analysis, Insights and Forecast, 2019-2031
- 13.1. Market Analysis, Insights and Forecast - By Country/Sub-region
- 13.1.1.
- 14. Latin America Biometrics-as-a-Service Industry Analysis, Insights and Forecast, 2019-2031
- 14.1. Market Analysis, Insights and Forecast - By Country/Sub-region
- 14.1.1.
- 15. Middle East and Africa Biometrics-as-a-Service Industry Analysis, Insights and Forecast, 2019-2031
- 15.1. Market Analysis, Insights and Forecast - By Country/Sub-region
- 15.1.1.
- 16. Competitive Analysis
- 16.1. Global Market Share Analysis 2024
- 16.2. Company Profiles
- 16.2.1 IDEMIA France SAS
- 16.2.1.1. Overview
- 16.2.1.2. Products
- 16.2.1.3. SWOT Analysis
- 16.2.1.4. Recent Developments
- 16.2.1.5. Financials (Based on Availability)
- 16.2.2 Fujitsu Ltd
- 16.2.2.1. Overview
- 16.2.2.2. Products
- 16.2.2.3. SWOT Analysis
- 16.2.2.4. Recent Developments
- 16.2.2.5. Financials (Based on Availability)
- 16.2.3 Thales Group (Gemalto N V )
- 16.2.3.1. Overview
- 16.2.3.2. Products
- 16.2.3.3. SWOT Analysis
- 16.2.3.4. Recent Developments
- 16.2.3.5. Financials (Based on Availability)
- 16.2.4 Aware Inc
- 16.2.4.1. Overview
- 16.2.4.2. Products
- 16.2.4.3. SWOT Analysis
- 16.2.4.4. Recent Developments
- 16.2.4.5. Financials (Based on Availability)
- 16.2.5 Clearview AI Inc *List Not Exhaustive
- 16.2.5.1. Overview
- 16.2.5.2. Products
- 16.2.5.3. SWOT Analysis
- 16.2.5.4. Recent Developments
- 16.2.5.5. Financials (Based on Availability)
- 16.2.6 ImageWare Systems Inc
- 16.2.6.1. Overview
- 16.2.6.2. Products
- 16.2.6.3. SWOT Analysis
- 16.2.6.4. Recent Developments
- 16.2.6.5. Financials (Based on Availability)
- 16.2.7 NEC Corporation
- 16.2.7.1. Overview
- 16.2.7.2. Products
- 16.2.7.3. SWOT Analysis
- 16.2.7.4. Recent Developments
- 16.2.7.5. Financials (Based on Availability)
- 16.2.8 Leidos Holdings Inc
- 16.2.8.1. Overview
- 16.2.8.2. Products
- 16.2.8.3. SWOT Analysis
- 16.2.8.4. Recent Developments
- 16.2.8.5. Financials (Based on Availability)
- 16.2.9 Mobbeel Solutions S L L
- 16.2.9.1. Overview
- 16.2.9.2. Products
- 16.2.9.3. SWOT Analysis
- 16.2.9.4. Recent Developments
- 16.2.9.5. Financials (Based on Availability)
- 16.2.10 BioEngagable Technologies Pvt Ltd
- 16.2.10.1. Overview
- 16.2.10.2. Products
- 16.2.10.3. SWOT Analysis
- 16.2.10.4. Recent Developments
- 16.2.10.5. Financials (Based on Availability)
- 16.2.11 M2SYS Technology - KernellÓ Inc
- 16.2.11.1. Overview
- 16.2.11.2. Products
- 16.2.11.3. SWOT Analysis
- 16.2.11.4. Recent Developments
- 16.2.11.5. Financials (Based on Availability)
- 16.2.1 IDEMIA France SAS
List of Figures
- Figure 1: Global Biometrics-as-a-Service Industry Revenue Breakdown (Million, %) by Region 2024 & 2032
- Figure 2: North America Biometrics-as-a-Service Industry Revenue (Million), by Country 2024 & 2032
- Figure 3: North America Biometrics-as-a-Service Industry Revenue Share (%), by Country 2024 & 2032
- Figure 4: Europe Biometrics-as-a-Service Industry Revenue (Million), by Country 2024 & 2032
- Figure 5: Europe Biometrics-as-a-Service Industry Revenue Share (%), by Country 2024 & 2032
- Figure 6: Asia Pacific Biometrics-as-a-Service Industry Revenue (Million), by Country 2024 & 2032
- Figure 7: Asia Pacific Biometrics-as-a-Service Industry Revenue Share (%), by Country 2024 & 2032
- Figure 8: Latin America Biometrics-as-a-Service Industry Revenue (Million), by Country 2024 & 2032
- Figure 9: Latin America Biometrics-as-a-Service Industry Revenue Share (%), by Country 2024 & 2032
- Figure 10: Middle East and Africa Biometrics-as-a-Service Industry Revenue (Million), by Country 2024 & 2032
- Figure 11: Middle East and Africa Biometrics-as-a-Service Industry Revenue Share (%), by Country 2024 & 2032
- Figure 12: North America Biometrics-as-a-Service Industry Revenue (Million), by Application 2024 & 2032
- Figure 13: North America Biometrics-as-a-Service Industry Revenue Share (%), by Application 2024 & 2032
- Figure 14: North America Biometrics-as-a-Service Industry Revenue (Million), by Scanner Type 2024 & 2032
- Figure 15: North America Biometrics-as-a-Service Industry Revenue Share (%), by Scanner Type 2024 & 2032
- Figure 16: North America Biometrics-as-a-Service Industry Revenue (Million), by End-user Industry 2024 & 2032
- Figure 17: North America Biometrics-as-a-Service Industry Revenue Share (%), by End-user Industry 2024 & 2032
- Figure 18: North America Biometrics-as-a-Service Industry Revenue (Million), by Country 2024 & 2032
- Figure 19: North America Biometrics-as-a-Service Industry Revenue Share (%), by Country 2024 & 2032
- Figure 20: Europe Biometrics-as-a-Service Industry Revenue (Million), by Application 2024 & 2032
- Figure 21: Europe Biometrics-as-a-Service Industry Revenue Share (%), by Application 2024 & 2032
- Figure 22: Europe Biometrics-as-a-Service Industry Revenue (Million), by Scanner Type 2024 & 2032
- Figure 23: Europe Biometrics-as-a-Service Industry Revenue Share (%), by Scanner Type 2024 & 2032
- Figure 24: Europe Biometrics-as-a-Service Industry Revenue (Million), by End-user Industry 2024 & 2032
- Figure 25: Europe Biometrics-as-a-Service Industry Revenue Share (%), by End-user Industry 2024 & 2032
- Figure 26: Europe Biometrics-as-a-Service Industry Revenue (Million), by Country 2024 & 2032
- Figure 27: Europe Biometrics-as-a-Service Industry Revenue Share (%), by Country 2024 & 2032
- Figure 28: Asia Pacific Biometrics-as-a-Service Industry Revenue (Million), by Application 2024 & 2032
- Figure 29: Asia Pacific Biometrics-as-a-Service Industry Revenue Share (%), by Application 2024 & 2032
- Figure 30: Asia Pacific Biometrics-as-a-Service Industry Revenue (Million), by Scanner Type 2024 & 2032
- Figure 31: Asia Pacific Biometrics-as-a-Service Industry Revenue Share (%), by Scanner Type 2024 & 2032
- Figure 32: Asia Pacific Biometrics-as-a-Service Industry Revenue (Million), by End-user Industry 2024 & 2032
- Figure 33: Asia Pacific Biometrics-as-a-Service Industry Revenue Share (%), by End-user Industry 2024 & 2032
- Figure 34: Asia Pacific Biometrics-as-a-Service Industry Revenue (Million), by Country 2024 & 2032
- Figure 35: Asia Pacific Biometrics-as-a-Service Industry Revenue Share (%), by Country 2024 & 2032
- Figure 36: Latin America Biometrics-as-a-Service Industry Revenue (Million), by Application 2024 & 2032
- Figure 37: Latin America Biometrics-as-a-Service Industry Revenue Share (%), by Application 2024 & 2032
- Figure 38: Latin America Biometrics-as-a-Service Industry Revenue (Million), by Scanner Type 2024 & 2032
- Figure 39: Latin America Biometrics-as-a-Service Industry Revenue Share (%), by Scanner Type 2024 & 2032
- Figure 40: Latin America Biometrics-as-a-Service Industry Revenue (Million), by End-user Industry 2024 & 2032
- Figure 41: Latin America Biometrics-as-a-Service Industry Revenue Share (%), by End-user Industry 2024 & 2032
- Figure 42: Latin America Biometrics-as-a-Service Industry Revenue (Million), by Country 2024 & 2032
- Figure 43: Latin America Biometrics-as-a-Service Industry Revenue Share (%), by Country 2024 & 2032
- Figure 44: Middle East and Africa Biometrics-as-a-Service Industry Revenue (Million), by Application 2024 & 2032
- Figure 45: Middle East and Africa Biometrics-as-a-Service Industry Revenue Share (%), by Application 2024 & 2032
- Figure 46: Middle East and Africa Biometrics-as-a-Service Industry Revenue (Million), by Scanner Type 2024 & 2032
- Figure 47: Middle East and Africa Biometrics-as-a-Service Industry Revenue Share (%), by Scanner Type 2024 & 2032
- Figure 48: Middle East and Africa Biometrics-as-a-Service Industry Revenue (Million), by End-user Industry 2024 & 2032
- Figure 49: Middle East and Africa Biometrics-as-a-Service Industry Revenue Share (%), by End-user Industry 2024 & 2032
- Figure 50: Middle East and Africa Biometrics-as-a-Service Industry Revenue (Million), by Country 2024 & 2032
- Figure 51: Middle East and Africa Biometrics-as-a-Service Industry Revenue Share (%), by Country 2024 & 2032
List of Tables
- Table 1: Global Biometrics-as-a-Service Industry Revenue Million Forecast, by Region 2019 & 2032
- Table 2: Global Biometrics-as-a-Service Industry Revenue Million Forecast, by Application 2019 & 2032
- Table 3: Global Biometrics-as-a-Service Industry Revenue Million Forecast, by Scanner Type 2019 & 2032
- Table 4: Global Biometrics-as-a-Service Industry Revenue Million Forecast, by End-user Industry 2019 & 2032
- Table 5: Global Biometrics-as-a-Service Industry Revenue Million Forecast, by Region 2019 & 2032
- Table 6: Global Biometrics-as-a-Service Industry Revenue Million Forecast, by Country 2019 & 2032
- Table 7: Biometrics-as-a-Service Industry Revenue (Million) Forecast, by Application 2019 & 2032
- Table 8: Global Biometrics-as-a-Service Industry Revenue Million Forecast, by Country 2019 & 2032
- Table 9: Biometrics-as-a-Service Industry Revenue (Million) Forecast, by Application 2019 & 2032
- Table 10: Global Biometrics-as-a-Service Industry Revenue Million Forecast, by Country 2019 & 2032
- Table 11: Biometrics-as-a-Service Industry Revenue (Million) Forecast, by Application 2019 & 2032
- Table 12: Global Biometrics-as-a-Service Industry Revenue Million Forecast, by Country 2019 & 2032
- Table 13: Biometrics-as-a-Service Industry Revenue (Million) Forecast, by Application 2019 & 2032
- Table 14: Global Biometrics-as-a-Service Industry Revenue Million Forecast, by Country 2019 & 2032
- Table 15: Biometrics-as-a-Service Industry Revenue (Million) Forecast, by Application 2019 & 2032
- Table 16: Global Biometrics-as-a-Service Industry Revenue Million Forecast, by Application 2019 & 2032
- Table 17: Global Biometrics-as-a-Service Industry Revenue Million Forecast, by Scanner Type 2019 & 2032
- Table 18: Global Biometrics-as-a-Service Industry Revenue Million Forecast, by End-user Industry 2019 & 2032
- Table 19: Global Biometrics-as-a-Service Industry Revenue Million Forecast, by Country 2019 & 2032
- Table 20: Global Biometrics-as-a-Service Industry Revenue Million Forecast, by Application 2019 & 2032
- Table 21: Global Biometrics-as-a-Service Industry Revenue Million Forecast, by Scanner Type 2019 & 2032
- Table 22: Global Biometrics-as-a-Service Industry Revenue Million Forecast, by End-user Industry 2019 & 2032
- Table 23: Global Biometrics-as-a-Service Industry Revenue Million Forecast, by Country 2019 & 2032
- Table 24: Global Biometrics-as-a-Service Industry Revenue Million Forecast, by Application 2019 & 2032
- Table 25: Global Biometrics-as-a-Service Industry Revenue Million Forecast, by Scanner Type 2019 & 2032
- Table 26: Global Biometrics-as-a-Service Industry Revenue Million Forecast, by End-user Industry 2019 & 2032
- Table 27: Global Biometrics-as-a-Service Industry Revenue Million Forecast, by Country 2019 & 2032
- Table 28: Global Biometrics-as-a-Service Industry Revenue Million Forecast, by Application 2019 & 2032
- Table 29: Global Biometrics-as-a-Service Industry Revenue Million Forecast, by Scanner Type 2019 & 2032
- Table 30: Global Biometrics-as-a-Service Industry Revenue Million Forecast, by End-user Industry 2019 & 2032
- Table 31: Global Biometrics-as-a-Service Industry Revenue Million Forecast, by Country 2019 & 2032
- Table 32: Global Biometrics-as-a-Service Industry Revenue Million Forecast, by Application 2019 & 2032
- Table 33: Global Biometrics-as-a-Service Industry Revenue Million Forecast, by Scanner Type 2019 & 2032
- Table 34: Global Biometrics-as-a-Service Industry Revenue Million Forecast, by End-user Industry 2019 & 2032
- Table 35: Global Biometrics-as-a-Service Industry Revenue Million Forecast, by Country 2019 & 2032
Frequently Asked Questions
1. What is the projected Compound Annual Growth Rate (CAGR) of the Biometrics-as-a-Service Industry?
The projected CAGR is approximately 22.76%.
2. Which companies are prominent players in the Biometrics-as-a-Service Industry?
Key companies in the market include IDEMIA France SAS, Fujitsu Ltd, Thales Group (Gemalto N V ), Aware Inc, Clearview AI Inc *List Not Exhaustive, ImageWare Systems Inc, NEC Corporation, Leidos Holdings Inc, Mobbeel Solutions S L L, BioEngagable Technologies Pvt Ltd, M2SYS Technology - KernellÓ Inc.
3. What are the main segments of the Biometrics-as-a-Service Industry?
The market segments include Application, Scanner Type, End-user Industry.
4. Can you provide details about the market size?
The market size is estimated to be USD XX Million as of 2022.
5. What are some drivers contributing to market growth?
; Need to Secure Increasing Online Transaction; Increased Sophistication of Security Threat; Governments Adopting Technology to Secure Citizens.
6. What are the notable trends driving market growth?
Retail is Expected to Hold Significant Share.
7. Are there any restraints impacting market growth?
Regulatory and Policy Constraints; Technical Complexity and Expertise.
8. Can you provide examples of recent developments in the market?
N/A
9. What pricing options are available for accessing the report?
Pricing options include single-user, multi-user, and enterprise licenses priced at USD 4750, USD 5250, and USD 8750 respectively.
10. Is the market size provided in terms of value or volume?
The market size is provided in terms of value, measured in Million.
11. Are there any specific market keywords associated with the report?
Yes, the market keyword associated with the report is "Biometrics-as-a-Service Industry," which aids in identifying and referencing the specific market segment covered.
12. How do I determine which pricing option suits my needs best?
The pricing options vary based on user requirements and access needs. Individual users may opt for single-user licenses, while businesses requiring broader access may choose multi-user or enterprise licenses for cost-effective access to the report.
13. Are there any additional resources or data provided in the Biometrics-as-a-Service Industry report?
While the report offers comprehensive insights, it's advisable to review the specific contents or supplementary materials provided to ascertain if additional resources or data are available.
14. How can I stay updated on further developments or reports in the Biometrics-as-a-Service Industry?
To stay informed about further developments, trends, and reports in the Biometrics-as-a-Service Industry, consider subscribing to industry newsletters, following relevant companies and organizations, or regularly checking reputable industry news sources and publications.
Methodology
Step 1 - Identification of Relevant Samples Size from Population Database


Step 2 - Approaches for Defining Global Market Size (Value, Volume* & Price*)

Note*: In applicable scenarios
Step 3 - Data Sources
Primary Research
- Web Analytics
- Survey Reports
- Research Institute
- Latest Research Reports
- Opinion Leaders
Secondary Research
- Annual Reports
- White Paper
- Latest Press Release
- Industry Association
- Paid Database
- Investor Presentations

Step 4 - Data Triangulation
Involves using different sources of information in order to increase the validity of a study
These sources are likely to be stakeholders in a program - participants, other researchers, program staff, other community members, and so on.
Then we put all data in single framework & apply various statistical tools to find out the dynamic on the market.
During the analysis stage, feedback from the stakeholder groups would be compared to determine areas of agreement as well as areas of divergence


