
Key Insights
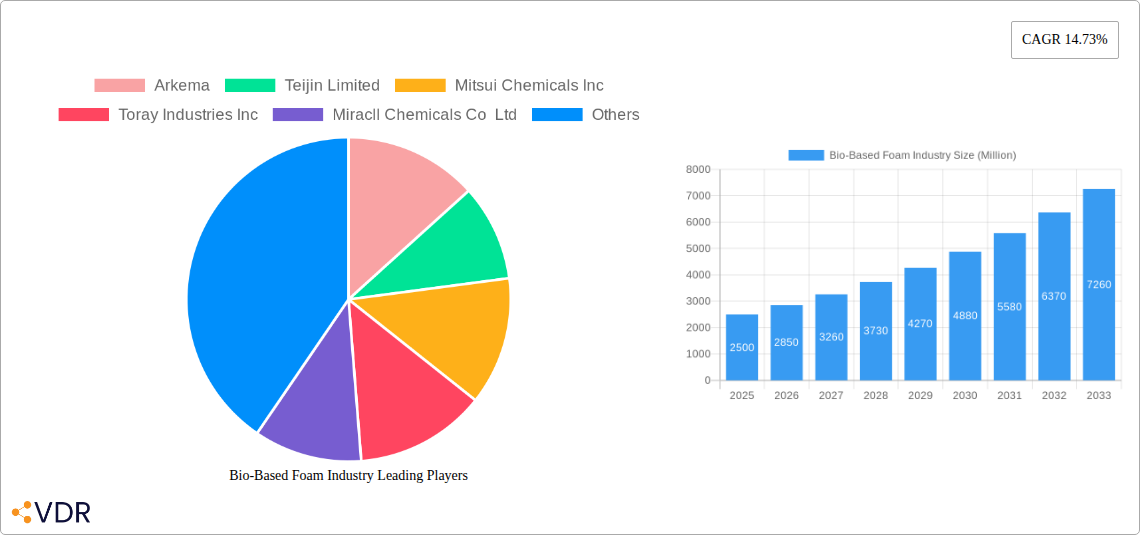
The bio-based foam market is experiencing robust growth, driven by increasing environmental concerns and stringent regulations surrounding the use of petroleum-based alternatives. A Compound Annual Growth Rate (CAGR) of 14.73% from 2019 to 2024 indicates significant market expansion. This growth is fueled by rising demand across diverse end-use industries, notably transportation (automotive seating and insulation), footwear and textiles (cushioning and comfort enhancement), and construction (insulation and packaging). The preference for sustainable and biodegradable materials is a key driver, alongside the inherent advantages of bio-based foams, such as improved thermal insulation and lightweight properties. The market segmentation reflects this diverse application, with foams, coatings, adhesives and sealants, and polyurethane binders/dispersions representing major application areas. Key players like Arkema, BASF, and Huntsman are actively investing in research and development, expanding their product portfolios, and exploring innovative applications to capitalize on this burgeoning market. Geographical expansion is also a significant factor, with regions like Asia-Pacific exhibiting strong growth potential due to rapid industrialization and increasing disposable incomes.
While the market exhibits significant potential, challenges remain. The relatively higher cost of bio-based foams compared to their petroleum-based counterparts remains a barrier to widespread adoption. Furthermore, inconsistencies in the supply chain of raw bio-based materials and the need for technological advancements to improve performance and durability of bio-based foams need to be addressed. Despite these challenges, the long-term outlook for the bio-based foam market remains positive, fueled by sustained demand for environmentally friendly materials and ongoing innovation within the industry. The market is expected to continue its trajectory of significant expansion through 2033. Market size estimations for the future can be derived from the available CAGR and extrapolated, accounting for potential saturation and market dynamics.
Bio-Based Foam Industry Market Report: 2019-2033
This comprehensive report provides a detailed analysis of the Bio-Based Foam industry, offering invaluable insights for industry professionals, investors, and strategists. Covering the period from 2019 to 2033, with a base year of 2025, this report delves into market dynamics, growth trends, key players, and future opportunities within the parent market of bio-based materials and its child market of bio-based foams. The report projects a market value reaching xx million units by 2033.
Bio-Based Foam Industry Market Dynamics & Structure
The Bio-Based Foam industry is characterized by a moderately concentrated market structure, with key players like Arkema, BASF SE, and Covestro AG holding significant market share. Technological innovation, driven by the need for sustainable alternatives to petroleum-based foams, is a crucial driver. Stringent environmental regulations and growing consumer awareness of sustainability are shaping industry practices. Bio-based foams face competition from traditional petroleum-based alternatives, but their superior environmental profile offers a compelling advantage. End-user demographics are shifting towards environmentally conscious consumers, fueling demand for bio-based products. The industry has witnessed a moderate level of M&A activity in recent years, with strategic partnerships aiming to enhance product development and market reach.
- Market Concentration: Moderately concentrated, with top 5 players holding approximately xx% market share (2024).
- Technological Innovation: Focus on improving bio-based foam properties (e.g., durability, cost-effectiveness).
- Regulatory Framework: Increasingly stringent environmental regulations favoring bio-based materials.
- Competitive Substitutes: Traditional petroleum-based foams remain a major competitor.
- M&A Trends: Moderate activity, primarily focused on strategic partnerships and technology acquisitions. xx M&A deals in the last 5 years.
- Innovation Barriers: High R&D costs and challenges in scaling up production.
Bio-Based Foam Industry Growth Trends & Insights
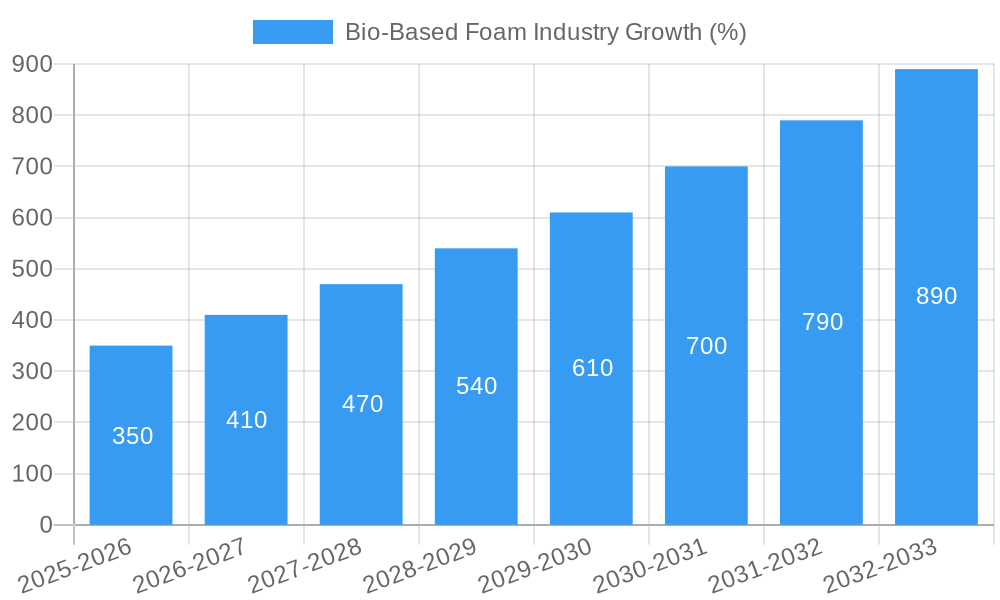
The Bio-Based Foam market has experienced steady growth in the historical period (2019-2024), driven by the increasing demand for eco-friendly materials across various end-use sectors. The market size is estimated at xx million units in 2025, exhibiting a CAGR of xx% during the forecast period (2025-2033). Technological advancements, including the development of high-performance bio-based polymers, are accelerating adoption rates. Consumer preferences are shifting towards sustainable products, boosting market penetration. Disruptive innovations, such as the use of bio-based additives and novel manufacturing techniques, are reshaping the industry landscape. The growing awareness regarding the environmental impact of traditional foams has significantly driven market growth. Further, increased government support and incentives for sustainable solutions have supported the adoption of bio-based foams.
Dominant Regions, Countries, or Segments in Bio-Based Foam Industry
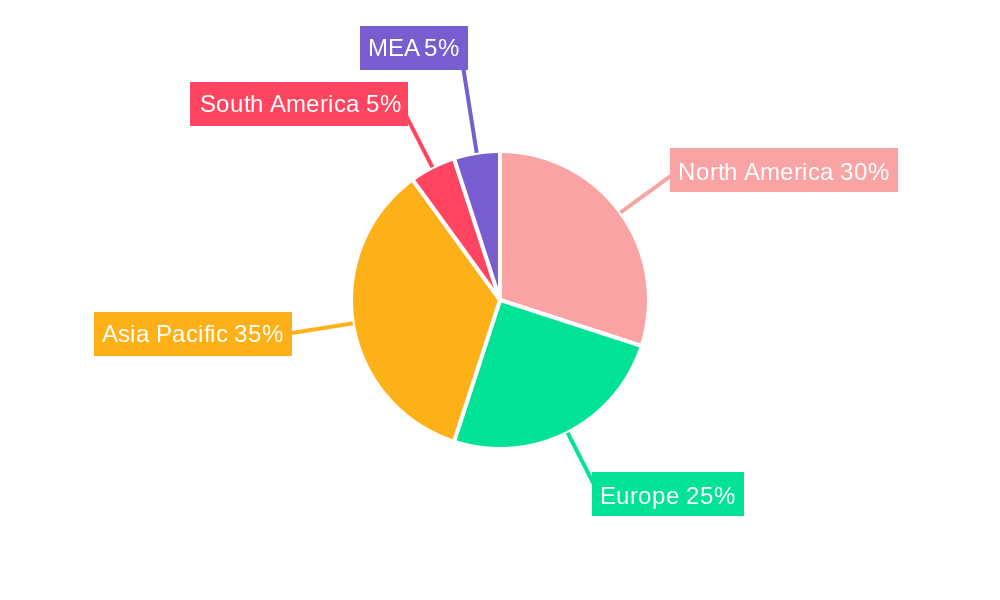
North America and Europe currently dominate the Bio-Based Foam market, driven by stringent environmental regulations and strong consumer demand for sustainable products. Within applications, the foams segment holds the largest market share, followed by coatings, adhesives, and sealants. The transportation, construction, and packaging end-user industries are key growth drivers. Asia-Pacific is projected to exhibit the fastest growth rate due to increasing industrialization and rising disposable incomes.
- Key Drivers: Stringent environmental regulations in North America and Europe, increasing consumer awareness of sustainability in all regions, government incentives for bio-based materials, robust infrastructure in developed economies.
- Dominant Segments: Foams (xx million units in 2025), Transportation (xx million units in 2025), and Construction (xx million units in 2025) leading the market.
- Growth Potential: Asia-Pacific projected for the highest growth due to rising industrialization and increasing demand for sustainable solutions.
Bio-Based Foam Industry Product Landscape
Bio-based foams are witnessing continuous innovation, with a focus on enhancing performance characteristics like durability, flexibility, and thermal insulation. New formulations are emerging, leveraging various bio-based polymers and additives to achieve desired properties. These innovations cater to diverse applications across various end-user industries, offering unique selling propositions in terms of sustainability and performance. Technological advancements include the development of novel bio-based polyurethane systems and improved processing techniques.
Key Drivers, Barriers & Challenges in Bio-Based Foam Industry
Key Drivers: Growing environmental concerns, stringent regulations favoring bio-based materials, increasing demand for sustainable packaging and construction materials, advancements in bio-based polymer technology.
Challenges: High production costs compared to petroleum-based alternatives, limited availability of raw materials, challenges in achieving consistent product quality, supply chain complexities. The current market faces a xx% price premium compared to traditional foams (2025).
Emerging Opportunities in Bio-Based Foam Industry
Untapped markets in developing economies, demand for bio-based foams in niche applications (e.g., biomedical, agricultural), growing interest in recycled and compostable bio-based foams represent significant opportunities. The emergence of new bio-based polymers with superior properties opens new avenues for product innovation. Evolving consumer preferences toward sustainable and ethically sourced products further drive market expansion.
Growth Accelerators in the Bio-Based Foam Industry
Technological breakthroughs in bio-based polymer synthesis and processing are pivotal in reducing production costs and enhancing product performance. Strategic partnerships between bio-based material suppliers and end-users are accelerating market adoption. Market expansion strategies targeting niche applications and developing economies are fueling long-term growth.
Key Players Shaping the Bio-Based Foam Industry Market
- Arkema
- Teijin Limited
- Mitsui Chemicals Inc
- Toray Industries Inc
- Miracll Chemicals Co Ltd
- BASF SE
- Huntsman International LLC
- Woodbridge
- Stahl Holdings BV
- The Lubrizol Corporation
- Covestro AG
Notable Milestones in Bio-Based Foam Industry Sector
- October 2022: Carbon's EPU 44 wins the 2022 Polyurethane Innovation Award, highlighting advancements in bio-based polyurethane technology.
- November 2022: Covestro AG and Coleitec sign a strategic partnership to accelerate the application development of polyurethane composite materials, signifying collaborative efforts in market expansion.
In-Depth Bio-Based Foam Industry Market Outlook
The Bio-Based Foam industry is poised for significant growth, driven by technological advancements, increasing environmental awareness, and supportive government policies. Strategic investments in R&D, focus on sustainable supply chains, and expansion into new markets present lucrative opportunities for industry players. The market's future growth hinges on overcoming challenges related to cost competitiveness and achieving consistent product quality while maintaining sustainability.
Bio-Based Foam Industry Segmentation
-
1. Application
- 1.1. Foams
- 1.2. Coatings
- 1.3. Adhesive and Sealants
- 1.4. Other Ap
-
2. End-user Industry
- 2.1. Transportation
- 2.2. Footwear and Textile
- 2.3. Construction
- 2.4. Packaging
- 2.5. Furniture and Bedding
- 2.6. Electronics
- 2.7. Other En
Bio-Based Foam Industry Segmentation By Geography
-
1. Asia Pacific
- 1.1. China
- 1.2. India
- 1.3. Japan
- 1.4. South Korea
- 1.5. Rest of Asia Pacific
-
2. North America
- 2.1. United States
- 2.2. Canada
- 2.3. Mexico
-
3. Europe
- 3.1. Germany
- 3.2. United Kingdom
- 3.3. Italy
- 3.4. France
- 3.5. Spain
- 3.6. Rest of Europe
-
4. Rest of the World
- 4.1. Brazil
- 4.2. Saudi Arabia
- 4.3. South Africa
- 4.4. Rest of the Countries
Bio-Based Foam Industry REPORT HIGHLIGHTS
| Aspects | Details |
|---|---|
| Study Period | 2019-2033 |
| Base Year | 2024 |
| Estimated Year | 2025 |
| Forecast Period | 2025-2033 |
| Historical Period | 2019-2024 |
| Growth Rate | CAGR of 14.73% from 2019-2033 |
| Segmentation |
|
Table of Contents
- 1. Introduction
- 1.1. Research Scope
- 1.2. Market Segmentation
- 1.3. Research Methodology
- 1.4. Definitions and Assumptions
- 2. Executive Summary
- 2.1. Introduction
- 3. Market Dynamics
- 3.1. Introduction
- 3.2. Market Drivers
- 3.2.1. Increasing Demand from the Construction Industry in Developing Countries; Growing Demand from Electronic Appliance Manufacturing.; Other Drivers
- 3.3. Market Restrains
- 3.3.1. High Cost of Bio-based Materials; Other Restraints
- 3.4. Market Trends
- 3.4.1. Increasing Demand from the Transportation Industry
- 4. Market Factor Analysis
- 4.1. Porters Five Forces
- 4.2. Supply/Value Chain
- 4.3. PESTEL analysis
- 4.4. Market Entropy
- 4.5. Patent/Trademark Analysis
- 5. Global Bio-Based Foam Industry Analysis, Insights and Forecast, 2019-2031
- 5.1. Market Analysis, Insights and Forecast - by Application
- 5.1.1. Foams
- 5.1.2. Coatings
- 5.1.3. Adhesive and Sealants
- 5.1.4. Other Ap
- 5.2. Market Analysis, Insights and Forecast - by End-user Industry
- 5.2.1. Transportation
- 5.2.2. Footwear and Textile
- 5.2.3. Construction
- 5.2.4. Packaging
- 5.2.5. Furniture and Bedding
- 5.2.6. Electronics
- 5.2.7. Other En
- 5.3. Market Analysis, Insights and Forecast - by Region
- 5.3.1. Asia Pacific
- 5.3.2. North America
- 5.3.3. Europe
- 5.3.4. Rest of the World
- 5.1. Market Analysis, Insights and Forecast - by Application
- 6. Asia Pacific Bio-Based Foam Industry Analysis, Insights and Forecast, 2019-2031
- 6.1. Market Analysis, Insights and Forecast - by Application
- 6.1.1. Foams
- 6.1.2. Coatings
- 6.1.3. Adhesive and Sealants
- 6.1.4. Other Ap
- 6.2. Market Analysis, Insights and Forecast - by End-user Industry
- 6.2.1. Transportation
- 6.2.2. Footwear and Textile
- 6.2.3. Construction
- 6.2.4. Packaging
- 6.2.5. Furniture and Bedding
- 6.2.6. Electronics
- 6.2.7. Other En
- 6.1. Market Analysis, Insights and Forecast - by Application
- 7. North America Bio-Based Foam Industry Analysis, Insights and Forecast, 2019-2031
- 7.1. Market Analysis, Insights and Forecast - by Application
- 7.1.1. Foams
- 7.1.2. Coatings
- 7.1.3. Adhesive and Sealants
- 7.1.4. Other Ap
- 7.2. Market Analysis, Insights and Forecast - by End-user Industry
- 7.2.1. Transportation
- 7.2.2. Footwear and Textile
- 7.2.3. Construction
- 7.2.4. Packaging
- 7.2.5. Furniture and Bedding
- 7.2.6. Electronics
- 7.2.7. Other En
- 7.1. Market Analysis, Insights and Forecast - by Application
- 8. Europe Bio-Based Foam Industry Analysis, Insights and Forecast, 2019-2031
- 8.1. Market Analysis, Insights and Forecast - by Application
- 8.1.1. Foams
- 8.1.2. Coatings
- 8.1.3. Adhesive and Sealants
- 8.1.4. Other Ap
- 8.2. Market Analysis, Insights and Forecast - by End-user Industry
- 8.2.1. Transportation
- 8.2.2. Footwear and Textile
- 8.2.3. Construction
- 8.2.4. Packaging
- 8.2.5. Furniture and Bedding
- 8.2.6. Electronics
- 8.2.7. Other En
- 8.1. Market Analysis, Insights and Forecast - by Application
- 9. Rest of the World Bio-Based Foam Industry Analysis, Insights and Forecast, 2019-2031
- 9.1. Market Analysis, Insights and Forecast - by Application
- 9.1.1. Foams
- 9.1.2. Coatings
- 9.1.3. Adhesive and Sealants
- 9.1.4. Other Ap
- 9.2. Market Analysis, Insights and Forecast - by End-user Industry
- 9.2.1. Transportation
- 9.2.2. Footwear and Textile
- 9.2.3. Construction
- 9.2.4. Packaging
- 9.2.5. Furniture and Bedding
- 9.2.6. Electronics
- 9.2.7. Other En
- 9.1. Market Analysis, Insights and Forecast - by Application
- 10. North America Bio-Based Foam Industry Analysis, Insights and Forecast, 2019-2031
- 10.1. Market Analysis, Insights and Forecast - By Country/Sub-region
- 10.1.1 United States
- 10.1.2 Canada
- 10.1.3 Mexico
- 11. Europe Bio-Based Foam Industry Analysis, Insights and Forecast, 2019-2031
- 11.1. Market Analysis, Insights and Forecast - By Country/Sub-region
- 11.1.1 Germany
- 11.1.2 France
- 11.1.3 Italy
- 11.1.4 United Kingdom
- 11.1.5 Netherlands
- 11.1.6 Rest of Europe
- 12. Asia Pacific Bio-Based Foam Industry Analysis, Insights and Forecast, 2019-2031
- 12.1. Market Analysis, Insights and Forecast - By Country/Sub-region
- 12.1.1 China
- 12.1.2 Japan
- 12.1.3 India
- 12.1.4 South Korea
- 12.1.5 Taiwan
- 12.1.6 Australia
- 12.1.7 Rest of Asia-Pacific
- 13. South America Bio-Based Foam Industry Analysis, Insights and Forecast, 2019-2031
- 13.1. Market Analysis, Insights and Forecast - By Country/Sub-region
- 13.1.1 Brazil
- 13.1.2 Argentina
- 13.1.3 Rest of South America
- 14. MEA Bio-Based Foam Industry Analysis, Insights and Forecast, 2019-2031
- 14.1. Market Analysis, Insights and Forecast - By Country/Sub-region
- 14.1.1 Middle East
- 14.1.2 Africa
- 15. Competitive Analysis
- 15.1. Global Market Share Analysis 2024
- 15.2. Company Profiles
- 15.2.1 Arkema
- 15.2.1.1. Overview
- 15.2.1.2. Products
- 15.2.1.3. SWOT Analysis
- 15.2.1.4. Recent Developments
- 15.2.1.5. Financials (Based on Availability)
- 15.2.2 Teijin Limited
- 15.2.2.1. Overview
- 15.2.2.2. Products
- 15.2.2.3. SWOT Analysis
- 15.2.2.4. Recent Developments
- 15.2.2.5. Financials (Based on Availability)
- 15.2.3 Mitsui Chemicals Inc
- 15.2.3.1. Overview
- 15.2.3.2. Products
- 15.2.3.3. SWOT Analysis
- 15.2.3.4. Recent Developments
- 15.2.3.5. Financials (Based on Availability)
- 15.2.4 Toray Industries Inc
- 15.2.4.1. Overview
- 15.2.4.2. Products
- 15.2.4.3. SWOT Analysis
- 15.2.4.4. Recent Developments
- 15.2.4.5. Financials (Based on Availability)
- 15.2.5 Miracll Chemicals Co Ltd
- 15.2.5.1. Overview
- 15.2.5.2. Products
- 15.2.5.3. SWOT Analysis
- 15.2.5.4. Recent Developments
- 15.2.5.5. Financials (Based on Availability)
- 15.2.6 BASF SE
- 15.2.6.1. Overview
- 15.2.6.2. Products
- 15.2.6.3. SWOT Analysis
- 15.2.6.4. Recent Developments
- 15.2.6.5. Financials (Based on Availability)
- 15.2.7 Huntsman International LLC
- 15.2.7.1. Overview
- 15.2.7.2. Products
- 15.2.7.3. SWOT Analysis
- 15.2.7.4. Recent Developments
- 15.2.7.5. Financials (Based on Availability)
- 15.2.8 Woodbridge
- 15.2.8.1. Overview
- 15.2.8.2. Products
- 15.2.8.3. SWOT Analysis
- 15.2.8.4. Recent Developments
- 15.2.8.5. Financials (Based on Availability)
- 15.2.9 Stahl Holdings BV
- 15.2.9.1. Overview
- 15.2.9.2. Products
- 15.2.9.3. SWOT Analysis
- 15.2.9.4. Recent Developments
- 15.2.9.5. Financials (Based on Availability)
- 15.2.10 The Lubrizol Corporation
- 15.2.10.1. Overview
- 15.2.10.2. Products
- 15.2.10.3. SWOT Analysis
- 15.2.10.4. Recent Developments
- 15.2.10.5. Financials (Based on Availability)
- 15.2.11 Covestro AG
- 15.2.11.1. Overview
- 15.2.11.2. Products
- 15.2.11.3. SWOT Analysis
- 15.2.11.4. Recent Developments
- 15.2.11.5. Financials (Based on Availability)
- 15.2.1 Arkema
List of Figures
- Figure 1: Global Bio-Based Foam Industry Revenue Breakdown (Million, %) by Region 2024 & 2032
- Figure 2: Global Bio-Based Foam Industry Volume Breakdown (kilotons, %) by Region 2024 & 2032
- Figure 3: North America Bio-Based Foam Industry Revenue (Million), by Country 2024 & 2032
- Figure 4: North America Bio-Based Foam Industry Volume (kilotons), by Country 2024 & 2032
- Figure 5: North America Bio-Based Foam Industry Revenue Share (%), by Country 2024 & 2032
- Figure 6: North America Bio-Based Foam Industry Volume Share (%), by Country 2024 & 2032
- Figure 7: Europe Bio-Based Foam Industry Revenue (Million), by Country 2024 & 2032
- Figure 8: Europe Bio-Based Foam Industry Volume (kilotons), by Country 2024 & 2032
- Figure 9: Europe Bio-Based Foam Industry Revenue Share (%), by Country 2024 & 2032
- Figure 10: Europe Bio-Based Foam Industry Volume Share (%), by Country 2024 & 2032
- Figure 11: Asia Pacific Bio-Based Foam Industry Revenue (Million), by Country 2024 & 2032
- Figure 12: Asia Pacific Bio-Based Foam Industry Volume (kilotons), by Country 2024 & 2032
- Figure 13: Asia Pacific Bio-Based Foam Industry Revenue Share (%), by Country 2024 & 2032
- Figure 14: Asia Pacific Bio-Based Foam Industry Volume Share (%), by Country 2024 & 2032
- Figure 15: South America Bio-Based Foam Industry Revenue (Million), by Country 2024 & 2032
- Figure 16: South America Bio-Based Foam Industry Volume (kilotons), by Country 2024 & 2032
- Figure 17: South America Bio-Based Foam Industry Revenue Share (%), by Country 2024 & 2032
- Figure 18: South America Bio-Based Foam Industry Volume Share (%), by Country 2024 & 2032
- Figure 19: MEA Bio-Based Foam Industry Revenue (Million), by Country 2024 & 2032
- Figure 20: MEA Bio-Based Foam Industry Volume (kilotons), by Country 2024 & 2032
- Figure 21: MEA Bio-Based Foam Industry Revenue Share (%), by Country 2024 & 2032
- Figure 22: MEA Bio-Based Foam Industry Volume Share (%), by Country 2024 & 2032
- Figure 23: Asia Pacific Bio-Based Foam Industry Revenue (Million), by Application 2024 & 2032
- Figure 24: Asia Pacific Bio-Based Foam Industry Volume (kilotons), by Application 2024 & 2032
- Figure 25: Asia Pacific Bio-Based Foam Industry Revenue Share (%), by Application 2024 & 2032
- Figure 26: Asia Pacific Bio-Based Foam Industry Volume Share (%), by Application 2024 & 2032
- Figure 27: Asia Pacific Bio-Based Foam Industry Revenue (Million), by End-user Industry 2024 & 2032
- Figure 28: Asia Pacific Bio-Based Foam Industry Volume (kilotons), by End-user Industry 2024 & 2032
- Figure 29: Asia Pacific Bio-Based Foam Industry Revenue Share (%), by End-user Industry 2024 & 2032
- Figure 30: Asia Pacific Bio-Based Foam Industry Volume Share (%), by End-user Industry 2024 & 2032
- Figure 31: Asia Pacific Bio-Based Foam Industry Revenue (Million), by Country 2024 & 2032
- Figure 32: Asia Pacific Bio-Based Foam Industry Volume (kilotons), by Country 2024 & 2032
- Figure 33: Asia Pacific Bio-Based Foam Industry Revenue Share (%), by Country 2024 & 2032
- Figure 34: Asia Pacific Bio-Based Foam Industry Volume Share (%), by Country 2024 & 2032
- Figure 35: North America Bio-Based Foam Industry Revenue (Million), by Application 2024 & 2032
- Figure 36: North America Bio-Based Foam Industry Volume (kilotons), by Application 2024 & 2032
- Figure 37: North America Bio-Based Foam Industry Revenue Share (%), by Application 2024 & 2032
- Figure 38: North America Bio-Based Foam Industry Volume Share (%), by Application 2024 & 2032
- Figure 39: North America Bio-Based Foam Industry Revenue (Million), by End-user Industry 2024 & 2032
- Figure 40: North America Bio-Based Foam Industry Volume (kilotons), by End-user Industry 2024 & 2032
- Figure 41: North America Bio-Based Foam Industry Revenue Share (%), by End-user Industry 2024 & 2032
- Figure 42: North America Bio-Based Foam Industry Volume Share (%), by End-user Industry 2024 & 2032
- Figure 43: North America Bio-Based Foam Industry Revenue (Million), by Country 2024 & 2032
- Figure 44: North America Bio-Based Foam Industry Volume (kilotons), by Country 2024 & 2032
- Figure 45: North America Bio-Based Foam Industry Revenue Share (%), by Country 2024 & 2032
- Figure 46: North America Bio-Based Foam Industry Volume Share (%), by Country 2024 & 2032
- Figure 47: Europe Bio-Based Foam Industry Revenue (Million), by Application 2024 & 2032
- Figure 48: Europe Bio-Based Foam Industry Volume (kilotons), by Application 2024 & 2032
- Figure 49: Europe Bio-Based Foam Industry Revenue Share (%), by Application 2024 & 2032
- Figure 50: Europe Bio-Based Foam Industry Volume Share (%), by Application 2024 & 2032
- Figure 51: Europe Bio-Based Foam Industry Revenue (Million), by End-user Industry 2024 & 2032
- Figure 52: Europe Bio-Based Foam Industry Volume (kilotons), by End-user Industry 2024 & 2032
- Figure 53: Europe Bio-Based Foam Industry Revenue Share (%), by End-user Industry 2024 & 2032
- Figure 54: Europe Bio-Based Foam Industry Volume Share (%), by End-user Industry 2024 & 2032
- Figure 55: Europe Bio-Based Foam Industry Revenue (Million), by Country 2024 & 2032
- Figure 56: Europe Bio-Based Foam Industry Volume (kilotons), by Country 2024 & 2032
- Figure 57: Europe Bio-Based Foam Industry Revenue Share (%), by Country 2024 & 2032
- Figure 58: Europe Bio-Based Foam Industry Volume Share (%), by Country 2024 & 2032
- Figure 59: Rest of the World Bio-Based Foam Industry Revenue (Million), by Application 2024 & 2032
- Figure 60: Rest of the World Bio-Based Foam Industry Volume (kilotons), by Application 2024 & 2032
- Figure 61: Rest of the World Bio-Based Foam Industry Revenue Share (%), by Application 2024 & 2032
- Figure 62: Rest of the World Bio-Based Foam Industry Volume Share (%), by Application 2024 & 2032
- Figure 63: Rest of the World Bio-Based Foam Industry Revenue (Million), by End-user Industry 2024 & 2032
- Figure 64: Rest of the World Bio-Based Foam Industry Volume (kilotons), by End-user Industry 2024 & 2032
- Figure 65: Rest of the World Bio-Based Foam Industry Revenue Share (%), by End-user Industry 2024 & 2032
- Figure 66: Rest of the World Bio-Based Foam Industry Volume Share (%), by End-user Industry 2024 & 2032
- Figure 67: Rest of the World Bio-Based Foam Industry Revenue (Million), by Country 2024 & 2032
- Figure 68: Rest of the World Bio-Based Foam Industry Volume (kilotons), by Country 2024 & 2032
- Figure 69: Rest of the World Bio-Based Foam Industry Revenue Share (%), by Country 2024 & 2032
- Figure 70: Rest of the World Bio-Based Foam Industry Volume Share (%), by Country 2024 & 2032
List of Tables
- Table 1: Global Bio-Based Foam Industry Revenue Million Forecast, by Region 2019 & 2032
- Table 2: Global Bio-Based Foam Industry Volume kilotons Forecast, by Region 2019 & 2032
- Table 3: Global Bio-Based Foam Industry Revenue Million Forecast, by Application 2019 & 2032
- Table 4: Global Bio-Based Foam Industry Volume kilotons Forecast, by Application 2019 & 2032
- Table 5: Global Bio-Based Foam Industry Revenue Million Forecast, by End-user Industry 2019 & 2032
- Table 6: Global Bio-Based Foam Industry Volume kilotons Forecast, by End-user Industry 2019 & 2032
- Table 7: Global Bio-Based Foam Industry Revenue Million Forecast, by Region 2019 & 2032
- Table 8: Global Bio-Based Foam Industry Volume kilotons Forecast, by Region 2019 & 2032
- Table 9: Global Bio-Based Foam Industry Revenue Million Forecast, by Country 2019 & 2032
- Table 10: Global Bio-Based Foam Industry Volume kilotons Forecast, by Country 2019 & 2032
- Table 11: United States Bio-Based Foam Industry Revenue (Million) Forecast, by Application 2019 & 2032
- Table 12: United States Bio-Based Foam Industry Volume (kilotons) Forecast, by Application 2019 & 2032
- Table 13: Canada Bio-Based Foam Industry Revenue (Million) Forecast, by Application 2019 & 2032
- Table 14: Canada Bio-Based Foam Industry Volume (kilotons) Forecast, by Application 2019 & 2032
- Table 15: Mexico Bio-Based Foam Industry Revenue (Million) Forecast, by Application 2019 & 2032
- Table 16: Mexico Bio-Based Foam Industry Volume (kilotons) Forecast, by Application 2019 & 2032
- Table 17: Global Bio-Based Foam Industry Revenue Million Forecast, by Country 2019 & 2032
- Table 18: Global Bio-Based Foam Industry Volume kilotons Forecast, by Country 2019 & 2032
- Table 19: Germany Bio-Based Foam Industry Revenue (Million) Forecast, by Application 2019 & 2032
- Table 20: Germany Bio-Based Foam Industry Volume (kilotons) Forecast, by Application 2019 & 2032
- Table 21: France Bio-Based Foam Industry Revenue (Million) Forecast, by Application 2019 & 2032
- Table 22: France Bio-Based Foam Industry Volume (kilotons) Forecast, by Application 2019 & 2032
- Table 23: Italy Bio-Based Foam Industry Revenue (Million) Forecast, by Application 2019 & 2032
- Table 24: Italy Bio-Based Foam Industry Volume (kilotons) Forecast, by Application 2019 & 2032
- Table 25: United Kingdom Bio-Based Foam Industry Revenue (Million) Forecast, by Application 2019 & 2032
- Table 26: United Kingdom Bio-Based Foam Industry Volume (kilotons) Forecast, by Application 2019 & 2032
- Table 27: Netherlands Bio-Based Foam Industry Revenue (Million) Forecast, by Application 2019 & 2032
- Table 28: Netherlands Bio-Based Foam Industry Volume (kilotons) Forecast, by Application 2019 & 2032
- Table 29: Rest of Europe Bio-Based Foam Industry Revenue (Million) Forecast, by Application 2019 & 2032
- Table 30: Rest of Europe Bio-Based Foam Industry Volume (kilotons) Forecast, by Application 2019 & 2032
- Table 31: Global Bio-Based Foam Industry Revenue Million Forecast, by Country 2019 & 2032
- Table 32: Global Bio-Based Foam Industry Volume kilotons Forecast, by Country 2019 & 2032
- Table 33: China Bio-Based Foam Industry Revenue (Million) Forecast, by Application 2019 & 2032
- Table 34: China Bio-Based Foam Industry Volume (kilotons) Forecast, by Application 2019 & 2032
- Table 35: Japan Bio-Based Foam Industry Revenue (Million) Forecast, by Application 2019 & 2032
- Table 36: Japan Bio-Based Foam Industry Volume (kilotons) Forecast, by Application 2019 & 2032
- Table 37: India Bio-Based Foam Industry Revenue (Million) Forecast, by Application 2019 & 2032
- Table 38: India Bio-Based Foam Industry Volume (kilotons) Forecast, by Application 2019 & 2032
- Table 39: South Korea Bio-Based Foam Industry Revenue (Million) Forecast, by Application 2019 & 2032
- Table 40: South Korea Bio-Based Foam Industry Volume (kilotons) Forecast, by Application 2019 & 2032
- Table 41: Taiwan Bio-Based Foam Industry Revenue (Million) Forecast, by Application 2019 & 2032
- Table 42: Taiwan Bio-Based Foam Industry Volume (kilotons) Forecast, by Application 2019 & 2032
- Table 43: Australia Bio-Based Foam Industry Revenue (Million) Forecast, by Application 2019 & 2032
- Table 44: Australia Bio-Based Foam Industry Volume (kilotons) Forecast, by Application 2019 & 2032
- Table 45: Rest of Asia-Pacific Bio-Based Foam Industry Revenue (Million) Forecast, by Application 2019 & 2032
- Table 46: Rest of Asia-Pacific Bio-Based Foam Industry Volume (kilotons) Forecast, by Application 2019 & 2032
- Table 47: Global Bio-Based Foam Industry Revenue Million Forecast, by Country 2019 & 2032
- Table 48: Global Bio-Based Foam Industry Volume kilotons Forecast, by Country 2019 & 2032
- Table 49: Brazil Bio-Based Foam Industry Revenue (Million) Forecast, by Application 2019 & 2032
- Table 50: Brazil Bio-Based Foam Industry Volume (kilotons) Forecast, by Application 2019 & 2032
- Table 51: Argentina Bio-Based Foam Industry Revenue (Million) Forecast, by Application 2019 & 2032
- Table 52: Argentina Bio-Based Foam Industry Volume (kilotons) Forecast, by Application 2019 & 2032
- Table 53: Rest of South America Bio-Based Foam Industry Revenue (Million) Forecast, by Application 2019 & 2032
- Table 54: Rest of South America Bio-Based Foam Industry Volume (kilotons) Forecast, by Application 2019 & 2032
- Table 55: Global Bio-Based Foam Industry Revenue Million Forecast, by Country 2019 & 2032
- Table 56: Global Bio-Based Foam Industry Volume kilotons Forecast, by Country 2019 & 2032
- Table 57: Middle East Bio-Based Foam Industry Revenue (Million) Forecast, by Application 2019 & 2032
- Table 58: Middle East Bio-Based Foam Industry Volume (kilotons) Forecast, by Application 2019 & 2032
- Table 59: Africa Bio-Based Foam Industry Revenue (Million) Forecast, by Application 2019 & 2032
- Table 60: Africa Bio-Based Foam Industry Volume (kilotons) Forecast, by Application 2019 & 2032
- Table 61: Global Bio-Based Foam Industry Revenue Million Forecast, by Application 2019 & 2032
- Table 62: Global Bio-Based Foam Industry Volume kilotons Forecast, by Application 2019 & 2032
- Table 63: Global Bio-Based Foam Industry Revenue Million Forecast, by End-user Industry 2019 & 2032
- Table 64: Global Bio-Based Foam Industry Volume kilotons Forecast, by End-user Industry 2019 & 2032
- Table 65: Global Bio-Based Foam Industry Revenue Million Forecast, by Country 2019 & 2032
- Table 66: Global Bio-Based Foam Industry Volume kilotons Forecast, by Country 2019 & 2032
- Table 67: China Bio-Based Foam Industry Revenue (Million) Forecast, by Application 2019 & 2032
- Table 68: China Bio-Based Foam Industry Volume (kilotons) Forecast, by Application 2019 & 2032
- Table 69: India Bio-Based Foam Industry Revenue (Million) Forecast, by Application 2019 & 2032
- Table 70: India Bio-Based Foam Industry Volume (kilotons) Forecast, by Application 2019 & 2032
- Table 71: Japan Bio-Based Foam Industry Revenue (Million) Forecast, by Application 2019 & 2032
- Table 72: Japan Bio-Based Foam Industry Volume (kilotons) Forecast, by Application 2019 & 2032
- Table 73: South Korea Bio-Based Foam Industry Revenue (Million) Forecast, by Application 2019 & 2032
- Table 74: South Korea Bio-Based Foam Industry Volume (kilotons) Forecast, by Application 2019 & 2032
- Table 75: Rest of Asia Pacific Bio-Based Foam Industry Revenue (Million) Forecast, by Application 2019 & 2032
- Table 76: Rest of Asia Pacific Bio-Based Foam Industry Volume (kilotons) Forecast, by Application 2019 & 2032
- Table 77: Global Bio-Based Foam Industry Revenue Million Forecast, by Application 2019 & 2032
- Table 78: Global Bio-Based Foam Industry Volume kilotons Forecast, by Application 2019 & 2032
- Table 79: Global Bio-Based Foam Industry Revenue Million Forecast, by End-user Industry 2019 & 2032
- Table 80: Global Bio-Based Foam Industry Volume kilotons Forecast, by End-user Industry 2019 & 2032
- Table 81: Global Bio-Based Foam Industry Revenue Million Forecast, by Country 2019 & 2032
- Table 82: Global Bio-Based Foam Industry Volume kilotons Forecast, by Country 2019 & 2032
- Table 83: United States Bio-Based Foam Industry Revenue (Million) Forecast, by Application 2019 & 2032
- Table 84: United States Bio-Based Foam Industry Volume (kilotons) Forecast, by Application 2019 & 2032
- Table 85: Canada Bio-Based Foam Industry Revenue (Million) Forecast, by Application 2019 & 2032
- Table 86: Canada Bio-Based Foam Industry Volume (kilotons) Forecast, by Application 2019 & 2032
- Table 87: Mexico Bio-Based Foam Industry Revenue (Million) Forecast, by Application 2019 & 2032
- Table 88: Mexico Bio-Based Foam Industry Volume (kilotons) Forecast, by Application 2019 & 2032
- Table 89: Global Bio-Based Foam Industry Revenue Million Forecast, by Application 2019 & 2032
- Table 90: Global Bio-Based Foam Industry Volume kilotons Forecast, by Application 2019 & 2032
- Table 91: Global Bio-Based Foam Industry Revenue Million Forecast, by End-user Industry 2019 & 2032
- Table 92: Global Bio-Based Foam Industry Volume kilotons Forecast, by End-user Industry 2019 & 2032
- Table 93: Global Bio-Based Foam Industry Revenue Million Forecast, by Country 2019 & 2032
- Table 94: Global Bio-Based Foam Industry Volume kilotons Forecast, by Country 2019 & 2032
- Table 95: Germany Bio-Based Foam Industry Revenue (Million) Forecast, by Application 2019 & 2032
- Table 96: Germany Bio-Based Foam Industry Volume (kilotons) Forecast, by Application 2019 & 2032
- Table 97: United Kingdom Bio-Based Foam Industry Revenue (Million) Forecast, by Application 2019 & 2032
- Table 98: United Kingdom Bio-Based Foam Industry Volume (kilotons) Forecast, by Application 2019 & 2032
- Table 99: Italy Bio-Based Foam Industry Revenue (Million) Forecast, by Application 2019 & 2032
- Table 100: Italy Bio-Based Foam Industry Volume (kilotons) Forecast, by Application 2019 & 2032
- Table 101: France Bio-Based Foam Industry Revenue (Million) Forecast, by Application 2019 & 2032
- Table 102: France Bio-Based Foam Industry Volume (kilotons) Forecast, by Application 2019 & 2032
- Table 103: Spain Bio-Based Foam Industry Revenue (Million) Forecast, by Application 2019 & 2032
- Table 104: Spain Bio-Based Foam Industry Volume (kilotons) Forecast, by Application 2019 & 2032
- Table 105: Rest of Europe Bio-Based Foam Industry Revenue (Million) Forecast, by Application 2019 & 2032
- Table 106: Rest of Europe Bio-Based Foam Industry Volume (kilotons) Forecast, by Application 2019 & 2032
- Table 107: Global Bio-Based Foam Industry Revenue Million Forecast, by Application 2019 & 2032
- Table 108: Global Bio-Based Foam Industry Volume kilotons Forecast, by Application 2019 & 2032
- Table 109: Global Bio-Based Foam Industry Revenue Million Forecast, by End-user Industry 2019 & 2032
- Table 110: Global Bio-Based Foam Industry Volume kilotons Forecast, by End-user Industry 2019 & 2032
- Table 111: Global Bio-Based Foam Industry Revenue Million Forecast, by Country 2019 & 2032
- Table 112: Global Bio-Based Foam Industry Volume kilotons Forecast, by Country 2019 & 2032
- Table 113: Brazil Bio-Based Foam Industry Revenue (Million) Forecast, by Application 2019 & 2032
- Table 114: Brazil Bio-Based Foam Industry Volume (kilotons) Forecast, by Application 2019 & 2032
- Table 115: Saudi Arabia Bio-Based Foam Industry Revenue (Million) Forecast, by Application 2019 & 2032
- Table 116: Saudi Arabia Bio-Based Foam Industry Volume (kilotons) Forecast, by Application 2019 & 2032
- Table 117: South Africa Bio-Based Foam Industry Revenue (Million) Forecast, by Application 2019 & 2032
- Table 118: South Africa Bio-Based Foam Industry Volume (kilotons) Forecast, by Application 2019 & 2032
- Table 119: Rest of the Countries Bio-Based Foam Industry Revenue (Million) Forecast, by Application 2019 & 2032
- Table 120: Rest of the Countries Bio-Based Foam Industry Volume (kilotons) Forecast, by Application 2019 & 2032
Frequently Asked Questions
1. What is the projected Compound Annual Growth Rate (CAGR) of the Bio-Based Foam Industry?
The projected CAGR is approximately 14.73%.
2. Which companies are prominent players in the Bio-Based Foam Industry?
Key companies in the market include Arkema, Teijin Limited, Mitsui Chemicals Inc, Toray Industries Inc, Miracll Chemicals Co Ltd, BASF SE, Huntsman International LLC, Woodbridge, Stahl Holdings BV, The Lubrizol Corporation, Covestro AG.
3. What are the main segments of the Bio-Based Foam Industry?
The market segments include Application, End-user Industry.
4. Can you provide details about the market size?
The market size is estimated to be USD XX Million as of 2022.
5. What are some drivers contributing to market growth?
Increasing Demand from the Construction Industry in Developing Countries; Growing Demand from Electronic Appliance Manufacturing.; Other Drivers.
6. What are the notable trends driving market growth?
Increasing Demand from the Transportation Industry.
7. Are there any restraints impacting market growth?
High Cost of Bio-based Materials; Other Restraints.
8. Can you provide examples of recent developments in the market?
November 2022: Covestro AG, a materials supplier, and Coleitec, a Chinese high-tech company, signed a strategic partnership agreement to accelerate the application development of polyurethane (PU) composite materials and further expand their market-oriented cooperation.
9. What pricing options are available for accessing the report?
Pricing options include single-user, multi-user, and enterprise licenses priced at USD 4750, USD 5250, and USD 8750 respectively.
10. Is the market size provided in terms of value or volume?
The market size is provided in terms of value, measured in Million and volume, measured in kilotons.
11. Are there any specific market keywords associated with the report?
Yes, the market keyword associated with the report is "Bio-Based Foam Industry," which aids in identifying and referencing the specific market segment covered.
12. How do I determine which pricing option suits my needs best?
The pricing options vary based on user requirements and access needs. Individual users may opt for single-user licenses, while businesses requiring broader access may choose multi-user or enterprise licenses for cost-effective access to the report.
13. Are there any additional resources or data provided in the Bio-Based Foam Industry report?
While the report offers comprehensive insights, it's advisable to review the specific contents or supplementary materials provided to ascertain if additional resources or data are available.
14. How can I stay updated on further developments or reports in the Bio-Based Foam Industry?
To stay informed about further developments, trends, and reports in the Bio-Based Foam Industry, consider subscribing to industry newsletters, following relevant companies and organizations, or regularly checking reputable industry news sources and publications.
Methodology
Step 1 - Identification of Relevant Samples Size from Population Database


Step 2 - Approaches for Defining Global Market Size (Value, Volume* & Price*)

Note*: In applicable scenarios
Step 3 - Data Sources
Primary Research
- Web Analytics
- Survey Reports
- Research Institute
- Latest Research Reports
- Opinion Leaders
Secondary Research
- Annual Reports
- White Paper
- Latest Press Release
- Industry Association
- Paid Database
- Investor Presentations

Step 4 - Data Triangulation
Involves using different sources of information in order to increase the validity of a study
These sources are likely to be stakeholders in a program - participants, other researchers, program staff, other community members, and so on.
Then we put all data in single framework & apply various statistical tools to find out the dynamic on the market.
During the analysis stage, feedback from the stakeholder groups would be compared to determine areas of agreement as well as areas of divergence


