

Key Insights
The Battery Testing and Inspection Equipment market is poised for significant expansion, propelled by the rapid growth of the electric vehicle (EV) sector, escalating demand for portable electronics, and the expanding energy storage industry. The market, valued at approximately $634.31 million in its base year of 2025, is projected to achieve a compound annual growth rate (CAGR) of 5.4% from 2025 to 2033. This robust growth is underpinned by the imperative for stringent quality control in battery manufacturing, the demand for assured performance and reliability, and the continuous evolution of battery technologies requiring sophisticated testing solutions. Key market drivers include testing equipment for battery cells, modules, and packs, with a notable trend towards portable systems offering enhanced flexibility and ease of deployment. The automotive and consumer electronics industries remain primary end-users, significantly influencing market demand. However, high initial capital investment for advanced equipment and the requirement for skilled operational personnel present notable market challenges.
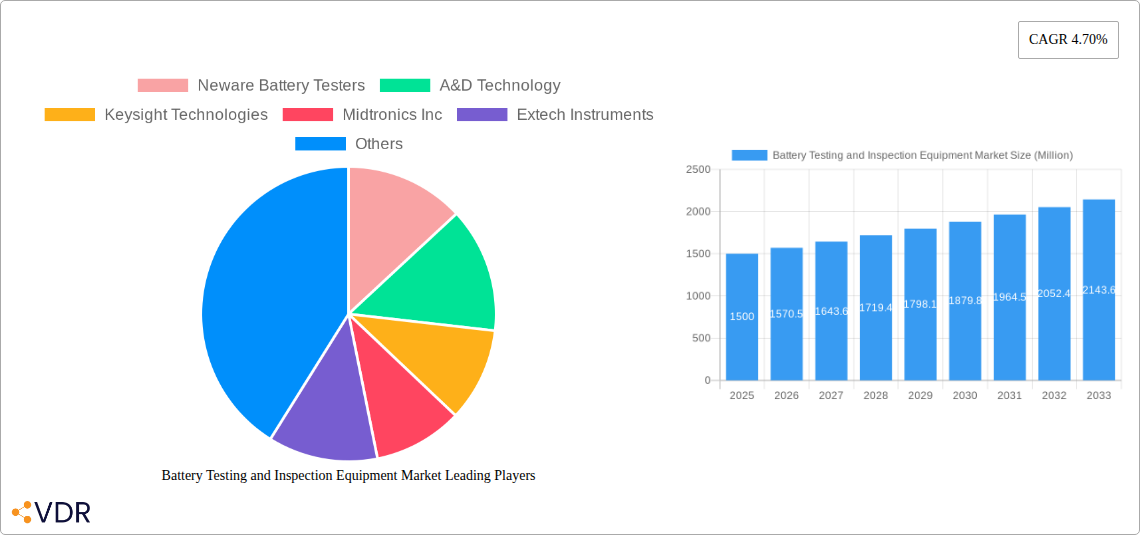
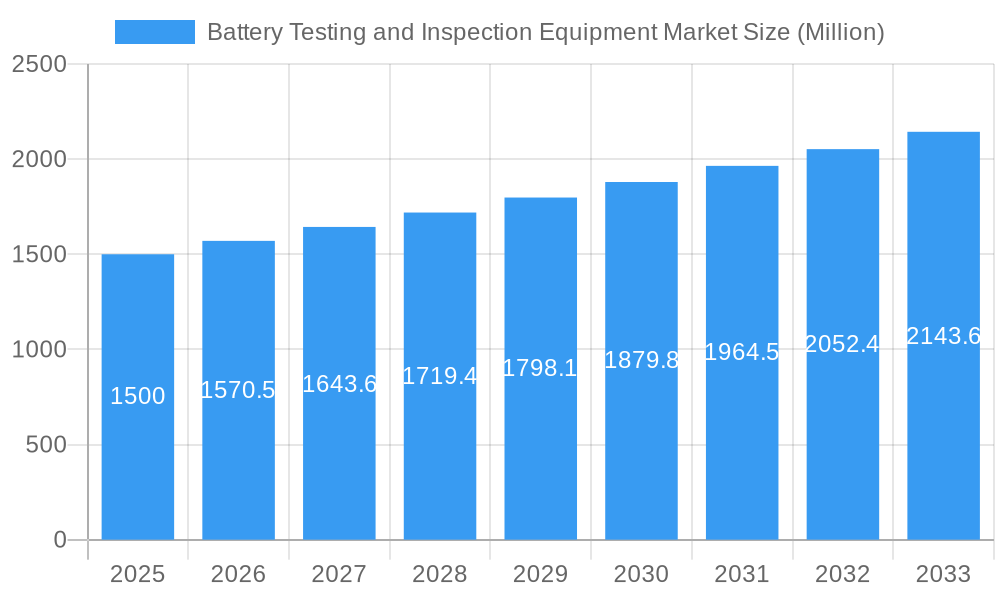
Battery Testing and Inspection Equipment Market Market Size (In Million)
Geographically, North America and Asia-Pacific lead the market, reflecting substantial investments in EV manufacturing and battery production within these regions. Europe follows, supported by strong government initiatives promoting renewable energy adoption and electric mobility. Emerging markets in South America and the Middle East & Africa are anticipated to experience progressive growth as the adoption of EVs and energy storage solutions accelerates. The competitive landscape is dynamic, characterized by established global leaders such as Keysight Technologies, Chroma Systems Solutions, and Arbin Instruments, alongside specialized niche players. Future market prosperity will depend on advancements in testing methodologies, equipment miniaturization, and the development of cost-effective solutions accessible to a wider manufacturer base. Opportunities for innovation lie in automated testing, AI-driven diagnostics, and accelerated testing protocols.
Battery Testing and Inspection Equipment Market Company Market Share
Battery Testing and Inspection Equipment Market: A Comprehensive Report (2019-2033)
This comprehensive report provides a detailed analysis of the Battery Testing and Inspection Equipment market, encompassing market dynamics, growth trends, regional dominance, product landscape, key players, and future outlook. The study period covers 2019-2033, with 2025 as the base and estimated year. The report segments the market by end-user industry (Automotive, Consumer Electronics, Energy and Utility, Telecom and Data Communication, Healthcare, Aerospace and Defense, Oil and Gas, Others), product type (Portable, Stationary), and application type (Battery Cell Testing Equipment, Battery Module Testing Equipment, Battery Pack Testing Equipment). The market size is valued in million units.
Battery Testing and Inspection Equipment Market Dynamics & Structure
The Battery Testing and Inspection Equipment market is characterized by moderate concentration, with several key players holding significant market share. New technological innovations, particularly in areas like AI-driven diagnostics and faster testing methodologies, are driving market growth. Stringent safety regulations for battery production and operation, particularly concerning lithium-ion batteries, further stimulate demand for sophisticated testing equipment. Competitive substitutes are limited, primarily focusing on manual testing methods which are less efficient and accurate. The end-user demographics are diverse, with significant growth driven by the automotive, energy storage, and consumer electronics sectors. M&A activity in the sector has been moderate (xx deals in the last 5 years, representing xx% of market value), mainly focused on expanding product portfolios and geographical reach.
- Market Concentration: Moderately concentrated, with top 5 players holding approximately xx% market share.
- Technological Innovation: Focus on AI, automation, faster testing, and improved data analytics.
- Regulatory Framework: Stringent safety regulations for battery applications drive demand.
- Competitive Substitutes: Limited; mainly less efficient manual testing processes.
- End-User Demographics: Primarily Automotive, Consumer Electronics, Energy Storage, and Telecom.
- M&A Trends: Moderate activity; focus on portfolio expansion and geographical reach.
Battery Testing and Inspection Equipment Market Growth Trends & Insights
The Battery Testing and Inspection Equipment market exhibits strong growth momentum, driven by the burgeoning demand for electric vehicles, energy storage solutions, and portable electronic devices. The market size has experienced substantial expansion from xx million units in 2019 to an estimated xx million units in 2025, with a projected CAGR of xx% during the forecast period (2025-2033). This growth is fueled by increasing adoption rates across various end-user industries, coupled with technological advancements that enhance testing capabilities and efficiency. The market penetration rate is currently at approximately xx%, with significant potential for future growth, particularly in emerging markets. Technological disruptions, such as the introduction of faster and more accurate testing methodologies, are accelerating market adoption. Consumer behavior shifts toward environmentally friendly technologies also bolster demand.
Dominant Regions, Countries, or Segments in Battery Testing and Inspection Equipment Market
The Automotive sector currently dominates the Battery Testing and Inspection Equipment market, representing xx% of the total market value in 2025, followed by the Consumer Electronics sector with xx%. Geographically, North America and Asia-Pacific are leading regions, fueled by robust growth in the electric vehicle and energy storage industries. Within these regions, countries such as the United States, China, and Japan are key market drivers.
- Dominant End-user Industry: Automotive (xx%), Consumer Electronics (xx%)
- Dominant Product Type: Stationary (xx%)
- Dominant Application Type: Battery Pack Testing Equipment (xx%)
- Dominant Region: North America (xx%), Asia-Pacific (xx%)
- Key Growth Drivers:
- Rapid growth of Electric Vehicle (EV) and Hybrid Electric Vehicle (HEV) market.
- Expanding renewable energy sector and energy storage solutions.
- Increased demand for consumer electronics with longer battery life.
- Government initiatives promoting electric mobility and renewable energy.
Battery Testing and Inspection Equipment Market Product Landscape
The market offers a diverse range of products, including portable and stationary testing equipment capable of testing battery cells, modules, and packs. Innovations focus on enhancing accuracy, speed, and automation, incorporating features like AI-driven diagnostics and cloud connectivity for remote monitoring and data analysis. These advancements enable manufacturers to improve battery performance, safety, and lifespan. Unique selling propositions include ease-of-use, cost-effectiveness, and advanced analytical capabilities.
Key Drivers, Barriers & Challenges in Battery Testing and Inspection Equipment Market
Key Drivers: The burgeoning EV market, stringent safety regulations, increasing demand for high-performance batteries, and the growing renewable energy sector are key market drivers. Government incentives and investments in battery technology research and development further accelerate growth.
Key Challenges: High initial investment costs, the complexity of testing different battery chemistries, and the need for skilled personnel to operate sophisticated equipment pose significant challenges. Supply chain disruptions, particularly regarding critical components, also impact market growth. Furthermore, intense competition from established and emerging players creates pressure on pricing and margins.
Emerging Opportunities in Battery Testing and Inspection Equipment Market
Untapped markets in developing economies, expanding applications in grid-scale energy storage, and the increasing demand for battery testing services represent significant growth opportunities. The development of advanced testing methodologies for solid-state batteries and other next-generation battery technologies will further drive market expansion. Evolving consumer preferences towards sustainable and reliable energy solutions also present new avenues for growth.
Growth Accelerators in the Battery Testing and Inspection Equipment Market Industry
Technological advancements in battery testing methodologies, strategic partnerships between equipment manufacturers and battery producers, and expansion into new geographical markets are key catalysts driving long-term growth. The development of standardized testing protocols and increased adoption of automation technologies will further enhance market prospects.
Key Players Shaping the Battery Testing and Inspection Equipment Market Market
Notable Milestones in Battery Testing and Inspection Equipment Market Sector
- February 2022: Hioki launched three new battery quality testers aimed at improving lithium-ion battery safety.
- January 2022: Arbin Instruments announced expansion into broader battery testing solutions, supporting sustainability efforts and various applications.
In-Depth Battery Testing and Inspection Equipment Market Market Outlook
The Battery Testing and Inspection Equipment market is poised for significant expansion over the next decade, driven by the continued growth of the EV and renewable energy sectors. Strategic partnerships, technological advancements, and expansion into emerging markets will create substantial opportunities for market players. The focus on enhancing battery safety and performance, combined with the increasing demand for sophisticated testing solutions, will further fuel market growth.
Battery Testing and Inspection Equipment Market Segmentation
-
1. Product Type
- 1.1. Portable
- 1.2. Stationary
-
2. Application Type
- 2.1. Battery Cell Testing Equipment
- 2.2. Battery Module Testing Equipment
- 2.3. Battery Pack Testing Equipment
-
3. End-user Industry
- 3.1. Automotive
- 3.2. Consumer Electronics
- 3.3. Energy and Utility
- 3.4. Telecom and Data Communication
- 3.5. Healthcare
- 3.6. Aerospace and defense
- 3.7. Oil and Gas
- 3.8. Others (
Battery Testing and Inspection Equipment Market Segmentation By Geography
-
1. North America
- 1.1. United States
- 1.2. Canada
-
2. Europe
- 2.1. United Kingdom
- 2.2. Germany
- 2.3. France
- 2.4. Rest of Europe
-
3. Asia Pacific
- 3.1. China
- 3.2. Japan
- 3.3. India
- 3.4. Rest of Asia Pacific
- 4. Latin America
- 5. Middle East and Africa
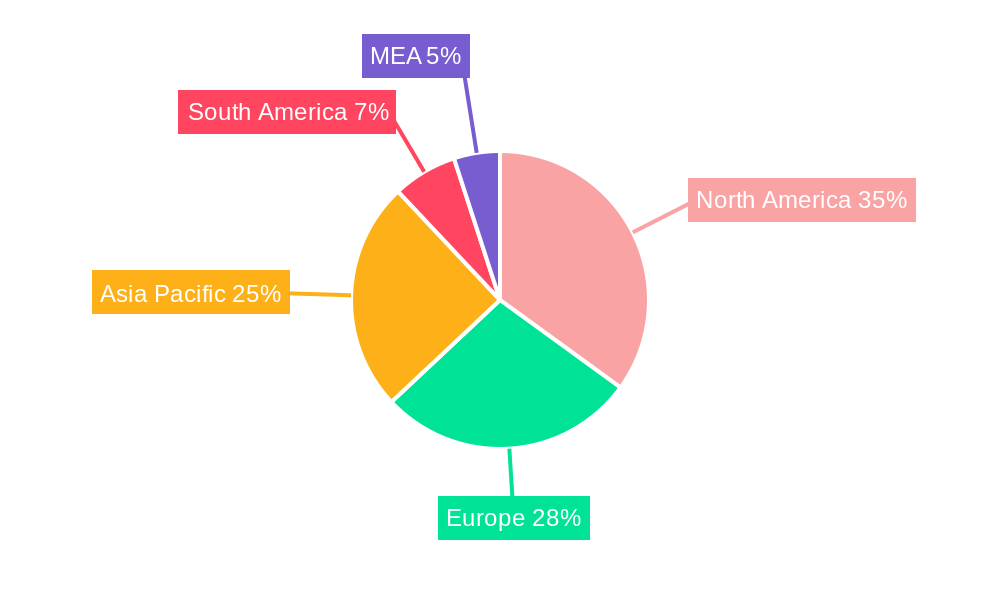
Battery Testing and Inspection Equipment Market Regional Market Share
Geographic Coverage of Battery Testing and Inspection Equipment Market
Battery Testing and Inspection Equipment Market REPORT HIGHLIGHTS
| Aspects | Details |
|---|---|
| Study Period | 2020-2034 |
| Base Year | 2025 |
| Estimated Year | 2026 |
| Forecast Period | 2026-2034 |
| Historical Period | 2020-2025 |
| Growth Rate | CAGR of 5.4% from 2020-2034 |
| Segmentation |
|
Table of Contents
- 1. Introduction
- 1.1. Research Scope
- 1.2. Market Segmentation
- 1.3. Research Objective
- 1.4. Definitions and Assumptions
- 2. Executive Summary
- 2.1. Market Snapshot
- 3. Market Dynamics
- 3.1. Market Drivers
- 3.2. Market Restrains
- 3.3. Market Trends
- 3.4. Market Opportunities
- 4. Market Factor Analysis
- 4.1. Porters Five Forces
- 4.1.1. Bargaining Power of Suppliers
- 4.1.2. Bargaining Power of Buyers
- 4.1.3. Threat of New Entrants
- 4.1.4. Threat of Substitutes
- 4.1.5. Competitive Rivalry
- 4.2. PESTEL analysis
- 4.3. BCG Analysis
- 4.3.1. Stars (High Growth, High Market Share)
- 4.3.2. Cash Cows (Low Growth, High Market Share)
- 4.3.3. Question Mark (High Growth, Low Market Share)
- 4.3.4. Dogs (Low Growth, Low Market Share)
- 4.4. Ansoff Matrix Analysis
- 4.5. Supply Chain Analysis
- 4.6. Regulatory Landscape
- 4.7. Current Market Potential and Opportunity Assessment (TAM–SAM–SOM Framework)
- 4.8. VDR Analyst Note
- 4.1. Porters Five Forces
- 5. Market Analysis, Insights and Forecast 2021-2033
- 5.1. Market Analysis, Insights and Forecast - by Product Type
- 5.1.1. Portable
- 5.1.2. Stationary
- 5.2. Market Analysis, Insights and Forecast - by Application Type
- 5.2.1. Battery Cell Testing Equipment
- 5.2.2. Battery Module Testing Equipment
- 5.2.3. Battery Pack Testing Equipment
- 5.3. Market Analysis, Insights and Forecast - by End-user Industry
- 5.3.1. Automotive
- 5.3.2. Consumer Electronics
- 5.3.3. Energy and Utility
- 5.3.4. Telecom and Data Communication
- 5.3.5. Healthcare
- 5.3.6. Aerospace and defense
- 5.3.7. Oil and Gas
- 5.3.8. Others (
- 5.4. Market Analysis, Insights and Forecast - by Region
- 5.4.1. North America
- 5.4.2. Europe
- 5.4.3. Asia Pacific
- 5.4.4. Latin America
- 5.4.5. Middle East and Africa
- 5.1. Market Analysis, Insights and Forecast - by Product Type
- 6. Global Battery Testing and Inspection Equipment Market Analysis, Insights and Forecast, 2021-2033
- 6.1. Market Analysis, Insights and Forecast - by Product Type
- 6.1.1. Portable
- 6.1.2. Stationary
- 6.2. Market Analysis, Insights and Forecast - by Application Type
- 6.2.1. Battery Cell Testing Equipment
- 6.2.2. Battery Module Testing Equipment
- 6.2.3. Battery Pack Testing Equipment
- 6.3. Market Analysis, Insights and Forecast - by End-user Industry
- 6.3.1. Automotive
- 6.3.2. Consumer Electronics
- 6.3.3. Energy and Utility
- 6.3.4. Telecom and Data Communication
- 6.3.5. Healthcare
- 6.3.6. Aerospace and defense
- 6.3.7. Oil and Gas
- 6.3.8. Others (
- 6.1. Market Analysis, Insights and Forecast - by Product Type
- 7. North America Battery Testing and Inspection Equipment Market Analysis, Insights and Forecast, 2021-2033
- 7.1. Market Analysis, Insights and Forecast - by Product Type
- 7.1.1. Portable
- 7.1.2. Stationary
- 7.2. Market Analysis, Insights and Forecast - by Application Type
- 7.2.1. Battery Cell Testing Equipment
- 7.2.2. Battery Module Testing Equipment
- 7.2.3. Battery Pack Testing Equipment
- 7.3. Market Analysis, Insights and Forecast - by End-user Industry
- 7.3.1. Automotive
- 7.3.2. Consumer Electronics
- 7.3.3. Energy and Utility
- 7.3.4. Telecom and Data Communication
- 7.3.5. Healthcare
- 7.3.6. Aerospace and defense
- 7.3.7. Oil and Gas
- 7.3.8. Others (
- 7.1. Market Analysis, Insights and Forecast - by Product Type
- 8. Europe Battery Testing and Inspection Equipment Market Analysis, Insights and Forecast, 2021-2033
- 8.1. Market Analysis, Insights and Forecast - by Product Type
- 8.1.1. Portable
- 8.1.2. Stationary
- 8.2. Market Analysis, Insights and Forecast - by Application Type
- 8.2.1. Battery Cell Testing Equipment
- 8.2.2. Battery Module Testing Equipment
- 8.2.3. Battery Pack Testing Equipment
- 8.3. Market Analysis, Insights and Forecast - by End-user Industry
- 8.3.1. Automotive
- 8.3.2. Consumer Electronics
- 8.3.3. Energy and Utility
- 8.3.4. Telecom and Data Communication
- 8.3.5. Healthcare
- 8.3.6. Aerospace and defense
- 8.3.7. Oil and Gas
- 8.3.8. Others (
- 8.1. Market Analysis, Insights and Forecast - by Product Type
- 9. Asia Pacific Battery Testing and Inspection Equipment Market Analysis, Insights and Forecast, 2021-2033
- 9.1. Market Analysis, Insights and Forecast - by Product Type
- 9.1.1. Portable
- 9.1.2. Stationary
- 9.2. Market Analysis, Insights and Forecast - by Application Type
- 9.2.1. Battery Cell Testing Equipment
- 9.2.2. Battery Module Testing Equipment
- 9.2.3. Battery Pack Testing Equipment
- 9.3. Market Analysis, Insights and Forecast - by End-user Industry
- 9.3.1. Automotive
- 9.3.2. Consumer Electronics
- 9.3.3. Energy and Utility
- 9.3.4. Telecom and Data Communication
- 9.3.5. Healthcare
- 9.3.6. Aerospace and defense
- 9.3.7. Oil and Gas
- 9.3.8. Others (
- 9.1. Market Analysis, Insights and Forecast - by Product Type
- 10. Latin America Battery Testing and Inspection Equipment Market Analysis, Insights and Forecast, 2021-2033
- 10.1. Market Analysis, Insights and Forecast - by Product Type
- 10.1.1. Portable
- 10.1.2. Stationary
- 10.2. Market Analysis, Insights and Forecast - by Application Type
- 10.2.1. Battery Cell Testing Equipment
- 10.2.2. Battery Module Testing Equipment
- 10.2.3. Battery Pack Testing Equipment
- 10.3. Market Analysis, Insights and Forecast - by End-user Industry
- 10.3.1. Automotive
- 10.3.2. Consumer Electronics
- 10.3.3. Energy and Utility
- 10.3.4. Telecom and Data Communication
- 10.3.5. Healthcare
- 10.3.6. Aerospace and defense
- 10.3.7. Oil and Gas
- 10.3.8. Others (
- 10.1. Market Analysis, Insights and Forecast - by Product Type
- 11. Middle East and Africa Battery Testing and Inspection Equipment Market Analysis, Insights and Forecast, 2021-2033
- 11.1. Market Analysis, Insights and Forecast - by Product Type
- 11.1.1. Portable
- 11.1.2. Stationary
- 11.2. Market Analysis, Insights and Forecast - by Application Type
- 11.2.1. Battery Cell Testing Equipment
- 11.2.2. Battery Module Testing Equipment
- 11.2.3. Battery Pack Testing Equipment
- 11.3. Market Analysis, Insights and Forecast - by End-user Industry
- 11.3.1. Automotive
- 11.3.2. Consumer Electronics
- 11.3.3. Energy and Utility
- 11.3.4. Telecom and Data Communication
- 11.3.5. Healthcare
- 11.3.6. Aerospace and defense
- 11.3.7. Oil and Gas
- 11.3.8. Others (
- 11.1. Market Analysis, Insights and Forecast - by Product Type
- 12. Competitive Analysis
- 12.1. Company Profiles
- 12.1.1 Neware Battery Testers
- 12.1.1.1. Company Overview
- 12.1.1.2. Products
- 12.1.1.3. Company Financials
- 12.1.1.4. SWOT Analysis
- 12.1.2 A&D Technology
- 12.1.2.1. Company Overview
- 12.1.2.2. Products
- 12.1.2.3. Company Financials
- 12.1.2.4. SWOT Analysis
- 12.1.3 Keysight Technologies
- 12.1.3.1. Company Overview
- 12.1.3.2. Products
- 12.1.3.3. Company Financials
- 12.1.3.4. SWOT Analysis
- 12.1.4 Midtronics Inc
- 12.1.4.1. Company Overview
- 12.1.4.2. Products
- 12.1.4.3. Company Financials
- 12.1.4.4. SWOT Analysis
- 12.1.5 Extech Instruments
- 12.1.5.1. Company Overview
- 12.1.5.2. Products
- 12.1.5.3. Company Financials
- 12.1.5.4. SWOT Analysis
- 12.1.6 Arbin Instruments
- 12.1.6.1. Company Overview
- 12.1.6.2. Products
- 12.1.6.3. Company Financials
- 12.1.6.4. SWOT Analysis
- 12.1.7 MTI Corporation
- 12.1.7.1. Company Overview
- 12.1.7.2. Products
- 12.1.7.3. Company Financials
- 12.1.7.4. SWOT Analysis
- 12.1.8 Chroma Systems Solutions Inc
- 12.1.8.1. Company Overview
- 12.1.8.2. Products
- 12.1.8.3. Company Financials
- 12.1.8.4. SWOT Analysis
- 12.1.9 Kikusui Electronics Corp
- 12.1.9.1. Company Overview
- 12.1.9.2. Products
- 12.1.9.3. Company Financials
- 12.1.9.4. SWOT Analysis
- 12.1.10 Heinzinger Electronic GmbH
- 12.1.10.1. Company Overview
- 12.1.10.2. Products
- 12.1.10.3. Company Financials
- 12.1.10.4. SWOT Analysis
- 12.1.11 Megger
- 12.1.11.1. Company Overview
- 12.1.11.2. Products
- 12.1.11.3. Company Financials
- 12.1.11.4. SWOT Analysis
- 12.1.12 Hioko USA
- 12.1.12.1. Company Overview
- 12.1.12.2. Products
- 12.1.12.3. Company Financials
- 12.1.12.4. SWOT Analysis
- 12.1.1 Neware Battery Testers
- 12.2. Market Entropy
- 12.2.1 Company's Key Areas Served
- 12.2.2 Recent Developments
- 12.3. Company Market Share Analysis 2025
- 12.3.1 Top 5 Companies Market Share Analysis
- 12.3.2 Top 3 Companies Market Share Analysis
- 12.4. List of Potential Customers
- 13. Research Methodology
List of Figures
- Figure 1: Global Battery Testing and Inspection Equipment Market Revenue Breakdown (million, %) by Region 2025 & 2033
- Figure 2: Global Battery Testing and Inspection Equipment Market Volume Breakdown (K Unit, %) by Region 2025 & 2033
- Figure 3: North America Battery Testing and Inspection Equipment Market Revenue (million), by Product Type 2025 & 2033
- Figure 4: North America Battery Testing and Inspection Equipment Market Volume (K Unit), by Product Type 2025 & 2033
- Figure 5: North America Battery Testing and Inspection Equipment Market Revenue Share (%), by Product Type 2025 & 2033
- Figure 6: North America Battery Testing and Inspection Equipment Market Volume Share (%), by Product Type 2025 & 2033
- Figure 7: North America Battery Testing and Inspection Equipment Market Revenue (million), by Application Type 2025 & 2033
- Figure 8: North America Battery Testing and Inspection Equipment Market Volume (K Unit), by Application Type 2025 & 2033
- Figure 9: North America Battery Testing and Inspection Equipment Market Revenue Share (%), by Application Type 2025 & 2033
- Figure 10: North America Battery Testing and Inspection Equipment Market Volume Share (%), by Application Type 2025 & 2033
- Figure 11: North America Battery Testing and Inspection Equipment Market Revenue (million), by End-user Industry 2025 & 2033
- Figure 12: North America Battery Testing and Inspection Equipment Market Volume (K Unit), by End-user Industry 2025 & 2033
- Figure 13: North America Battery Testing and Inspection Equipment Market Revenue Share (%), by End-user Industry 2025 & 2033
- Figure 14: North America Battery Testing and Inspection Equipment Market Volume Share (%), by End-user Industry 2025 & 2033
- Figure 15: North America Battery Testing and Inspection Equipment Market Revenue (million), by Country 2025 & 2033
- Figure 16: North America Battery Testing and Inspection Equipment Market Volume (K Unit), by Country 2025 & 2033
- Figure 17: North America Battery Testing and Inspection Equipment Market Revenue Share (%), by Country 2025 & 2033
- Figure 18: North America Battery Testing and Inspection Equipment Market Volume Share (%), by Country 2025 & 2033
- Figure 19: Europe Battery Testing and Inspection Equipment Market Revenue (million), by Product Type 2025 & 2033
- Figure 20: Europe Battery Testing and Inspection Equipment Market Volume (K Unit), by Product Type 2025 & 2033
- Figure 21: Europe Battery Testing and Inspection Equipment Market Revenue Share (%), by Product Type 2025 & 2033
- Figure 22: Europe Battery Testing and Inspection Equipment Market Volume Share (%), by Product Type 2025 & 2033
- Figure 23: Europe Battery Testing and Inspection Equipment Market Revenue (million), by Application Type 2025 & 2033
- Figure 24: Europe Battery Testing and Inspection Equipment Market Volume (K Unit), by Application Type 2025 & 2033
- Figure 25: Europe Battery Testing and Inspection Equipment Market Revenue Share (%), by Application Type 2025 & 2033
- Figure 26: Europe Battery Testing and Inspection Equipment Market Volume Share (%), by Application Type 2025 & 2033
- Figure 27: Europe Battery Testing and Inspection Equipment Market Revenue (million), by End-user Industry 2025 & 2033
- Figure 28: Europe Battery Testing and Inspection Equipment Market Volume (K Unit), by End-user Industry 2025 & 2033
- Figure 29: Europe Battery Testing and Inspection Equipment Market Revenue Share (%), by End-user Industry 2025 & 2033
- Figure 30: Europe Battery Testing and Inspection Equipment Market Volume Share (%), by End-user Industry 2025 & 2033
- Figure 31: Europe Battery Testing and Inspection Equipment Market Revenue (million), by Country 2025 & 2033
- Figure 32: Europe Battery Testing and Inspection Equipment Market Volume (K Unit), by Country 2025 & 2033
- Figure 33: Europe Battery Testing and Inspection Equipment Market Revenue Share (%), by Country 2025 & 2033
- Figure 34: Europe Battery Testing and Inspection Equipment Market Volume Share (%), by Country 2025 & 2033
- Figure 35: Asia Pacific Battery Testing and Inspection Equipment Market Revenue (million), by Product Type 2025 & 2033
- Figure 36: Asia Pacific Battery Testing and Inspection Equipment Market Volume (K Unit), by Product Type 2025 & 2033
- Figure 37: Asia Pacific Battery Testing and Inspection Equipment Market Revenue Share (%), by Product Type 2025 & 2033
- Figure 38: Asia Pacific Battery Testing and Inspection Equipment Market Volume Share (%), by Product Type 2025 & 2033
- Figure 39: Asia Pacific Battery Testing and Inspection Equipment Market Revenue (million), by Application Type 2025 & 2033
- Figure 40: Asia Pacific Battery Testing and Inspection Equipment Market Volume (K Unit), by Application Type 2025 & 2033
- Figure 41: Asia Pacific Battery Testing and Inspection Equipment Market Revenue Share (%), by Application Type 2025 & 2033
- Figure 42: Asia Pacific Battery Testing and Inspection Equipment Market Volume Share (%), by Application Type 2025 & 2033
- Figure 43: Asia Pacific Battery Testing and Inspection Equipment Market Revenue (million), by End-user Industry 2025 & 2033
- Figure 44: Asia Pacific Battery Testing and Inspection Equipment Market Volume (K Unit), by End-user Industry 2025 & 2033
- Figure 45: Asia Pacific Battery Testing and Inspection Equipment Market Revenue Share (%), by End-user Industry 2025 & 2033
- Figure 46: Asia Pacific Battery Testing and Inspection Equipment Market Volume Share (%), by End-user Industry 2025 & 2033
- Figure 47: Asia Pacific Battery Testing and Inspection Equipment Market Revenue (million), by Country 2025 & 2033
- Figure 48: Asia Pacific Battery Testing and Inspection Equipment Market Volume (K Unit), by Country 2025 & 2033
- Figure 49: Asia Pacific Battery Testing and Inspection Equipment Market Revenue Share (%), by Country 2025 & 2033
- Figure 50: Asia Pacific Battery Testing and Inspection Equipment Market Volume Share (%), by Country 2025 & 2033
- Figure 51: Latin America Battery Testing and Inspection Equipment Market Revenue (million), by Product Type 2025 & 2033
- Figure 52: Latin America Battery Testing and Inspection Equipment Market Volume (K Unit), by Product Type 2025 & 2033
- Figure 53: Latin America Battery Testing and Inspection Equipment Market Revenue Share (%), by Product Type 2025 & 2033
- Figure 54: Latin America Battery Testing and Inspection Equipment Market Volume Share (%), by Product Type 2025 & 2033
- Figure 55: Latin America Battery Testing and Inspection Equipment Market Revenue (million), by Application Type 2025 & 2033
- Figure 56: Latin America Battery Testing and Inspection Equipment Market Volume (K Unit), by Application Type 2025 & 2033
- Figure 57: Latin America Battery Testing and Inspection Equipment Market Revenue Share (%), by Application Type 2025 & 2033
- Figure 58: Latin America Battery Testing and Inspection Equipment Market Volume Share (%), by Application Type 2025 & 2033
- Figure 59: Latin America Battery Testing and Inspection Equipment Market Revenue (million), by End-user Industry 2025 & 2033
- Figure 60: Latin America Battery Testing and Inspection Equipment Market Volume (K Unit), by End-user Industry 2025 & 2033
- Figure 61: Latin America Battery Testing and Inspection Equipment Market Revenue Share (%), by End-user Industry 2025 & 2033
- Figure 62: Latin America Battery Testing and Inspection Equipment Market Volume Share (%), by End-user Industry 2025 & 2033
- Figure 63: Latin America Battery Testing and Inspection Equipment Market Revenue (million), by Country 2025 & 2033
- Figure 64: Latin America Battery Testing and Inspection Equipment Market Volume (K Unit), by Country 2025 & 2033
- Figure 65: Latin America Battery Testing and Inspection Equipment Market Revenue Share (%), by Country 2025 & 2033
- Figure 66: Latin America Battery Testing and Inspection Equipment Market Volume Share (%), by Country 2025 & 2033
- Figure 67: Middle East and Africa Battery Testing and Inspection Equipment Market Revenue (million), by Product Type 2025 & 2033
- Figure 68: Middle East and Africa Battery Testing and Inspection Equipment Market Volume (K Unit), by Product Type 2025 & 2033
- Figure 69: Middle East and Africa Battery Testing and Inspection Equipment Market Revenue Share (%), by Product Type 2025 & 2033
- Figure 70: Middle East and Africa Battery Testing and Inspection Equipment Market Volume Share (%), by Product Type 2025 & 2033
- Figure 71: Middle East and Africa Battery Testing and Inspection Equipment Market Revenue (million), by Application Type 2025 & 2033
- Figure 72: Middle East and Africa Battery Testing and Inspection Equipment Market Volume (K Unit), by Application Type 2025 & 2033
- Figure 73: Middle East and Africa Battery Testing and Inspection Equipment Market Revenue Share (%), by Application Type 2025 & 2033
- Figure 74: Middle East and Africa Battery Testing and Inspection Equipment Market Volume Share (%), by Application Type 2025 & 2033
- Figure 75: Middle East and Africa Battery Testing and Inspection Equipment Market Revenue (million), by End-user Industry 2025 & 2033
- Figure 76: Middle East and Africa Battery Testing and Inspection Equipment Market Volume (K Unit), by End-user Industry 2025 & 2033
- Figure 77: Middle East and Africa Battery Testing and Inspection Equipment Market Revenue Share (%), by End-user Industry 2025 & 2033
- Figure 78: Middle East and Africa Battery Testing and Inspection Equipment Market Volume Share (%), by End-user Industry 2025 & 2033
- Figure 79: Middle East and Africa Battery Testing and Inspection Equipment Market Revenue (million), by Country 2025 & 2033
- Figure 80: Middle East and Africa Battery Testing and Inspection Equipment Market Volume (K Unit), by Country 2025 & 2033
- Figure 81: Middle East and Africa Battery Testing and Inspection Equipment Market Revenue Share (%), by Country 2025 & 2033
- Figure 82: Middle East and Africa Battery Testing and Inspection Equipment Market Volume Share (%), by Country 2025 & 2033
List of Tables
- Table 1: Global Battery Testing and Inspection Equipment Market Revenue million Forecast, by Product Type 2020 & 2033
- Table 2: Global Battery Testing and Inspection Equipment Market Volume K Unit Forecast, by Product Type 2020 & 2033
- Table 3: Global Battery Testing and Inspection Equipment Market Revenue million Forecast, by Application Type 2020 & 2033
- Table 4: Global Battery Testing and Inspection Equipment Market Volume K Unit Forecast, by Application Type 2020 & 2033
- Table 5: Global Battery Testing and Inspection Equipment Market Revenue million Forecast, by End-user Industry 2020 & 2033
- Table 6: Global Battery Testing and Inspection Equipment Market Volume K Unit Forecast, by End-user Industry 2020 & 2033
- Table 7: Global Battery Testing and Inspection Equipment Market Revenue million Forecast, by Region 2020 & 2033
- Table 8: Global Battery Testing and Inspection Equipment Market Volume K Unit Forecast, by Region 2020 & 2033
- Table 9: Global Battery Testing and Inspection Equipment Market Revenue million Forecast, by Product Type 2020 & 2033
- Table 10: Global Battery Testing and Inspection Equipment Market Volume K Unit Forecast, by Product Type 2020 & 2033
- Table 11: Global Battery Testing and Inspection Equipment Market Revenue million Forecast, by Application Type 2020 & 2033
- Table 12: Global Battery Testing and Inspection Equipment Market Volume K Unit Forecast, by Application Type 2020 & 2033
- Table 13: Global Battery Testing and Inspection Equipment Market Revenue million Forecast, by End-user Industry 2020 & 2033
- Table 14: Global Battery Testing and Inspection Equipment Market Volume K Unit Forecast, by End-user Industry 2020 & 2033
- Table 15: Global Battery Testing and Inspection Equipment Market Revenue million Forecast, by Country 2020 & 2033
- Table 16: Global Battery Testing and Inspection Equipment Market Volume K Unit Forecast, by Country 2020 & 2033
- Table 17: United States Battery Testing and Inspection Equipment Market Revenue (million) Forecast, by Application 2020 & 2033
- Table 18: United States Battery Testing and Inspection Equipment Market Volume (K Unit) Forecast, by Application 2020 & 2033
- Table 19: Canada Battery Testing and Inspection Equipment Market Revenue (million) Forecast, by Application 2020 & 2033
- Table 20: Canada Battery Testing and Inspection Equipment Market Volume (K Unit) Forecast, by Application 2020 & 2033
- Table 21: Global Battery Testing and Inspection Equipment Market Revenue million Forecast, by Product Type 2020 & 2033
- Table 22: Global Battery Testing and Inspection Equipment Market Volume K Unit Forecast, by Product Type 2020 & 2033
- Table 23: Global Battery Testing and Inspection Equipment Market Revenue million Forecast, by Application Type 2020 & 2033
- Table 24: Global Battery Testing and Inspection Equipment Market Volume K Unit Forecast, by Application Type 2020 & 2033
- Table 25: Global Battery Testing and Inspection Equipment Market Revenue million Forecast, by End-user Industry 2020 & 2033
- Table 26: Global Battery Testing and Inspection Equipment Market Volume K Unit Forecast, by End-user Industry 2020 & 2033
- Table 27: Global Battery Testing and Inspection Equipment Market Revenue million Forecast, by Country 2020 & 2033
- Table 28: Global Battery Testing and Inspection Equipment Market Volume K Unit Forecast, by Country 2020 & 2033
- Table 29: United Kingdom Battery Testing and Inspection Equipment Market Revenue (million) Forecast, by Application 2020 & 2033
- Table 30: United Kingdom Battery Testing and Inspection Equipment Market Volume (K Unit) Forecast, by Application 2020 & 2033
- Table 31: Germany Battery Testing and Inspection Equipment Market Revenue (million) Forecast, by Application 2020 & 2033
- Table 32: Germany Battery Testing and Inspection Equipment Market Volume (K Unit) Forecast, by Application 2020 & 2033
- Table 33: France Battery Testing and Inspection Equipment Market Revenue (million) Forecast, by Application 2020 & 2033
- Table 34: France Battery Testing and Inspection Equipment Market Volume (K Unit) Forecast, by Application 2020 & 2033
- Table 35: Rest of Europe Battery Testing and Inspection Equipment Market Revenue (million) Forecast, by Application 2020 & 2033
- Table 36: Rest of Europe Battery Testing and Inspection Equipment Market Volume (K Unit) Forecast, by Application 2020 & 2033
- Table 37: Global Battery Testing and Inspection Equipment Market Revenue million Forecast, by Product Type 2020 & 2033
- Table 38: Global Battery Testing and Inspection Equipment Market Volume K Unit Forecast, by Product Type 2020 & 2033
- Table 39: Global Battery Testing and Inspection Equipment Market Revenue million Forecast, by Application Type 2020 & 2033
- Table 40: Global Battery Testing and Inspection Equipment Market Volume K Unit Forecast, by Application Type 2020 & 2033
- Table 41: Global Battery Testing and Inspection Equipment Market Revenue million Forecast, by End-user Industry 2020 & 2033
- Table 42: Global Battery Testing and Inspection Equipment Market Volume K Unit Forecast, by End-user Industry 2020 & 2033
- Table 43: Global Battery Testing and Inspection Equipment Market Revenue million Forecast, by Country 2020 & 2033
- Table 44: Global Battery Testing and Inspection Equipment Market Volume K Unit Forecast, by Country 2020 & 2033
- Table 45: China Battery Testing and Inspection Equipment Market Revenue (million) Forecast, by Application 2020 & 2033
- Table 46: China Battery Testing and Inspection Equipment Market Volume (K Unit) Forecast, by Application 2020 & 2033
- Table 47: Japan Battery Testing and Inspection Equipment Market Revenue (million) Forecast, by Application 2020 & 2033
- Table 48: Japan Battery Testing and Inspection Equipment Market Volume (K Unit) Forecast, by Application 2020 & 2033
- Table 49: India Battery Testing and Inspection Equipment Market Revenue (million) Forecast, by Application 2020 & 2033
- Table 50: India Battery Testing and Inspection Equipment Market Volume (K Unit) Forecast, by Application 2020 & 2033
- Table 51: Rest of Asia Pacific Battery Testing and Inspection Equipment Market Revenue (million) Forecast, by Application 2020 & 2033
- Table 52: Rest of Asia Pacific Battery Testing and Inspection Equipment Market Volume (K Unit) Forecast, by Application 2020 & 2033
- Table 53: Global Battery Testing and Inspection Equipment Market Revenue million Forecast, by Product Type 2020 & 2033
- Table 54: Global Battery Testing and Inspection Equipment Market Volume K Unit Forecast, by Product Type 2020 & 2033
- Table 55: Global Battery Testing and Inspection Equipment Market Revenue million Forecast, by Application Type 2020 & 2033
- Table 56: Global Battery Testing and Inspection Equipment Market Volume K Unit Forecast, by Application Type 2020 & 2033
- Table 57: Global Battery Testing and Inspection Equipment Market Revenue million Forecast, by End-user Industry 2020 & 2033
- Table 58: Global Battery Testing and Inspection Equipment Market Volume K Unit Forecast, by End-user Industry 2020 & 2033
- Table 59: Global Battery Testing and Inspection Equipment Market Revenue million Forecast, by Country 2020 & 2033
- Table 60: Global Battery Testing and Inspection Equipment Market Volume K Unit Forecast, by Country 2020 & 2033
- Table 61: Global Battery Testing and Inspection Equipment Market Revenue million Forecast, by Product Type 2020 & 2033
- Table 62: Global Battery Testing and Inspection Equipment Market Volume K Unit Forecast, by Product Type 2020 & 2033
- Table 63: Global Battery Testing and Inspection Equipment Market Revenue million Forecast, by Application Type 2020 & 2033
- Table 64: Global Battery Testing and Inspection Equipment Market Volume K Unit Forecast, by Application Type 2020 & 2033
- Table 65: Global Battery Testing and Inspection Equipment Market Revenue million Forecast, by End-user Industry 2020 & 2033
- Table 66: Global Battery Testing and Inspection Equipment Market Volume K Unit Forecast, by End-user Industry 2020 & 2033
- Table 67: Global Battery Testing and Inspection Equipment Market Revenue million Forecast, by Country 2020 & 2033
- Table 68: Global Battery Testing and Inspection Equipment Market Volume K Unit Forecast, by Country 2020 & 2033
Frequently Asked Questions
1. What is the projected Compound Annual Growth Rate (CAGR) of the Battery Testing and Inspection Equipment Market?
The projected CAGR is approximately 5.4%.
2. Which companies are prominent players in the Battery Testing and Inspection Equipment Market?
Key companies in the market include Neware Battery Testers, A&D Technology, Keysight Technologies, Midtronics Inc, Extech Instruments, Arbin Instruments, MTI Corporation, Chroma Systems Solutions Inc, Kikusui Electronics Corp, Heinzinger Electronic GmbH, Megger, Hioko USA.
3. What are the main segments of the Battery Testing and Inspection Equipment Market?
The market segments include Product Type, Application Type, End-user Industry.
4. Can you provide details about the market size?
The market size is estimated to be USD 634.31 million as of 2022.
5. What are some drivers contributing to market growth?
Government Regulations Related to Safety; Increasing Adoption of Battery Testing Equipment for Evs.
6. What are the notable trends driving market growth?
Automotive Industry to Hold Significant Market Share.
7. Are there any restraints impacting market growth?
Lack of Skilled and Trained Personnel.
8. Can you provide examples of recent developments in the market?
February 2022 - Hioki testing solutions contribute to battery production, development, and maintenance. Hioki announced launching three battery quality testers in the drive to eliminate battery fires. These three new measuring instruments can detect latent defects in quality inspections on battery production lines. The company aims to increase the safety of lithium-ion batteries, for which demand is growing globally.
9. What pricing options are available for accessing the report?
Pricing options include single-user, multi-user, and enterprise licenses priced at USD 4750, USD 5250, and USD 8750 respectively.
10. Is the market size provided in terms of value or volume?
The market size is provided in terms of value, measured in million and volume, measured in K Unit.
11. Are there any specific market keywords associated with the report?
Yes, the market keyword associated with the report is "Battery Testing and Inspection Equipment Market," which aids in identifying and referencing the specific market segment covered.
12. How do I determine which pricing option suits my needs best?
The pricing options vary based on user requirements and access needs. Individual users may opt for single-user licenses, while businesses requiring broader access may choose multi-user or enterprise licenses for cost-effective access to the report.
13. Are there any additional resources or data provided in the Battery Testing and Inspection Equipment Market report?
While the report offers comprehensive insights, it's advisable to review the specific contents or supplementary materials provided to ascertain if additional resources or data are available.
14. How can I stay updated on further developments or reports in the Battery Testing and Inspection Equipment Market?
To stay informed about further developments, trends, and reports in the Battery Testing and Inspection Equipment Market, consider subscribing to industry newsletters, following relevant companies and organizations, or regularly checking reputable industry news sources and publications.
Methodology
Step 1 - Identification of Relevant Samples Size from Population Database


Step 2 - Approaches for Defining Global Market Size (Value, Volume* & Price*)

Note*: In applicable scenarios
Step 3 - Data Sources
Primary Research
- Web Analytics
- Survey Reports
- Research Institute
- Latest Research Reports
- Opinion Leaders
Secondary Research
- Annual Reports
- White Paper
- Latest Press Release
- Industry Association
- Paid Database
- Investor Presentations

Step 4 - Data Triangulation
Involves using different sources of information in order to increase the validity of a study
These sources are likely to be stakeholders in a program - participants, other researchers, program staff, other community members, and so on.
Then we put all data in single framework & apply various statistical tools to find out the dynamic on the market.
During the analysis stage, feedback from the stakeholder groups would be compared to determine areas of agreement as well as areas of divergence