
Key Insights
The automotive valve guide market is experiencing robust growth, driven by the increasing demand for advanced internal combustion engines (ICEs) and the rising adoption of hybrid electric vehicles (HEVs). The market's expansion is fueled by several factors, including stringent emission regulations globally, pushing automakers to improve engine efficiency and reduce harmful emissions. This necessitates the use of high-performance valve guides capable of withstanding higher operating temperatures and pressures. Furthermore, the ongoing trend towards lightweighting vehicles to enhance fuel economy is creating demand for lighter and more durable valve guide materials, such as advanced ceramics and composites. While the market faced some headwinds during the recent global economic downturn and supply chain disruptions (2019-2024), it is projected to rebound strongly, exhibiting a Compound Annual Growth Rate (CAGR) of approximately 5% from 2025 to 2033. This growth is expected to be particularly pronounced in regions with rapidly expanding automotive production, such as Asia-Pacific.
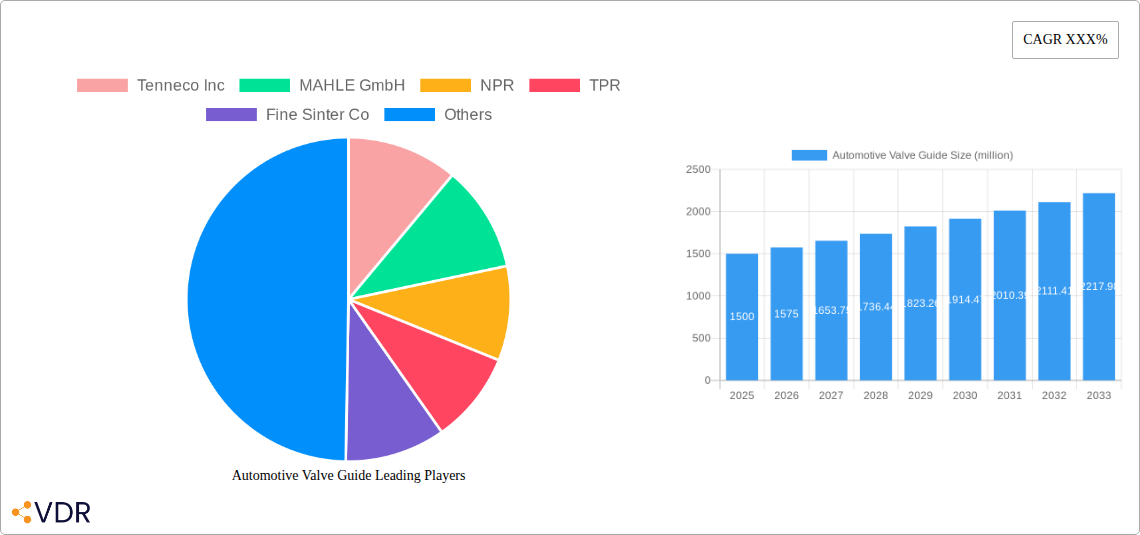
Key players in the market, including Tenneco Inc., MAHLE GmbH, NPR, TPR, Fine Sinter Co., Anhui Ring New Group, Anhui Jinyi New Material Corp, OM Internationals, and BLEISTAHL, are actively investing in research and development to create innovative valve guide designs and materials. Competition is intensifying, with companies focusing on providing customized solutions tailored to the specific needs of their automotive clients. The market is segmented by material type (e.g., cast iron, sintered bronze, steel), vehicle type (passenger cars, commercial vehicles), and region. The adoption of advanced manufacturing techniques, such as precision casting and powder metallurgy, is further contributing to improved valve guide performance and cost-effectiveness, driving market expansion. Potential restraints include fluctuations in raw material prices and the increasing adoption of electric vehicles (EVs), although the continued dominance of ICEs in many markets is expected to offset this somewhat in the foreseeable future.
Automotive Valve Guide Market Report: A Comprehensive Analysis (2019-2033)
This in-depth report provides a comprehensive analysis of the global Automotive Valve Guide market, covering market dynamics, growth trends, regional performance, product landscape, key players, and future outlook. With a study period spanning 2019-2033, a base year of 2025, and an estimated year of 2025, this report offers invaluable insights for industry professionals, investors, and strategic decision-makers. The report projects a market size of xx million units by 2033.
Automotive Valve Guide Market Dynamics & Structure
The Automotive Valve Guide market, a crucial component within the larger automotive engine parts market, exhibits a moderately consolidated structure. Key players like Tenneco Inc, MAHLE GmbH, NPR, and TPR hold significant market share, while regional players like Anhui Ring New Group and Anhui Jinyi New Material Corp contribute to the overall landscape. The market's dynamics are shaped by several factors:
- Technological Innovation: Continuous advancements in materials science (e.g., advanced ceramics, composites) drive improvements in valve guide durability, thermal resistance, and overall engine efficiency. This leads to a constant push for higher performance and longer lifespans.
- Regulatory Frameworks: Stringent emission regulations globally are influencing the demand for improved valve guide designs that enhance fuel efficiency and reduce emissions. This is particularly true in markets with strict environmental standards.
- Competitive Product Substitutes: While limited, alternative materials and designs are emerging, posing a subtle competitive pressure on traditional valve guide manufacturers. The market faces challenges in adapting to new technologies.
- End-User Demographics: The growth of the automotive industry, particularly in developing economies, directly impacts the demand for valve guides. Increased vehicle production fuels market expansion.
- M&A Trends: The industry has witnessed a moderate level of mergers and acquisitions (M&A) activity in recent years. This consolidation trend seeks to improve economies of scale and expand product portfolios. Approximately xx M&A deals were recorded between 2019 and 2024, resulting in a xx% market share shift among the top players. Innovation barriers, including high R&D costs and stringent quality control requirements, hinder the entry of new players.
Automotive Valve Guide Growth Trends & Insights
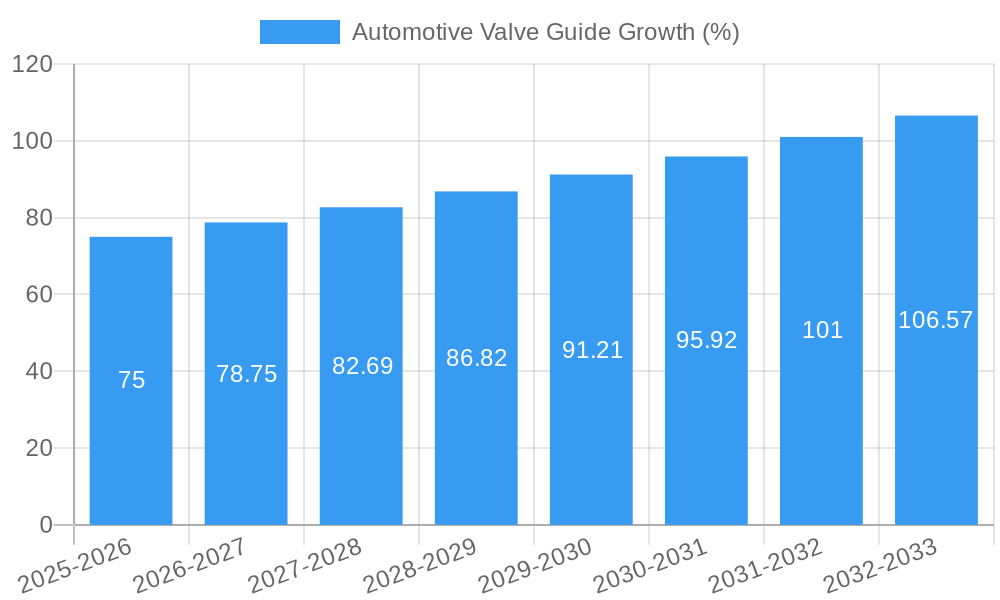
The Automotive Valve Guide market experienced a compound annual growth rate (CAGR) of xx% during the historical period (2019-2024). This growth is attributed to factors such as increasing vehicle production, rising demand for high-performance engines, and technological advancements leading to improved fuel efficiency and emission reduction. The market is projected to maintain a steady growth trajectory in the forecast period (2025-2033), with a projected CAGR of xx%. Market penetration in key regions is expected to reach xx% by 2033, driven by increasing vehicle ownership and the adoption of advanced engine technologies. Technological disruptions, including the rise of hybrid and electric vehicles, present both challenges and opportunities. While the immediate impact on demand might be moderate, long-term adaptation to these new powertrains will necessitate innovations in valve guide materials and designs. Consumer preferences for fuel-efficient vehicles further bolster market growth.
Dominant Regions, Countries, or Segments in Automotive Valve Guide
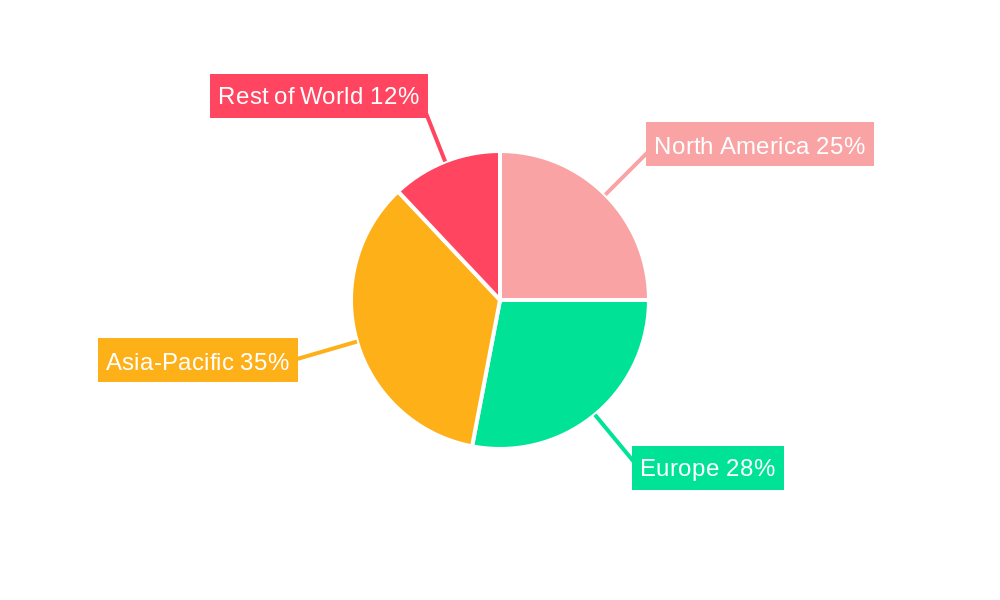
The Asia-Pacific region currently holds the largest market share for Automotive Valve Guides, driven primarily by the robust automotive manufacturing sector in China, India, and other Southeast Asian countries.
- Key Drivers in Asia-Pacific:
- Rapid economic growth and rising disposable incomes leading to increased vehicle ownership.
- Favorable government policies supporting the automotive industry.
- Expanding manufacturing capabilities and robust supply chains.
Europe and North America also hold significant market shares, though their growth rate is comparatively moderate due to market saturation and stricter emission regulations. However, technological advancements and innovations in engine technology continue to create growth opportunities within these regions. The dominance of the Asia-Pacific region is primarily attributed to its large-scale automotive production, coupled with relatively lower manufacturing costs compared to other regions. The region's potential for future growth remains substantial, fueled by ongoing infrastructural development and expanding automotive markets in emerging economies.
Automotive Valve Guide Product Landscape
Automotive valve guides are primarily made from materials like cast iron, steel, and bronze alloys, each with unique properties suited to specific engine applications. Recent innovations focus on improving wear resistance, thermal conductivity, and overall durability. Advanced materials like sintered metal and ceramics are being increasingly adopted to meet the demands of high-performance and fuel-efficient engines. The industry focuses on enhancing product performance metrics such as friction reduction, heat dissipation, and overall service life. Unique selling propositions increasingly revolve around reduced emissions, longer lifespan, and enhanced engine performance.
Key Drivers, Barriers & Challenges in Automotive Valve Guide
Key Drivers: Increasing automotive production, particularly in developing nations; stringent emission regulations globally pushing for improved engine efficiency; advancements in materials science leading to superior performance.
Challenges: Intense competition from established players; supply chain disruptions; fluctuations in raw material prices; high R&D costs associated with developing new materials and designs; maintaining consistent quality standards across large production volumes. These challenges impact profitability and necessitate continuous improvement in manufacturing processes and supply chain management.
Emerging Opportunities in Automotive Valve Guide
Emerging opportunities lie in the development of lightweight valve guides for fuel-efficient vehicles, exploration of innovative materials like advanced ceramics and composites, and expansion into the growing market for hybrid and electric vehicles, which, while currently less impactful, will require adapted designs in the long term. Untapped markets in developing regions also represent a significant growth potential.
Growth Accelerators in the Automotive Valve Guide Industry
Strategic partnerships among manufacturers, material suppliers, and automotive OEMs will play a crucial role in accelerating growth. Technological breakthroughs in materials science, leading to enhanced performance and durability of valve guides, are essential. Furthermore, market expansion into regions with burgeoning automotive industries will contribute significantly to overall market expansion.
Key Players Shaping the Automotive Valve Guide Market
- Tenneco Inc
- MAHLE GmbH
- NPR
- TPR
- Fine Sinter Co
- Anhui Ring New Group
- Anhui Jinyi New Material Corp
- OM Internationals
- BLEISTAHL
Notable Milestones in Automotive Valve Guide Sector
- 2021: Introduction of a new sintered metal valve guide by MAHLE, significantly improving wear resistance.
- 2022: Joint venture between Tenneco and a major automotive OEM to develop lightweight valve guides for hybrid vehicles.
- 2023: Acquisition of a smaller valve guide manufacturer by NPR, expanding its product portfolio.
In-Depth Automotive Valve Guide Market Outlook
The Automotive Valve Guide market is poised for robust growth driven by continuous technological innovation, expanding automotive production, and the need for fuel-efficient and environmentally friendly vehicles. Strategic investments in R&D, strategic partnerships, and market expansion into developing economies will shape future market dynamics. Opportunities exist in exploring new materials, designing valve guides for advanced engine technologies, and capitalizing on growing demand in emerging markets. The market's long-term potential is strong, with further consolidation and innovation expected in the coming years.
Automotive Valve Guide Segmentation
-
1. Application
- 1.1. Passenger Car
- 1.2. Commercial Vehicle
-
2. Type
- 2.1. Gasoline Engine Valve Guide
- 2.2. Diesel Engine Valve Guide
Automotive Valve Guide Segmentation By Geography
-
1. North America
- 1.1. United States
- 1.2. Canada
- 1.3. Mexico
-
2. South America
- 2.1. Brazil
- 2.2. Argentina
- 2.3. Rest of South America
-
3. Europe
- 3.1. United Kingdom
- 3.2. Germany
- 3.3. France
- 3.4. Italy
- 3.5. Spain
- 3.6. Russia
- 3.7. Benelux
- 3.8. Nordics
- 3.9. Rest of Europe
-
4. Middle East & Africa
- 4.1. Turkey
- 4.2. Israel
- 4.3. GCC
- 4.4. North Africa
- 4.5. South Africa
- 4.6. Rest of Middle East & Africa
-
5. Asia Pacific
- 5.1. China
- 5.2. India
- 5.3. Japan
- 5.4. South Korea
- 5.5. ASEAN
- 5.6. Oceania
- 5.7. Rest of Asia Pacific
Automotive Valve Guide REPORT HIGHLIGHTS
| Aspects | Details |
|---|---|
| Study Period | 2019-2033 |
| Base Year | 2024 |
| Estimated Year | 2025 |
| Forecast Period | 2025-2033 |
| Historical Period | 2019-2024 |
| Growth Rate | CAGR of XXX% from 2019-2033 |
| Segmentation |
|
Table of Contents
- 1. Introduction
- 1.1. Research Scope
- 1.2. Market Segmentation
- 1.3. Research Methodology
- 1.4. Definitions and Assumptions
- 2. Executive Summary
- 2.1. Introduction
- 3. Market Dynamics
- 3.1. Introduction
- 3.2. Market Drivers
- 3.3. Market Restrains
- 3.4. Market Trends
- 4. Market Factor Analysis
- 4.1. Porters Five Forces
- 4.2. Supply/Value Chain
- 4.3. PESTEL analysis
- 4.4. Market Entropy
- 4.5. Patent/Trademark Analysis
- 5. Global Automotive Valve Guide Analysis, Insights and Forecast, 2019-2031
- 5.1. Market Analysis, Insights and Forecast - by Application
- 5.1.1. Passenger Car
- 5.1.2. Commercial Vehicle
- 5.2. Market Analysis, Insights and Forecast - by Type
- 5.2.1. Gasoline Engine Valve Guide
- 5.2.2. Diesel Engine Valve Guide
- 5.3. Market Analysis, Insights and Forecast - by Region
- 5.3.1. North America
- 5.3.2. South America
- 5.3.3. Europe
- 5.3.4. Middle East & Africa
- 5.3.5. Asia Pacific
- 5.1. Market Analysis, Insights and Forecast - by Application
- 6. North America Automotive Valve Guide Analysis, Insights and Forecast, 2019-2031
- 6.1. Market Analysis, Insights and Forecast - by Application
- 6.1.1. Passenger Car
- 6.1.2. Commercial Vehicle
- 6.2. Market Analysis, Insights and Forecast - by Type
- 6.2.1. Gasoline Engine Valve Guide
- 6.2.2. Diesel Engine Valve Guide
- 6.1. Market Analysis, Insights and Forecast - by Application
- 7. South America Automotive Valve Guide Analysis, Insights and Forecast, 2019-2031
- 7.1. Market Analysis, Insights and Forecast - by Application
- 7.1.1. Passenger Car
- 7.1.2. Commercial Vehicle
- 7.2. Market Analysis, Insights and Forecast - by Type
- 7.2.1. Gasoline Engine Valve Guide
- 7.2.2. Diesel Engine Valve Guide
- 7.1. Market Analysis, Insights and Forecast - by Application
- 8. Europe Automotive Valve Guide Analysis, Insights and Forecast, 2019-2031
- 8.1. Market Analysis, Insights and Forecast - by Application
- 8.1.1. Passenger Car
- 8.1.2. Commercial Vehicle
- 8.2. Market Analysis, Insights and Forecast - by Type
- 8.2.1. Gasoline Engine Valve Guide
- 8.2.2. Diesel Engine Valve Guide
- 8.1. Market Analysis, Insights and Forecast - by Application
- 9. Middle East & Africa Automotive Valve Guide Analysis, Insights and Forecast, 2019-2031
- 9.1. Market Analysis, Insights and Forecast - by Application
- 9.1.1. Passenger Car
- 9.1.2. Commercial Vehicle
- 9.2. Market Analysis, Insights and Forecast - by Type
- 9.2.1. Gasoline Engine Valve Guide
- 9.2.2. Diesel Engine Valve Guide
- 9.1. Market Analysis, Insights and Forecast - by Application
- 10. Asia Pacific Automotive Valve Guide Analysis, Insights and Forecast, 2019-2031
- 10.1. Market Analysis, Insights and Forecast - by Application
- 10.1.1. Passenger Car
- 10.1.2. Commercial Vehicle
- 10.2. Market Analysis, Insights and Forecast - by Type
- 10.2.1. Gasoline Engine Valve Guide
- 10.2.2. Diesel Engine Valve Guide
- 10.1. Market Analysis, Insights and Forecast - by Application
- 11. Competitive Analysis
- 11.1. Global Market Share Analysis 2024
- 11.2. Company Profiles
- 11.2.1 Tenneco Inc
- 11.2.1.1. Overview
- 11.2.1.2. Products
- 11.2.1.3. SWOT Analysis
- 11.2.1.4. Recent Developments
- 11.2.1.5. Financials (Based on Availability)
- 11.2.2 MAHLE GmbH
- 11.2.2.1. Overview
- 11.2.2.2. Products
- 11.2.2.3. SWOT Analysis
- 11.2.2.4. Recent Developments
- 11.2.2.5. Financials (Based on Availability)
- 11.2.3 NPR
- 11.2.3.1. Overview
- 11.2.3.2. Products
- 11.2.3.3. SWOT Analysis
- 11.2.3.4. Recent Developments
- 11.2.3.5. Financials (Based on Availability)
- 11.2.4 TPR
- 11.2.4.1. Overview
- 11.2.4.2. Products
- 11.2.4.3. SWOT Analysis
- 11.2.4.4. Recent Developments
- 11.2.4.5. Financials (Based on Availability)
- 11.2.5 Fine Sinter Co
- 11.2.5.1. Overview
- 11.2.5.2. Products
- 11.2.5.3. SWOT Analysis
- 11.2.5.4. Recent Developments
- 11.2.5.5. Financials (Based on Availability)
- 11.2.6 Anhui Ring New Group
- 11.2.6.1. Overview
- 11.2.6.2. Products
- 11.2.6.3. SWOT Analysis
- 11.2.6.4. Recent Developments
- 11.2.6.5. Financials (Based on Availability)
- 11.2.7 Anhui Jinyi New Material Corp
- 11.2.7.1. Overview
- 11.2.7.2. Products
- 11.2.7.3. SWOT Analysis
- 11.2.7.4. Recent Developments
- 11.2.7.5. Financials (Based on Availability)
- 11.2.8 OM Internationals
- 11.2.8.1. Overview
- 11.2.8.2. Products
- 11.2.8.3. SWOT Analysis
- 11.2.8.4. Recent Developments
- 11.2.8.5. Financials (Based on Availability)
- 11.2.9 BLEISTAHL
- 11.2.9.1. Overview
- 11.2.9.2. Products
- 11.2.9.3. SWOT Analysis
- 11.2.9.4. Recent Developments
- 11.2.9.5. Financials (Based on Availability)
- 11.2.1 Tenneco Inc
List of Figures
- Figure 1: Global Automotive Valve Guide Revenue Breakdown (million, %) by Region 2024 & 2032
- Figure 2: Global Automotive Valve Guide Volume Breakdown (K, %) by Region 2024 & 2032
- Figure 3: North America Automotive Valve Guide Revenue (million), by Application 2024 & 2032
- Figure 4: North America Automotive Valve Guide Volume (K), by Application 2024 & 2032
- Figure 5: North America Automotive Valve Guide Revenue Share (%), by Application 2024 & 2032
- Figure 6: North America Automotive Valve Guide Volume Share (%), by Application 2024 & 2032
- Figure 7: North America Automotive Valve Guide Revenue (million), by Type 2024 & 2032
- Figure 8: North America Automotive Valve Guide Volume (K), by Type 2024 & 2032
- Figure 9: North America Automotive Valve Guide Revenue Share (%), by Type 2024 & 2032
- Figure 10: North America Automotive Valve Guide Volume Share (%), by Type 2024 & 2032
- Figure 11: North America Automotive Valve Guide Revenue (million), by Country 2024 & 2032
- Figure 12: North America Automotive Valve Guide Volume (K), by Country 2024 & 2032
- Figure 13: North America Automotive Valve Guide Revenue Share (%), by Country 2024 & 2032
- Figure 14: North America Automotive Valve Guide Volume Share (%), by Country 2024 & 2032
- Figure 15: South America Automotive Valve Guide Revenue (million), by Application 2024 & 2032
- Figure 16: South America Automotive Valve Guide Volume (K), by Application 2024 & 2032
- Figure 17: South America Automotive Valve Guide Revenue Share (%), by Application 2024 & 2032
- Figure 18: South America Automotive Valve Guide Volume Share (%), by Application 2024 & 2032
- Figure 19: South America Automotive Valve Guide Revenue (million), by Type 2024 & 2032
- Figure 20: South America Automotive Valve Guide Volume (K), by Type 2024 & 2032
- Figure 21: South America Automotive Valve Guide Revenue Share (%), by Type 2024 & 2032
- Figure 22: South America Automotive Valve Guide Volume Share (%), by Type 2024 & 2032
- Figure 23: South America Automotive Valve Guide Revenue (million), by Country 2024 & 2032
- Figure 24: South America Automotive Valve Guide Volume (K), by Country 2024 & 2032
- Figure 25: South America Automotive Valve Guide Revenue Share (%), by Country 2024 & 2032
- Figure 26: South America Automotive Valve Guide Volume Share (%), by Country 2024 & 2032
- Figure 27: Europe Automotive Valve Guide Revenue (million), by Application 2024 & 2032
- Figure 28: Europe Automotive Valve Guide Volume (K), by Application 2024 & 2032
- Figure 29: Europe Automotive Valve Guide Revenue Share (%), by Application 2024 & 2032
- Figure 30: Europe Automotive Valve Guide Volume Share (%), by Application 2024 & 2032
- Figure 31: Europe Automotive Valve Guide Revenue (million), by Type 2024 & 2032
- Figure 32: Europe Automotive Valve Guide Volume (K), by Type 2024 & 2032
- Figure 33: Europe Automotive Valve Guide Revenue Share (%), by Type 2024 & 2032
- Figure 34: Europe Automotive Valve Guide Volume Share (%), by Type 2024 & 2032
- Figure 35: Europe Automotive Valve Guide Revenue (million), by Country 2024 & 2032
- Figure 36: Europe Automotive Valve Guide Volume (K), by Country 2024 & 2032
- Figure 37: Europe Automotive Valve Guide Revenue Share (%), by Country 2024 & 2032
- Figure 38: Europe Automotive Valve Guide Volume Share (%), by Country 2024 & 2032
- Figure 39: Middle East & Africa Automotive Valve Guide Revenue (million), by Application 2024 & 2032
- Figure 40: Middle East & Africa Automotive Valve Guide Volume (K), by Application 2024 & 2032
- Figure 41: Middle East & Africa Automotive Valve Guide Revenue Share (%), by Application 2024 & 2032
- Figure 42: Middle East & Africa Automotive Valve Guide Volume Share (%), by Application 2024 & 2032
- Figure 43: Middle East & Africa Automotive Valve Guide Revenue (million), by Type 2024 & 2032
- Figure 44: Middle East & Africa Automotive Valve Guide Volume (K), by Type 2024 & 2032
- Figure 45: Middle East & Africa Automotive Valve Guide Revenue Share (%), by Type 2024 & 2032
- Figure 46: Middle East & Africa Automotive Valve Guide Volume Share (%), by Type 2024 & 2032
- Figure 47: Middle East & Africa Automotive Valve Guide Revenue (million), by Country 2024 & 2032
- Figure 48: Middle East & Africa Automotive Valve Guide Volume (K), by Country 2024 & 2032
- Figure 49: Middle East & Africa Automotive Valve Guide Revenue Share (%), by Country 2024 & 2032
- Figure 50: Middle East & Africa Automotive Valve Guide Volume Share (%), by Country 2024 & 2032
- Figure 51: Asia Pacific Automotive Valve Guide Revenue (million), by Application 2024 & 2032
- Figure 52: Asia Pacific Automotive Valve Guide Volume (K), by Application 2024 & 2032
- Figure 53: Asia Pacific Automotive Valve Guide Revenue Share (%), by Application 2024 & 2032
- Figure 54: Asia Pacific Automotive Valve Guide Volume Share (%), by Application 2024 & 2032
- Figure 55: Asia Pacific Automotive Valve Guide Revenue (million), by Type 2024 & 2032
- Figure 56: Asia Pacific Automotive Valve Guide Volume (K), by Type 2024 & 2032
- Figure 57: Asia Pacific Automotive Valve Guide Revenue Share (%), by Type 2024 & 2032
- Figure 58: Asia Pacific Automotive Valve Guide Volume Share (%), by Type 2024 & 2032
- Figure 59: Asia Pacific Automotive Valve Guide Revenue (million), by Country 2024 & 2032
- Figure 60: Asia Pacific Automotive Valve Guide Volume (K), by Country 2024 & 2032
- Figure 61: Asia Pacific Automotive Valve Guide Revenue Share (%), by Country 2024 & 2032
- Figure 62: Asia Pacific Automotive Valve Guide Volume Share (%), by Country 2024 & 2032
List of Tables
- Table 1: Global Automotive Valve Guide Revenue million Forecast, by Region 2019 & 2032
- Table 2: Global Automotive Valve Guide Volume K Forecast, by Region 2019 & 2032
- Table 3: Global Automotive Valve Guide Revenue million Forecast, by Application 2019 & 2032
- Table 4: Global Automotive Valve Guide Volume K Forecast, by Application 2019 & 2032
- Table 5: Global Automotive Valve Guide Revenue million Forecast, by Type 2019 & 2032
- Table 6: Global Automotive Valve Guide Volume K Forecast, by Type 2019 & 2032
- Table 7: Global Automotive Valve Guide Revenue million Forecast, by Region 2019 & 2032
- Table 8: Global Automotive Valve Guide Volume K Forecast, by Region 2019 & 2032
- Table 9: Global Automotive Valve Guide Revenue million Forecast, by Application 2019 & 2032
- Table 10: Global Automotive Valve Guide Volume K Forecast, by Application 2019 & 2032
- Table 11: Global Automotive Valve Guide Revenue million Forecast, by Type 2019 & 2032
- Table 12: Global Automotive Valve Guide Volume K Forecast, by Type 2019 & 2032
- Table 13: Global Automotive Valve Guide Revenue million Forecast, by Country 2019 & 2032
- Table 14: Global Automotive Valve Guide Volume K Forecast, by Country 2019 & 2032
- Table 15: United States Automotive Valve Guide Revenue (million) Forecast, by Application 2019 & 2032
- Table 16: United States Automotive Valve Guide Volume (K) Forecast, by Application 2019 & 2032
- Table 17: Canada Automotive Valve Guide Revenue (million) Forecast, by Application 2019 & 2032
- Table 18: Canada Automotive Valve Guide Volume (K) Forecast, by Application 2019 & 2032
- Table 19: Mexico Automotive Valve Guide Revenue (million) Forecast, by Application 2019 & 2032
- Table 20: Mexico Automotive Valve Guide Volume (K) Forecast, by Application 2019 & 2032
- Table 21: Global Automotive Valve Guide Revenue million Forecast, by Application 2019 & 2032
- Table 22: Global Automotive Valve Guide Volume K Forecast, by Application 2019 & 2032
- Table 23: Global Automotive Valve Guide Revenue million Forecast, by Type 2019 & 2032
- Table 24: Global Automotive Valve Guide Volume K Forecast, by Type 2019 & 2032
- Table 25: Global Automotive Valve Guide Revenue million Forecast, by Country 2019 & 2032
- Table 26: Global Automotive Valve Guide Volume K Forecast, by Country 2019 & 2032
- Table 27: Brazil Automotive Valve Guide Revenue (million) Forecast, by Application 2019 & 2032
- Table 28: Brazil Automotive Valve Guide Volume (K) Forecast, by Application 2019 & 2032
- Table 29: Argentina Automotive Valve Guide Revenue (million) Forecast, by Application 2019 & 2032
- Table 30: Argentina Automotive Valve Guide Volume (K) Forecast, by Application 2019 & 2032
- Table 31: Rest of South America Automotive Valve Guide Revenue (million) Forecast, by Application 2019 & 2032
- Table 32: Rest of South America Automotive Valve Guide Volume (K) Forecast, by Application 2019 & 2032
- Table 33: Global Automotive Valve Guide Revenue million Forecast, by Application 2019 & 2032
- Table 34: Global Automotive Valve Guide Volume K Forecast, by Application 2019 & 2032
- Table 35: Global Automotive Valve Guide Revenue million Forecast, by Type 2019 & 2032
- Table 36: Global Automotive Valve Guide Volume K Forecast, by Type 2019 & 2032
- Table 37: Global Automotive Valve Guide Revenue million Forecast, by Country 2019 & 2032
- Table 38: Global Automotive Valve Guide Volume K Forecast, by Country 2019 & 2032
- Table 39: United Kingdom Automotive Valve Guide Revenue (million) Forecast, by Application 2019 & 2032
- Table 40: United Kingdom Automotive Valve Guide Volume (K) Forecast, by Application 2019 & 2032
- Table 41: Germany Automotive Valve Guide Revenue (million) Forecast, by Application 2019 & 2032
- Table 42: Germany Automotive Valve Guide Volume (K) Forecast, by Application 2019 & 2032
- Table 43: France Automotive Valve Guide Revenue (million) Forecast, by Application 2019 & 2032
- Table 44: France Automotive Valve Guide Volume (K) Forecast, by Application 2019 & 2032
- Table 45: Italy Automotive Valve Guide Revenue (million) Forecast, by Application 2019 & 2032
- Table 46: Italy Automotive Valve Guide Volume (K) Forecast, by Application 2019 & 2032
- Table 47: Spain Automotive Valve Guide Revenue (million) Forecast, by Application 2019 & 2032
- Table 48: Spain Automotive Valve Guide Volume (K) Forecast, by Application 2019 & 2032
- Table 49: Russia Automotive Valve Guide Revenue (million) Forecast, by Application 2019 & 2032
- Table 50: Russia Automotive Valve Guide Volume (K) Forecast, by Application 2019 & 2032
- Table 51: Benelux Automotive Valve Guide Revenue (million) Forecast, by Application 2019 & 2032
- Table 52: Benelux Automotive Valve Guide Volume (K) Forecast, by Application 2019 & 2032
- Table 53: Nordics Automotive Valve Guide Revenue (million) Forecast, by Application 2019 & 2032
- Table 54: Nordics Automotive Valve Guide Volume (K) Forecast, by Application 2019 & 2032
- Table 55: Rest of Europe Automotive Valve Guide Revenue (million) Forecast, by Application 2019 & 2032
- Table 56: Rest of Europe Automotive Valve Guide Volume (K) Forecast, by Application 2019 & 2032
- Table 57: Global Automotive Valve Guide Revenue million Forecast, by Application 2019 & 2032
- Table 58: Global Automotive Valve Guide Volume K Forecast, by Application 2019 & 2032
- Table 59: Global Automotive Valve Guide Revenue million Forecast, by Type 2019 & 2032
- Table 60: Global Automotive Valve Guide Volume K Forecast, by Type 2019 & 2032
- Table 61: Global Automotive Valve Guide Revenue million Forecast, by Country 2019 & 2032
- Table 62: Global Automotive Valve Guide Volume K Forecast, by Country 2019 & 2032
- Table 63: Turkey Automotive Valve Guide Revenue (million) Forecast, by Application 2019 & 2032
- Table 64: Turkey Automotive Valve Guide Volume (K) Forecast, by Application 2019 & 2032
- Table 65: Israel Automotive Valve Guide Revenue (million) Forecast, by Application 2019 & 2032
- Table 66: Israel Automotive Valve Guide Volume (K) Forecast, by Application 2019 & 2032
- Table 67: GCC Automotive Valve Guide Revenue (million) Forecast, by Application 2019 & 2032
- Table 68: GCC Automotive Valve Guide Volume (K) Forecast, by Application 2019 & 2032
- Table 69: North Africa Automotive Valve Guide Revenue (million) Forecast, by Application 2019 & 2032
- Table 70: North Africa Automotive Valve Guide Volume (K) Forecast, by Application 2019 & 2032
- Table 71: South Africa Automotive Valve Guide Revenue (million) Forecast, by Application 2019 & 2032
- Table 72: South Africa Automotive Valve Guide Volume (K) Forecast, by Application 2019 & 2032
- Table 73: Rest of Middle East & Africa Automotive Valve Guide Revenue (million) Forecast, by Application 2019 & 2032
- Table 74: Rest of Middle East & Africa Automotive Valve Guide Volume (K) Forecast, by Application 2019 & 2032
- Table 75: Global Automotive Valve Guide Revenue million Forecast, by Application 2019 & 2032
- Table 76: Global Automotive Valve Guide Volume K Forecast, by Application 2019 & 2032
- Table 77: Global Automotive Valve Guide Revenue million Forecast, by Type 2019 & 2032
- Table 78: Global Automotive Valve Guide Volume K Forecast, by Type 2019 & 2032
- Table 79: Global Automotive Valve Guide Revenue million Forecast, by Country 2019 & 2032
- Table 80: Global Automotive Valve Guide Volume K Forecast, by Country 2019 & 2032
- Table 81: China Automotive Valve Guide Revenue (million) Forecast, by Application 2019 & 2032
- Table 82: China Automotive Valve Guide Volume (K) Forecast, by Application 2019 & 2032
- Table 83: India Automotive Valve Guide Revenue (million) Forecast, by Application 2019 & 2032
- Table 84: India Automotive Valve Guide Volume (K) Forecast, by Application 2019 & 2032
- Table 85: Japan Automotive Valve Guide Revenue (million) Forecast, by Application 2019 & 2032
- Table 86: Japan Automotive Valve Guide Volume (K) Forecast, by Application 2019 & 2032
- Table 87: South Korea Automotive Valve Guide Revenue (million) Forecast, by Application 2019 & 2032
- Table 88: South Korea Automotive Valve Guide Volume (K) Forecast, by Application 2019 & 2032
- Table 89: ASEAN Automotive Valve Guide Revenue (million) Forecast, by Application 2019 & 2032
- Table 90: ASEAN Automotive Valve Guide Volume (K) Forecast, by Application 2019 & 2032
- Table 91: Oceania Automotive Valve Guide Revenue (million) Forecast, by Application 2019 & 2032
- Table 92: Oceania Automotive Valve Guide Volume (K) Forecast, by Application 2019 & 2032
- Table 93: Rest of Asia Pacific Automotive Valve Guide Revenue (million) Forecast, by Application 2019 & 2032
- Table 94: Rest of Asia Pacific Automotive Valve Guide Volume (K) Forecast, by Application 2019 & 2032
Frequently Asked Questions
1. What is the projected Compound Annual Growth Rate (CAGR) of the Automotive Valve Guide?
The projected CAGR is approximately XXX%.
2. Which companies are prominent players in the Automotive Valve Guide?
Key companies in the market include Tenneco Inc, MAHLE GmbH, NPR, TPR, Fine Sinter Co, Anhui Ring New Group, Anhui Jinyi New Material Corp, OM Internationals, BLEISTAHL.
3. What are the main segments of the Automotive Valve Guide?
The market segments include Application, Type.
4. Can you provide details about the market size?
The market size is estimated to be USD XXX million as of 2022.
5. What are some drivers contributing to market growth?
N/A
6. What are the notable trends driving market growth?
N/A
7. Are there any restraints impacting market growth?
N/A
8. Can you provide examples of recent developments in the market?
N/A
9. What pricing options are available for accessing the report?
Pricing options include single-user, multi-user, and enterprise licenses priced at USD 3950.00, USD 5925.00, and USD 7900.00 respectively.
10. Is the market size provided in terms of value or volume?
The market size is provided in terms of value, measured in million and volume, measured in K.
11. Are there any specific market keywords associated with the report?
Yes, the market keyword associated with the report is "Automotive Valve Guide," which aids in identifying and referencing the specific market segment covered.
12. How do I determine which pricing option suits my needs best?
The pricing options vary based on user requirements and access needs. Individual users may opt for single-user licenses, while businesses requiring broader access may choose multi-user or enterprise licenses for cost-effective access to the report.
13. Are there any additional resources or data provided in the Automotive Valve Guide report?
While the report offers comprehensive insights, it's advisable to review the specific contents or supplementary materials provided to ascertain if additional resources or data are available.
14. How can I stay updated on further developments or reports in the Automotive Valve Guide?
To stay informed about further developments, trends, and reports in the Automotive Valve Guide, consider subscribing to industry newsletters, following relevant companies and organizations, or regularly checking reputable industry news sources and publications.
Methodology
Step 1 - Identification of Relevant Samples Size from Population Database


Step 2 - Approaches for Defining Global Market Size (Value, Volume* & Price*)

Note*: In applicable scenarios
Step 3 - Data Sources
Primary Research
- Web Analytics
- Survey Reports
- Research Institute
- Latest Research Reports
- Opinion Leaders
Secondary Research
- Annual Reports
- White Paper
- Latest Press Release
- Industry Association
- Paid Database
- Investor Presentations

Step 4 - Data Triangulation
Involves using different sources of information in order to increase the validity of a study
These sources are likely to be stakeholders in a program - participants, other researchers, program staff, other community members, and so on.
Then we put all data in single framework & apply various statistical tools to find out the dynamic on the market.
During the analysis stage, feedback from the stakeholder groups would be compared to determine areas of agreement as well as areas of divergence


