

Key Insights
The global market for vehicles designed for individuals with disabilities is poised for substantial growth, projecting a Compound Annual Growth Rate (CAGR) of 11.8%. This expansion, anticipated from 2022 to 2033, is driven by a confluence of factors including an aging global population, increasing prevalence of mobility impairments, and significant technological advancements such as advanced driver-assistance systems (ADAS) and enhanced wheelchair accessibility features. Supportive government regulations and initiatives promoting inclusivity further fuel this market trajectory. The market is segmented by vehicle type (two-wheelers and four-wheelers), driving options (swivel seats, wheelchair accessibility, and standard seating), and entry configurations (side and rear entry). North America, led by the United States, currently dominates due to high disposable incomes and a mature accessible vehicle infrastructure. However, Asia-Pacific, particularly India and China, presents significant emerging growth opportunities driven by rising awareness and accessibility initiatives.
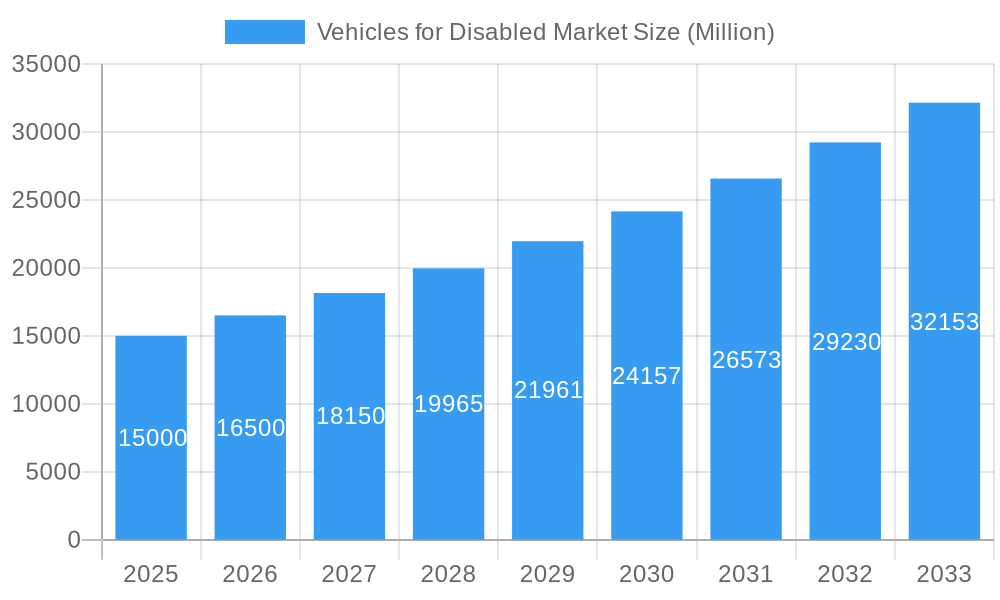
Vehicles for Disabled Market Market Size (In Billion)
The forecast period of 2022-2033 anticipates sustained market expansion, propelled by growing consumer awareness, technological innovations, and favorable government policies. A notable trend is the anticipated shift towards electric and hybrid vehicles, aligning with global sustainability objectives. The integration of smart technologies, including telematics and connected car features, will enhance safety and convenience. A key focus is the development of personalized solutions, with customization options becoming increasingly prevalent to meet diverse individual needs. Companies are prioritizing the enhancement of both functionality and aesthetics to improve user experience and address specific mobility challenges. Regional growth dynamics will be influenced by economic development, healthcare infrastructure, and government support.
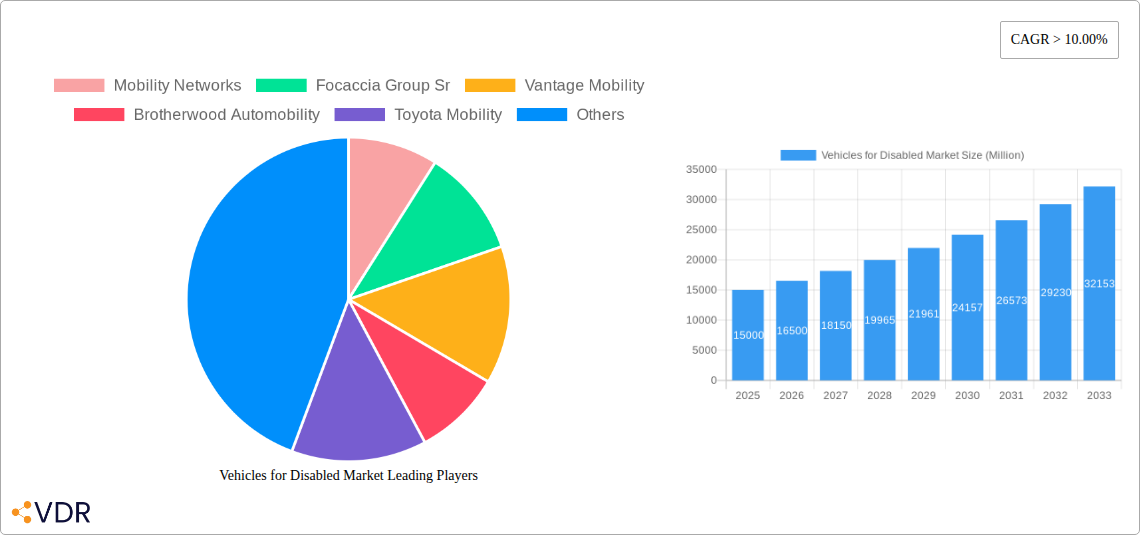
Vehicles for Disabled Market Company Market Share
Market Size: $2.9 billion (Base Year: 2022)
Vehicles for Disabled Market: A Comprehensive Report (2019-2033)
This in-depth report provides a comprehensive analysis of the Vehicles for Disabled Market, encompassing market dynamics, growth trends, regional performance, product landscape, key players, and future outlook. The study covers the period 2019-2033, with a focus on the forecast period 2025-2033, using 2025 as the base and estimated year. The report segments the market by vehicle type (two-wheeler, four-wheeler), driving option (swivel seat, wheelchair, normal seat), and entry configuration (side entry, rear entry), offering granular insights into each segment's performance and growth potential. The total market size is projected to reach xx Million units by 2033.
Vehicles for Disabled Market Market Dynamics & Structure
The Vehicles for Disabled market is characterized by moderate concentration, with key players like Mobility Networks, Focaccia Group Sr, and Vantage Mobility holding significant market share. Technological innovation, particularly in assistive technologies and autonomous driving, is a major driver, while regulatory frameworks concerning vehicle accessibility and safety standards significantly influence market growth. The market faces competition from adapted conventional vehicles, and the emergence of shared mobility services presents both opportunities and challenges. M&A activity has been relatively low in recent years (xx deals between 2019-2024), but consolidation is anticipated as the market matures. End-user demographics, primarily aging populations and individuals with disabilities, are crucial in shaping market demand.
- Market Concentration: Moderately concentrated, with top 5 players holding approximately xx% market share in 2025.
- Technological Innovation: Focus on advanced driver-assistance systems (ADAS), autonomous features, and improved wheelchair accessibility.
- Regulatory Frameworks: Stringent safety and accessibility standards vary across regions, impacting product development and market entry.
- Competitive Substitutes: Adapted conventional vehicles and shared mobility services pose competition.
- End-User Demographics: Aging populations and rising disability rates fuel market demand.
- M&A Trends: Low activity (xx deals 2019-2024), but potential for increased consolidation in the forecast period.
Vehicles for Disabled Market Growth Trends & Insights
The Vehicles for Disabled market experienced steady growth during the historical period (2019-2024), with a CAGR of xx%. This growth is attributed to factors such as increasing awareness of accessibility needs, technological advancements, and supportive government policies in various regions. Market penetration is currently at xx% in developed countries and significantly lower in developing nations. Technological disruptions, including the integration of electric powertrains and autonomous driving features, are expected to accelerate market expansion. Consumer behavior shifts towards prioritizing accessibility and personalized solutions further drive market growth. The projected CAGR for 2025-2033 is xx%, leading to a market size of xx Million units by 2033.
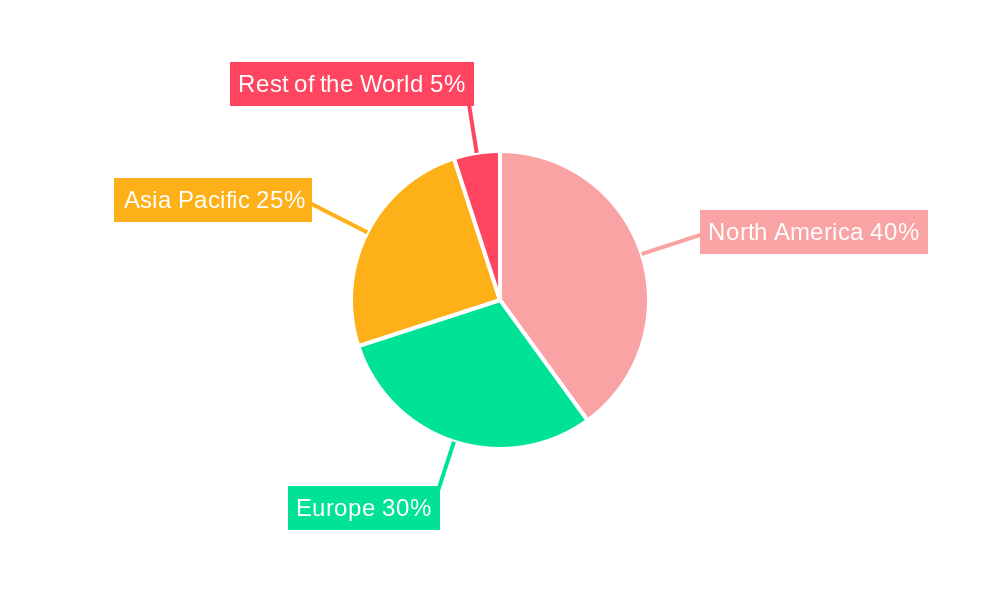
Dominant Regions, Countries, or Segments in Vehicles for Disabled Market
North America currently dominates the Vehicles for Disabled market, driven by high disposable income, robust healthcare infrastructure, and established accessibility regulations. Within this region, the United States holds the largest market share. The four-wheeler segment accounts for the largest portion of the market (xx%), followed by the two-wheeler segment (xx%). The swivel seat driving option maintains a strong lead (xx%) due to its convenience and suitability for a broad range of disabilities. Side entry vehicles also dominate (xx%) due to ease of access. Europe and Asia-Pacific are expected to witness significant growth in the forecast period due to increasing awareness, improving infrastructure, and supportive government initiatives.
- North America Dominance: Driven by high disposable income, robust healthcare, and stringent regulations.
- Four-Wheeler Segment Leadership: Largest market share due to superior comfort and safety.
- Swivel Seat Popularity: High preference due to ease of use and adaptability.
- Side Entry Configuration Preference: Highest market share due to ease of ingress and egress.
- Growth in Europe & Asia-Pacific: Driven by increasing awareness, improving infrastructure, and supportive government policies.
Vehicles for Disabled Market Product Landscape
The Vehicles for Disabled market offers a range of vehicles tailored to specific needs, from basic modifications to highly sophisticated vehicles with advanced assistive technologies. Product innovations focus on enhanced safety features, improved accessibility, and integration of smart technologies. Key performance metrics include ease of use, safety, reliability, and customization options. Unique selling propositions often revolve around advanced driving aids, tailored seating configurations, and intuitive control systems. Recent advancements include improved battery technology for electric vehicles and the development of more affordable and accessible solutions.
Key Drivers, Barriers & Challenges in Vehicles for Disabled Market
Key Drivers:
- Increasing prevalence of disabilities and aging population.
- Technological advancements in assistive technologies and vehicle automation.
- Favorable government regulations and incentives promoting accessibility.
- Rising disposable incomes in developing economies.
Challenges & Restraints:
- High initial cost of specialized vehicles.
- Limited availability of trained technicians for maintenance and repair.
- Complex regulatory landscape and varying accessibility standards across regions.
- Competition from adapted conventional vehicles and shared mobility options. This impacts market penetration by approximately xx% annually.
Emerging Opportunities in Vehicles for Disabled Market
- Expanding into underserved markets in developing countries.
- Developing innovative solutions for specific disability needs.
- Leveraging smart technologies to enhance vehicle connectivity and safety.
- Focusing on customized and personalized vehicle solutions.
- Exploring subscription models and shared mobility options for improved accessibility.
Growth Accelerators in the Vehicles for Disabled Market Industry
Technological advancements, particularly in areas such as autonomous driving and advanced driver-assistance systems, are crucial in driving long-term growth. Strategic partnerships between vehicle manufacturers, assistive technology providers, and healthcare organizations can unlock significant market opportunities. Expansion into emerging markets and the development of more affordable and accessible vehicles will further contribute to market growth. Government initiatives promoting accessibility and supportive regulations are critical for sustainable market expansion.
Key Players Shaping the Vehicles for Disabled Market Market
- Mobility Networks
- Focaccia Group Sr
- Vantage Mobility
- Brotherwood Automobility
- Toyota Mobility
- Revability
- Pride Mobility
- Electric Mobility Euro
- AMS Vans LLC
- GM Coachwork
Notable Milestones in Vehicles for Disabled Market Sector
- 2020: Introduction of the first fully autonomous vehicle adapted for wheelchair users by a major manufacturer.
- 2022: Several new regulations concerning vehicle accessibility implemented in the EU.
- 2023: Significant investment in R&D by key players focused on improving battery technology for electric vehicles in the disabled sector.
- 2024: Major merger between two key players, resulting in increased market consolidation.
In-Depth Vehicles for Disabled Market Market Outlook
The Vehicles for Disabled market presents significant long-term growth potential, driven by technological advancements, increasing demand, and supportive regulatory environments. Strategic partnerships, focus on innovation, and expansion into emerging markets will be crucial for success. The market is projected to experience robust growth throughout the forecast period, with significant opportunities for both established players and new entrants. Companies that adapt to evolving consumer needs and technological disruptions are best positioned to capitalize on this growing market.
Vehicles for Disabled Market Segmentation
-
1. Vehicle Type
- 1.1. Two-Wheeler
- 1.2. Four Wheeler
-
2. Driving Option
- 2.1. Swivel Seat
- 2.2. WheelChair
- 2.3. Normal Seat
-
3. Entry Configuration
- 3.1. Side Entry
- 3.2. Rear Entry
Vehicles for Disabled Market Segmentation By Geography
-
1. North America
- 1.1. United States
- 1.2. Canada
-
2. Europe
- 2.1. Germany
- 2.2. United Kingdom
- 2.3. France
- 2.4. Rest of Europe
-
3. Asia Pacific
- 3.1. India
- 3.2. China
- 3.3. Japan
- 3.4. South Korea
- 3.5. Rest of Asia Pacific
-
4. Rest of the World
- 4.1. Brazil
- 4.2. United Arab Emirates
- 4.3. Other Countries
Vehicles for Disabled Market Regional Market Share
Geographic Coverage of Vehicles for Disabled Market
Vehicles for Disabled Market REPORT HIGHLIGHTS
| Aspects | Details |
|---|---|
| Study Period | 2020-2034 |
| Base Year | 2025 |
| Estimated Year | 2026 |
| Forecast Period | 2026-2034 |
| Historical Period | 2020-2025 |
| Growth Rate | CAGR of 11.8% from 2020-2034 |
| Segmentation |
|
Table of Contents
- 1. Introduction
- 1.1. Research Scope
- 1.2. Market Segmentation
- 1.3. Research Objective
- 1.4. Definitions and Assumptions
- 2. Executive Summary
- 2.1. Market Snapshot
- 3. Market Dynamics
- 3.1. Market Drivers
- 3.2. Market Restrains
- 3.3. Market Trends
- 3.4. Market Opportunities
- 4. Market Factor Analysis
- 4.1. Porters Five Forces
- 4.1.1. Bargaining Power of Suppliers
- 4.1.2. Bargaining Power of Buyers
- 4.1.3. Threat of New Entrants
- 4.1.4. Threat of Substitutes
- 4.1.5. Competitive Rivalry
- 4.2. PESTEL analysis
- 4.3. BCG Analysis
- 4.3.1. Stars (High Growth, High Market Share)
- 4.3.2. Cash Cows (Low Growth, High Market Share)
- 4.3.3. Question Mark (High Growth, Low Market Share)
- 4.3.4. Dogs (Low Growth, Low Market Share)
- 4.4. Ansoff Matrix Analysis
- 4.5. Supply Chain Analysis
- 4.6. Regulatory Landscape
- 4.7. Current Market Potential and Opportunity Assessment (TAM–SAM–SOM Framework)
- 4.8. VDR Analyst Note
- 4.1. Porters Five Forces
- 5. Market Analysis, Insights and Forecast 2021-2033
- 5.1. Market Analysis, Insights and Forecast - by Vehicle Type
- 5.1.1. Two-Wheeler
- 5.1.2. Four Wheeler
- 5.2. Market Analysis, Insights and Forecast - by Driving Option
- 5.2.1. Swivel Seat
- 5.2.2. WheelChair
- 5.2.3. Normal Seat
- 5.3. Market Analysis, Insights and Forecast - by Entry Configuration
- 5.3.1. Side Entry
- 5.3.2. Rear Entry
- 5.4. Market Analysis, Insights and Forecast - by Region
- 5.4.1. North America
- 5.4.2. Europe
- 5.4.3. Asia Pacific
- 5.4.4. Rest of the World
- 5.1. Market Analysis, Insights and Forecast - by Vehicle Type
- 6. Global Vehicles for Disabled Market Analysis, Insights and Forecast, 2021-2033
- 6.1. Market Analysis, Insights and Forecast - by Vehicle Type
- 6.1.1. Two-Wheeler
- 6.1.2. Four Wheeler
- 6.2. Market Analysis, Insights and Forecast - by Driving Option
- 6.2.1. Swivel Seat
- 6.2.2. WheelChair
- 6.2.3. Normal Seat
- 6.3. Market Analysis, Insights and Forecast - by Entry Configuration
- 6.3.1. Side Entry
- 6.3.2. Rear Entry
- 6.1. Market Analysis, Insights and Forecast - by Vehicle Type
- 7. North America Vehicles for Disabled Market Analysis, Insights and Forecast, 2021-2033
- 7.1. Market Analysis, Insights and Forecast - by Vehicle Type
- 7.1.1. Two-Wheeler
- 7.1.2. Four Wheeler
- 7.2. Market Analysis, Insights and Forecast - by Driving Option
- 7.2.1. Swivel Seat
- 7.2.2. WheelChair
- 7.2.3. Normal Seat
- 7.3. Market Analysis, Insights and Forecast - by Entry Configuration
- 7.3.1. Side Entry
- 7.3.2. Rear Entry
- 7.1. Market Analysis, Insights and Forecast - by Vehicle Type
- 8. Europe Vehicles for Disabled Market Analysis, Insights and Forecast, 2021-2033
- 8.1. Market Analysis, Insights and Forecast - by Vehicle Type
- 8.1.1. Two-Wheeler
- 8.1.2. Four Wheeler
- 8.2. Market Analysis, Insights and Forecast - by Driving Option
- 8.2.1. Swivel Seat
- 8.2.2. WheelChair
- 8.2.3. Normal Seat
- 8.3. Market Analysis, Insights and Forecast - by Entry Configuration
- 8.3.1. Side Entry
- 8.3.2. Rear Entry
- 8.1. Market Analysis, Insights and Forecast - by Vehicle Type
- 9. Asia Pacific Vehicles for Disabled Market Analysis, Insights and Forecast, 2021-2033
- 9.1. Market Analysis, Insights and Forecast - by Vehicle Type
- 9.1.1. Two-Wheeler
- 9.1.2. Four Wheeler
- 9.2. Market Analysis, Insights and Forecast - by Driving Option
- 9.2.1. Swivel Seat
- 9.2.2. WheelChair
- 9.2.3. Normal Seat
- 9.3. Market Analysis, Insights and Forecast - by Entry Configuration
- 9.3.1. Side Entry
- 9.3.2. Rear Entry
- 9.1. Market Analysis, Insights and Forecast - by Vehicle Type
- 10. Rest of the World Vehicles for Disabled Market Analysis, Insights and Forecast, 2021-2033
- 10.1. Market Analysis, Insights and Forecast - by Vehicle Type
- 10.1.1. Two-Wheeler
- 10.1.2. Four Wheeler
- 10.2. Market Analysis, Insights and Forecast - by Driving Option
- 10.2.1. Swivel Seat
- 10.2.2. WheelChair
- 10.2.3. Normal Seat
- 10.3. Market Analysis, Insights and Forecast - by Entry Configuration
- 10.3.1. Side Entry
- 10.3.2. Rear Entry
- 10.1. Market Analysis, Insights and Forecast - by Vehicle Type
- 11. Competitive Analysis
- 11.1. Company Profiles
- 11.1.1 Mobility Networks
- 11.1.1.1. Company Overview
- 11.1.1.2. Products
- 11.1.1.3. Company Financials
- 11.1.1.4. SWOT Analysis
- 11.1.2 Focaccia Group Sr
- 11.1.2.1. Company Overview
- 11.1.2.2. Products
- 11.1.2.3. Company Financials
- 11.1.2.4. SWOT Analysis
- 11.1.3 Vantage Mobility
- 11.1.3.1. Company Overview
- 11.1.3.2. Products
- 11.1.3.3. Company Financials
- 11.1.3.4. SWOT Analysis
- 11.1.4 Brotherwood Automobility
- 11.1.4.1. Company Overview
- 11.1.4.2. Products
- 11.1.4.3. Company Financials
- 11.1.4.4. SWOT Analysis
- 11.1.5 Toyota Mobility
- 11.1.5.1. Company Overview
- 11.1.5.2. Products
- 11.1.5.3. Company Financials
- 11.1.5.4. SWOT Analysis
- 11.1.6 Revability
- 11.1.6.1. Company Overview
- 11.1.6.2. Products
- 11.1.6.3. Company Financials
- 11.1.6.4. SWOT Analysis
- 11.1.7 Pride Mobility
- 11.1.7.1. Company Overview
- 11.1.7.2. Products
- 11.1.7.3. Company Financials
- 11.1.7.4. SWOT Analysis
- 11.1.8 Electric Mobility Euro
- 11.1.8.1. Company Overview
- 11.1.8.2. Products
- 11.1.8.3. Company Financials
- 11.1.8.4. SWOT Analysis
- 11.1.9 AMS Vans LLC
- 11.1.9.1. Company Overview
- 11.1.9.2. Products
- 11.1.9.3. Company Financials
- 11.1.9.4. SWOT Analysis
- 11.1.10 GM Coachwork
- 11.1.10.1. Company Overview
- 11.1.10.2. Products
- 11.1.10.3. Company Financials
- 11.1.10.4. SWOT Analysis
- 11.1.1 Mobility Networks
- 11.2. Market Entropy
- 11.2.1 Company's Key Areas Served
- 11.2.2 Recent Developments
- 11.3. Company Market Share Analysis 2025
- 11.3.1 Top 5 Companies Market Share Analysis
- 11.3.2 Top 3 Companies Market Share Analysis
- 11.4. List of Potential Customers
- 12. Research Methodology
List of Figures
- Figure 1: Global Vehicles for Disabled Market Revenue Breakdown (billion, %) by Region 2025 & 2033
- Figure 2: North America Vehicles for Disabled Market Revenue (billion), by Vehicle Type 2025 & 2033
- Figure 3: North America Vehicles for Disabled Market Revenue Share (%), by Vehicle Type 2025 & 2033
- Figure 4: North America Vehicles for Disabled Market Revenue (billion), by Driving Option 2025 & 2033
- Figure 5: North America Vehicles for Disabled Market Revenue Share (%), by Driving Option 2025 & 2033
- Figure 6: North America Vehicles for Disabled Market Revenue (billion), by Entry Configuration 2025 & 2033
- Figure 7: North America Vehicles for Disabled Market Revenue Share (%), by Entry Configuration 2025 & 2033
- Figure 8: North America Vehicles for Disabled Market Revenue (billion), by Country 2025 & 2033
- Figure 9: North America Vehicles for Disabled Market Revenue Share (%), by Country 2025 & 2033
- Figure 10: Europe Vehicles for Disabled Market Revenue (billion), by Vehicle Type 2025 & 2033
- Figure 11: Europe Vehicles for Disabled Market Revenue Share (%), by Vehicle Type 2025 & 2033
- Figure 12: Europe Vehicles for Disabled Market Revenue (billion), by Driving Option 2025 & 2033
- Figure 13: Europe Vehicles for Disabled Market Revenue Share (%), by Driving Option 2025 & 2033
- Figure 14: Europe Vehicles for Disabled Market Revenue (billion), by Entry Configuration 2025 & 2033
- Figure 15: Europe Vehicles for Disabled Market Revenue Share (%), by Entry Configuration 2025 & 2033
- Figure 16: Europe Vehicles for Disabled Market Revenue (billion), by Country 2025 & 2033
- Figure 17: Europe Vehicles for Disabled Market Revenue Share (%), by Country 2025 & 2033
- Figure 18: Asia Pacific Vehicles for Disabled Market Revenue (billion), by Vehicle Type 2025 & 2033
- Figure 19: Asia Pacific Vehicles for Disabled Market Revenue Share (%), by Vehicle Type 2025 & 2033
- Figure 20: Asia Pacific Vehicles for Disabled Market Revenue (billion), by Driving Option 2025 & 2033
- Figure 21: Asia Pacific Vehicles for Disabled Market Revenue Share (%), by Driving Option 2025 & 2033
- Figure 22: Asia Pacific Vehicles for Disabled Market Revenue (billion), by Entry Configuration 2025 & 2033
- Figure 23: Asia Pacific Vehicles for Disabled Market Revenue Share (%), by Entry Configuration 2025 & 2033
- Figure 24: Asia Pacific Vehicles for Disabled Market Revenue (billion), by Country 2025 & 2033
- Figure 25: Asia Pacific Vehicles for Disabled Market Revenue Share (%), by Country 2025 & 2033
- Figure 26: Rest of the World Vehicles for Disabled Market Revenue (billion), by Vehicle Type 2025 & 2033
- Figure 27: Rest of the World Vehicles for Disabled Market Revenue Share (%), by Vehicle Type 2025 & 2033
- Figure 28: Rest of the World Vehicles for Disabled Market Revenue (billion), by Driving Option 2025 & 2033
- Figure 29: Rest of the World Vehicles for Disabled Market Revenue Share (%), by Driving Option 2025 & 2033
- Figure 30: Rest of the World Vehicles for Disabled Market Revenue (billion), by Entry Configuration 2025 & 2033
- Figure 31: Rest of the World Vehicles for Disabled Market Revenue Share (%), by Entry Configuration 2025 & 2033
- Figure 32: Rest of the World Vehicles for Disabled Market Revenue (billion), by Country 2025 & 2033
- Figure 33: Rest of the World Vehicles for Disabled Market Revenue Share (%), by Country 2025 & 2033
List of Tables
- Table 1: Global Vehicles for Disabled Market Revenue billion Forecast, by Vehicle Type 2020 & 2033
- Table 2: Global Vehicles for Disabled Market Revenue billion Forecast, by Driving Option 2020 & 2033
- Table 3: Global Vehicles for Disabled Market Revenue billion Forecast, by Entry Configuration 2020 & 2033
- Table 4: Global Vehicles for Disabled Market Revenue billion Forecast, by Region 2020 & 2033
- Table 5: Global Vehicles for Disabled Market Revenue billion Forecast, by Vehicle Type 2020 & 2033
- Table 6: Global Vehicles for Disabled Market Revenue billion Forecast, by Driving Option 2020 & 2033
- Table 7: Global Vehicles for Disabled Market Revenue billion Forecast, by Entry Configuration 2020 & 2033
- Table 8: Global Vehicles for Disabled Market Revenue billion Forecast, by Country 2020 & 2033
- Table 9: United States Vehicles for Disabled Market Revenue (billion) Forecast, by Application 2020 & 2033
- Table 10: Canada Vehicles for Disabled Market Revenue (billion) Forecast, by Application 2020 & 2033
- Table 11: Global Vehicles for Disabled Market Revenue billion Forecast, by Vehicle Type 2020 & 2033
- Table 12: Global Vehicles for Disabled Market Revenue billion Forecast, by Driving Option 2020 & 2033
- Table 13: Global Vehicles for Disabled Market Revenue billion Forecast, by Entry Configuration 2020 & 2033
- Table 14: Global Vehicles for Disabled Market Revenue billion Forecast, by Country 2020 & 2033
- Table 15: Germany Vehicles for Disabled Market Revenue (billion) Forecast, by Application 2020 & 2033
- Table 16: United Kingdom Vehicles for Disabled Market Revenue (billion) Forecast, by Application 2020 & 2033
- Table 17: France Vehicles for Disabled Market Revenue (billion) Forecast, by Application 2020 & 2033
- Table 18: Rest of Europe Vehicles for Disabled Market Revenue (billion) Forecast, by Application 2020 & 2033
- Table 19: Global Vehicles for Disabled Market Revenue billion Forecast, by Vehicle Type 2020 & 2033
- Table 20: Global Vehicles for Disabled Market Revenue billion Forecast, by Driving Option 2020 & 2033
- Table 21: Global Vehicles for Disabled Market Revenue billion Forecast, by Entry Configuration 2020 & 2033
- Table 22: Global Vehicles for Disabled Market Revenue billion Forecast, by Country 2020 & 2033
- Table 23: India Vehicles for Disabled Market Revenue (billion) Forecast, by Application 2020 & 2033
- Table 24: China Vehicles for Disabled Market Revenue (billion) Forecast, by Application 2020 & 2033
- Table 25: Japan Vehicles for Disabled Market Revenue (billion) Forecast, by Application 2020 & 2033
- Table 26: South Korea Vehicles for Disabled Market Revenue (billion) Forecast, by Application 2020 & 2033
- Table 27: Rest of Asia Pacific Vehicles for Disabled Market Revenue (billion) Forecast, by Application 2020 & 2033
- Table 28: Global Vehicles for Disabled Market Revenue billion Forecast, by Vehicle Type 2020 & 2033
- Table 29: Global Vehicles for Disabled Market Revenue billion Forecast, by Driving Option 2020 & 2033
- Table 30: Global Vehicles for Disabled Market Revenue billion Forecast, by Entry Configuration 2020 & 2033
- Table 31: Global Vehicles for Disabled Market Revenue billion Forecast, by Country 2020 & 2033
- Table 32: Brazil Vehicles for Disabled Market Revenue (billion) Forecast, by Application 2020 & 2033
- Table 33: United Arab Emirates Vehicles for Disabled Market Revenue (billion) Forecast, by Application 2020 & 2033
- Table 34: Other Countries Vehicles for Disabled Market Revenue (billion) Forecast, by Application 2020 & 2033
Frequently Asked Questions
1. What is the projected Compound Annual Growth Rate (CAGR) of the Vehicles for Disabled Market?
The projected CAGR is approximately 11.8%.
2. Which companies are prominent players in the Vehicles for Disabled Market?
Key companies in the market include Mobility Networks, Focaccia Group Sr, Vantage Mobility, Brotherwood Automobility, Toyota Mobility, Revability, Pride Mobility, Electric Mobility Euro, AMS Vans LLC, GM Coachwork.
3. What are the main segments of the Vehicles for Disabled Market?
The market segments include Vehicle Type, Driving Option, Entry Configuration.
4. Can you provide details about the market size?
The market size is estimated to be USD 2.9 billion as of 2022.
5. What are some drivers contributing to market growth?
Expanding Warehousing and Logistics Sector to Foster the Growth of the Market.
6. What are the notable trends driving market growth?
Two-Wheeler Segment is expected to be the Market Leader.
7. Are there any restraints impacting market growth?
High Initial Purchase Cost to Hamper the Growth of the Market.
8. Can you provide examples of recent developments in the market?
N/A
9. What pricing options are available for accessing the report?
Pricing options include single-user, multi-user, and enterprise licenses priced at USD 4750, USD 5250, and USD 8750 respectively.
10. Is the market size provided in terms of value or volume?
The market size is provided in terms of value, measured in billion.
11. Are there any specific market keywords associated with the report?
Yes, the market keyword associated with the report is "Vehicles for Disabled Market," which aids in identifying and referencing the specific market segment covered.
12. How do I determine which pricing option suits my needs best?
The pricing options vary based on user requirements and access needs. Individual users may opt for single-user licenses, while businesses requiring broader access may choose multi-user or enterprise licenses for cost-effective access to the report.
13. Are there any additional resources or data provided in the Vehicles for Disabled Market report?
While the report offers comprehensive insights, it's advisable to review the specific contents or supplementary materials provided to ascertain if additional resources or data are available.
14. How can I stay updated on further developments or reports in the Vehicles for Disabled Market?
To stay informed about further developments, trends, and reports in the Vehicles for Disabled Market, consider subscribing to industry newsletters, following relevant companies and organizations, or regularly checking reputable industry news sources and publications.
Methodology
Step 1 - Identification of Relevant Samples Size from Population Database


Step 2 - Approaches for Defining Global Market Size (Value, Volume* & Price*)

Note*: In applicable scenarios
Step 3 - Data Sources
Primary Research
- Web Analytics
- Survey Reports
- Research Institute
- Latest Research Reports
- Opinion Leaders
Secondary Research
- Annual Reports
- White Paper
- Latest Press Release
- Industry Association
- Paid Database
- Investor Presentations

Step 4 - Data Triangulation
Involves using different sources of information in order to increase the validity of a study
These sources are likely to be stakeholders in a program - participants, other researchers, program staff, other community members, and so on.
Then we put all data in single framework & apply various statistical tools to find out the dynamic on the market.
During the analysis stage, feedback from the stakeholder groups would be compared to determine areas of agreement as well as areas of divergence