
Key Insights
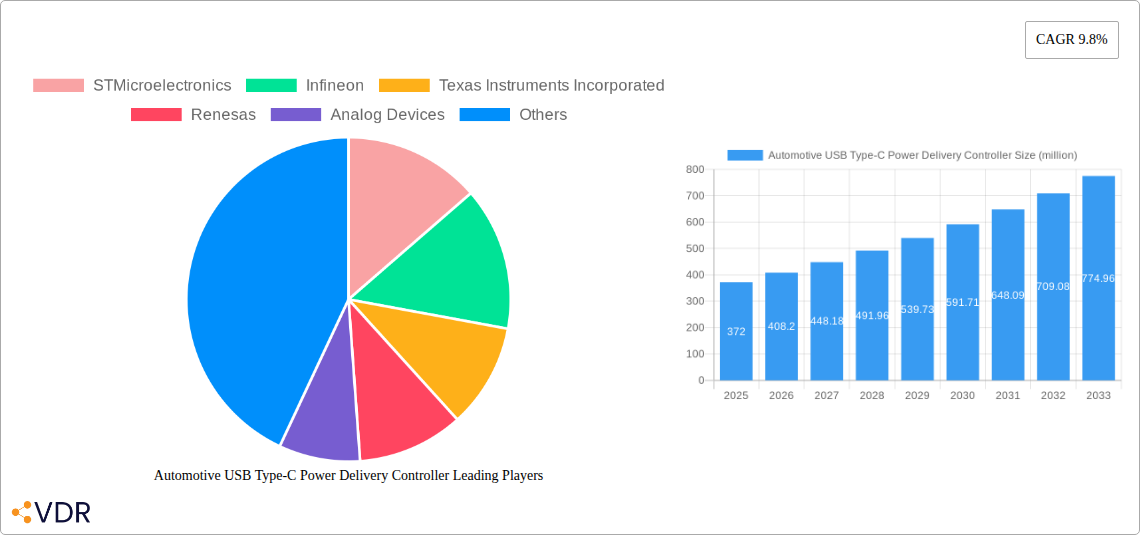
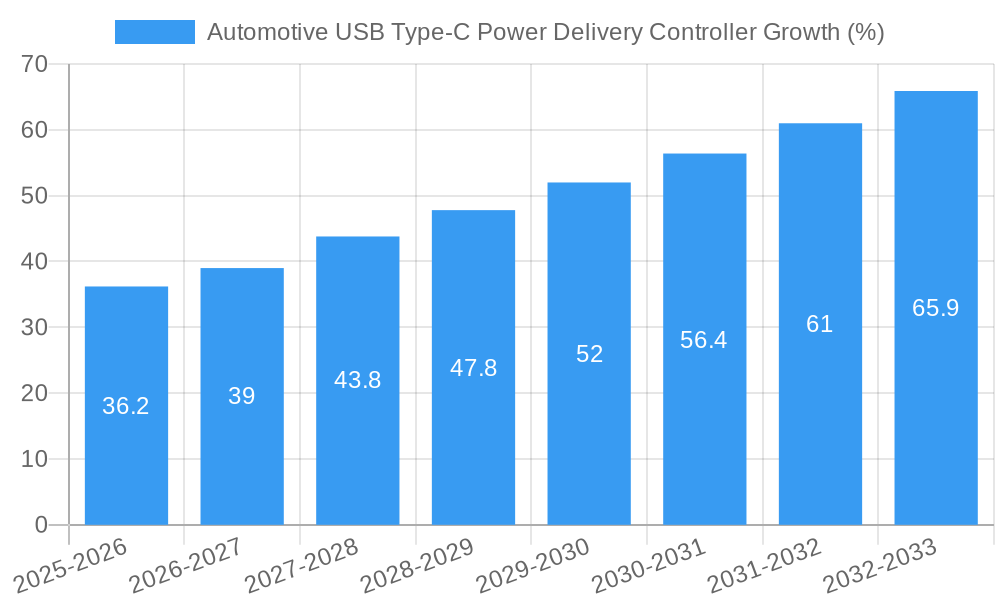
The automotive USB Type-C Power Delivery (PD) controller market is experiencing robust growth, projected to reach $372 million in 2025 and maintain a Compound Annual Growth Rate (CAGR) of 9.8% from 2025 to 2033. This expansion is driven primarily by the increasing adoption of advanced driver-assistance systems (ADAS), the proliferation of in-vehicle infotainment systems with higher power demands, and the rising preference for fast-charging capabilities in electric vehicles (EVs). Key market trends include the integration of USB-C PD controllers with other automotive electronics, the development of more efficient and compact controllers, and the growing demand for higher power delivery capabilities to support larger displays and power-hungry devices. Leading players such as STMicroelectronics, Infineon, Texas Instruments, Renesas, Analog Devices, Microchip Technology, NXP, and ON Semiconductor are actively contributing to this growth through continuous innovation and product diversification. The market faces some restraints, such as the complexity of integrating USB-C PD technology into existing automotive architectures and the need for robust safety and reliability standards to ensure dependable operation in harsh automotive environments.
The forecast period from 2025 to 2033 anticipates significant market expansion, fuelled by the ongoing electrification of vehicles and the increasing sophistication of in-car technology. The expansion into new vehicle segments, including commercial vehicles and autonomous driving platforms, will further stimulate demand. While challenges related to cost and standardization remain, the long-term outlook for the automotive USB Type-C PD controller market remains extremely positive, driven by strong underlying trends in the automotive industry. Strategic partnerships and mergers and acquisitions among market players are also expected to shape the competitive landscape and accelerate innovation in the coming years.
Automotive USB Type-C Power Delivery Controller Market Report: 2019-2033
This comprehensive report provides an in-depth analysis of the Automotive USB Type-C Power Delivery Controller market, encompassing market dynamics, growth trends, regional analysis, competitive landscape, and future outlook. The study period spans from 2019 to 2033, with 2025 as the base year and the forecast period extending from 2025 to 2033. The historical period covered is 2019-2024. The report is invaluable for industry professionals, investors, and stakeholders seeking to understand and capitalize on the opportunities within this rapidly evolving sector. Market size is presented in million units.
Parent Market: Automotive Electronics Market Child Market: Automotive Power Management Integrated Circuits Market
Automotive USB Type-C Power Delivery Controller Market Dynamics & Structure
The Automotive USB Type-C Power Delivery Controller market is characterized by moderate concentration, with key players like STMicroelectronics, Infineon, Texas Instruments Incorporated, Renesas, Analog Devices, Microchip Technology, NXP, and ON Semiconductor vying for market share. The market is driven by technological advancements in faster charging and higher power delivery capabilities, aligning with the increasing demand for sophisticated infotainment and driver-assistance systems in vehicles. Stringent regulatory frameworks concerning vehicle safety and energy efficiency further shape market dynamics. Competitive substitutes include traditional USB charging solutions and wireless charging technologies, although USB Type-C's versatility and power delivery capabilities offer a compelling advantage. The market witnesses continuous mergers and acquisitions (M&A) activity, driven by the need for technological synergies and expansion into new market segments.
- Market Concentration: Moderately Concentrated (xx% market share held by top 5 players in 2025)
- Technological Innovation Drivers: Increased power delivery capabilities, improved efficiency, smaller form factors.
- Regulatory Frameworks: Safety standards (e.g., ISO 26262) and emission regulations impacting design and manufacturing.
- Competitive Product Substitutes: Traditional USB, wireless charging.
- End-User Demographics: Expanding to encompass diverse vehicle types, from passenger cars to commercial vehicles.
- M&A Trends: Strategic acquisitions for technology integration and market expansion (xx M&A deals in 2019-2024).
Automotive USB Type-C Power Delivery Controller Growth Trends & Insights
The Automotive USB Type-C Power Delivery Controller market exhibits robust growth, fueled by the increasing adoption of advanced driver-assistance systems (ADAS) and the proliferation of connected car technologies. The market size experienced a CAGR of xx% during the historical period (2019-2024), reaching xx million units in 2024. This growth is projected to continue at a CAGR of xx% during the forecast period (2025-2033), driven by the rising demand for faster charging solutions and the integration of higher-power devices within vehicles. Market penetration is expected to increase significantly, as more vehicle manufacturers incorporate USB Type-C power delivery controllers into their models. Technological disruptions, such as the emergence of GaN-based power delivery solutions, are further accelerating market growth. Consumer preference shifts towards feature-rich vehicles also contribute to increased demand. By 2033, the market is estimated to reach xx million units.
Dominant Regions, Countries, or Segments in Automotive USB Type-C Power Delivery Controller
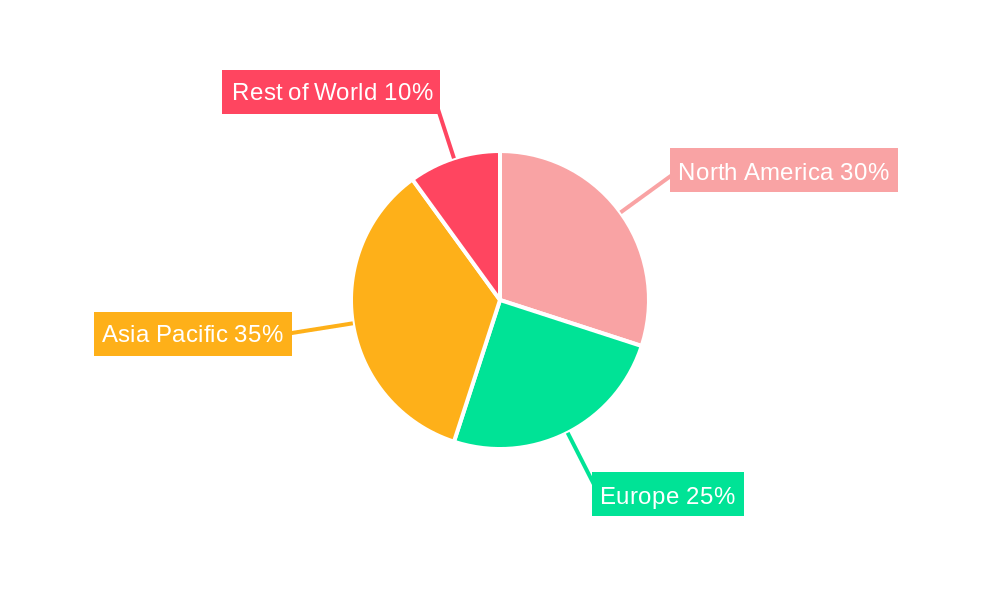
The Asia-Pacific region dominates the Automotive USB Type-C Power Delivery Controller market, driven by the rapid growth of the automotive industry in countries like China, Japan, and South Korea. Strong economic growth, supportive government policies promoting vehicle electrification, and a robust automotive manufacturing infrastructure contribute to this dominance. North America and Europe also represent significant markets, characterized by high vehicle ownership rates and a preference for advanced automotive features.
- Key Drivers in Asia-Pacific:
- Rapid growth of the automotive industry
- Government incentives for electric vehicles
- Expanding consumer base with increasing disposable income.
- Dominance Factors: High vehicle production volumes, strong consumer demand for advanced technology features, and favorable government regulations.
- Growth Potential: Continued expansion of the electric vehicle market, increasing adoption of ADAS, and rising demand for connected car features.
Automotive USB Type-C Power Delivery Controller Product Landscape
Automotive USB Type-C Power Delivery Controllers are characterized by diverse product offerings with varying power delivery capabilities, communication protocols (USB Power Delivery 3.0 and beyond), and integration features. Innovations focus on higher power density, improved thermal management, and enhanced safety features, meeting the demands of high-power devices and stringent automotive safety standards. Unique selling propositions include fast charging capabilities, compatibility with various power levels, and robust protection mechanisms against overcurrent, overvoltage, and short circuits. Technological advancements such as GaN technology are enabling greater efficiency and power density.
Key Drivers, Barriers & Challenges in Automotive USB Type-C Power Delivery Controller
Key Drivers:
- Increasing demand for fast charging solutions in vehicles.
- Growing adoption of advanced driver-assistance systems (ADAS) and infotainment systems.
- Rising popularity of electric vehicles (EVs) requiring efficient power management.
Challenges and Restraints:
- High initial costs associated with integrating advanced power delivery controllers.
- Potential supply chain disruptions impacting component availability.
- Stringent safety and regulatory requirements increasing development complexities.
- Competition from traditional USB and wireless charging technologies.
Emerging Opportunities in Automotive USB Type-C Power Delivery Controller
Emerging opportunities lie in the expansion into untapped markets, such as commercial vehicles and off-road vehicles. Innovative applications, like supporting high-power devices (e.g., laptops, gaming consoles) within vehicles, present significant growth avenues. Evolving consumer preferences towards personalized in-car experiences and seamless connectivity drive the demand for advanced power delivery solutions.
Growth Accelerators in the Automotive USB Type-C Power Delivery Controller Industry
Technological breakthroughs in power semiconductor materials (e.g., GaN, SiC) and improved power management algorithms are crucial growth catalysts. Strategic partnerships between semiconductor manufacturers and automotive original equipment manufacturers (OEMs) ensure smooth integration and wider adoption. Market expansion strategies focusing on emerging economies and the increasing electrification of vehicles further accelerate market growth.
Key Players Shaping the Automotive USB Type-C Power Delivery Controller Market
- STMicroelectronics
- Infineon
- Texas Instruments Incorporated
- Renesas
- Analog Devices
- Microchip Technology
- NXP
- ON Semiconductor
Notable Milestones in Automotive USB Type-C Power Delivery Controller Sector
- 2020: Introduction of xx supporting USB Power Delivery 3.1 by STMicroelectronics.
- 2021: Infineon launched xx featuring enhanced thermal management capabilities.
- 2022: Texas Instruments announced a partnership with xx for integrating its power delivery controllers into EV charging infrastructure.
- 2023: Acquisition of xx by Renesas, expanding its portfolio of automotive power management ICs.
- 2024: xx introduced by Analog Devices offering improved efficiency and smaller form factor.
In-Depth Automotive USB Type-C Power Delivery Controller Market Outlook
The Automotive USB Type-C Power Delivery Controller market is poised for continued robust growth, driven by technological advancements, increasing vehicle electrification, and expanding consumer demand for advanced in-car features. Strategic partnerships, innovative product development, and expansion into emerging markets present significant opportunities for market participants. The long-term outlook remains positive, with substantial potential for market expansion and innovation in the coming years.
Automotive USB Type-C Power Delivery Controller Segmentation
-
1. Application
- 1.1. Passenger Vehicles
- 1.2. Commercial Vehicles
-
2. Types
- 2.1. Single Port
- 2.2. Multiple Ports
Automotive USB Type-C Power Delivery Controller Segmentation By Geography
-
1. North America
- 1.1. United States
- 1.2. Canada
- 1.3. Mexico
-
2. South America
- 2.1. Brazil
- 2.2. Argentina
- 2.3. Rest of South America
-
3. Europe
- 3.1. United Kingdom
- 3.2. Germany
- 3.3. France
- 3.4. Italy
- 3.5. Spain
- 3.6. Russia
- 3.7. Benelux
- 3.8. Nordics
- 3.9. Rest of Europe
-
4. Middle East & Africa
- 4.1. Turkey
- 4.2. Israel
- 4.3. GCC
- 4.4. North Africa
- 4.5. South Africa
- 4.6. Rest of Middle East & Africa
-
5. Asia Pacific
- 5.1. China
- 5.2. India
- 5.3. Japan
- 5.4. South Korea
- 5.5. ASEAN
- 5.6. Oceania
- 5.7. Rest of Asia Pacific
Automotive USB Type-C Power Delivery Controller REPORT HIGHLIGHTS
| Aspects | Details |
|---|---|
| Study Period | 2019-2033 |
| Base Year | 2024 |
| Estimated Year | 2025 |
| Forecast Period | 2025-2033 |
| Historical Period | 2019-2024 |
| Growth Rate | CAGR of 9.8% from 2019-2033 |
| Segmentation |
|
Table of Contents
- 1. Introduction
- 1.1. Research Scope
- 1.2. Market Segmentation
- 1.3. Research Methodology
- 1.4. Definitions and Assumptions
- 2. Executive Summary
- 2.1. Introduction
- 3. Market Dynamics
- 3.1. Introduction
- 3.2. Market Drivers
- 3.3. Market Restrains
- 3.4. Market Trends
- 4. Market Factor Analysis
- 4.1. Porters Five Forces
- 4.2. Supply/Value Chain
- 4.3. PESTEL analysis
- 4.4. Market Entropy
- 4.5. Patent/Trademark Analysis
- 5. Global Automotive USB Type-C Power Delivery Controller Analysis, Insights and Forecast, 2019-2031
- 5.1. Market Analysis, Insights and Forecast - by Application
- 5.1.1. Passenger Vehicles
- 5.1.2. Commercial Vehicles
- 5.2. Market Analysis, Insights and Forecast - by Types
- 5.2.1. Single Port
- 5.2.2. Multiple Ports
- 5.3. Market Analysis, Insights and Forecast - by Region
- 5.3.1. North America
- 5.3.2. South America
- 5.3.3. Europe
- 5.3.4. Middle East & Africa
- 5.3.5. Asia Pacific
- 5.1. Market Analysis, Insights and Forecast - by Application
- 6. North America Automotive USB Type-C Power Delivery Controller Analysis, Insights and Forecast, 2019-2031
- 6.1. Market Analysis, Insights and Forecast - by Application
- 6.1.1. Passenger Vehicles
- 6.1.2. Commercial Vehicles
- 6.2. Market Analysis, Insights and Forecast - by Types
- 6.2.1. Single Port
- 6.2.2. Multiple Ports
- 6.1. Market Analysis, Insights and Forecast - by Application
- 7. South America Automotive USB Type-C Power Delivery Controller Analysis, Insights and Forecast, 2019-2031
- 7.1. Market Analysis, Insights and Forecast - by Application
- 7.1.1. Passenger Vehicles
- 7.1.2. Commercial Vehicles
- 7.2. Market Analysis, Insights and Forecast - by Types
- 7.2.1. Single Port
- 7.2.2. Multiple Ports
- 7.1. Market Analysis, Insights and Forecast - by Application
- 8. Europe Automotive USB Type-C Power Delivery Controller Analysis, Insights and Forecast, 2019-2031
- 8.1. Market Analysis, Insights and Forecast - by Application
- 8.1.1. Passenger Vehicles
- 8.1.2. Commercial Vehicles
- 8.2. Market Analysis, Insights and Forecast - by Types
- 8.2.1. Single Port
- 8.2.2. Multiple Ports
- 8.1. Market Analysis, Insights and Forecast - by Application
- 9. Middle East & Africa Automotive USB Type-C Power Delivery Controller Analysis, Insights and Forecast, 2019-2031
- 9.1. Market Analysis, Insights and Forecast - by Application
- 9.1.1. Passenger Vehicles
- 9.1.2. Commercial Vehicles
- 9.2. Market Analysis, Insights and Forecast - by Types
- 9.2.1. Single Port
- 9.2.2. Multiple Ports
- 9.1. Market Analysis, Insights and Forecast - by Application
- 10. Asia Pacific Automotive USB Type-C Power Delivery Controller Analysis, Insights and Forecast, 2019-2031
- 10.1. Market Analysis, Insights and Forecast - by Application
- 10.1.1. Passenger Vehicles
- 10.1.2. Commercial Vehicles
- 10.2. Market Analysis, Insights and Forecast - by Types
- 10.2.1. Single Port
- 10.2.2. Multiple Ports
- 10.1. Market Analysis, Insights and Forecast - by Application
- 11. Competitive Analysis
- 11.1. Global Market Share Analysis 2024
- 11.2. Company Profiles
- 11.2.1 STMicroelectronics
- 11.2.1.1. Overview
- 11.2.1.2. Products
- 11.2.1.3. SWOT Analysis
- 11.2.1.4. Recent Developments
- 11.2.1.5. Financials (Based on Availability)
- 11.2.2 Infineon
- 11.2.2.1. Overview
- 11.2.2.2. Products
- 11.2.2.3. SWOT Analysis
- 11.2.2.4. Recent Developments
- 11.2.2.5. Financials (Based on Availability)
- 11.2.3 Texas Instruments Incorporated
- 11.2.3.1. Overview
- 11.2.3.2. Products
- 11.2.3.3. SWOT Analysis
- 11.2.3.4. Recent Developments
- 11.2.3.5. Financials (Based on Availability)
- 11.2.4 Renesas
- 11.2.4.1. Overview
- 11.2.4.2. Products
- 11.2.4.3. SWOT Analysis
- 11.2.4.4. Recent Developments
- 11.2.4.5. Financials (Based on Availability)
- 11.2.5 Analog Devices
- 11.2.5.1. Overview
- 11.2.5.2. Products
- 11.2.5.3. SWOT Analysis
- 11.2.5.4. Recent Developments
- 11.2.5.5. Financials (Based on Availability)
- 11.2.6 Microchip Technology
- 11.2.6.1. Overview
- 11.2.6.2. Products
- 11.2.6.3. SWOT Analysis
- 11.2.6.4. Recent Developments
- 11.2.6.5. Financials (Based on Availability)
- 11.2.7 NXP
- 11.2.7.1. Overview
- 11.2.7.2. Products
- 11.2.7.3. SWOT Analysis
- 11.2.7.4. Recent Developments
- 11.2.7.5. Financials (Based on Availability)
- 11.2.8 ON Semiconductor
- 11.2.8.1. Overview
- 11.2.8.2. Products
- 11.2.8.3. SWOT Analysis
- 11.2.8.4. Recent Developments
- 11.2.8.5. Financials (Based on Availability)
- 11.2.1 STMicroelectronics
List of Figures
- Figure 1: Global Automotive USB Type-C Power Delivery Controller Revenue Breakdown (million, %) by Region 2024 & 2032
- Figure 2: North America Automotive USB Type-C Power Delivery Controller Revenue (million), by Application 2024 & 2032
- Figure 3: North America Automotive USB Type-C Power Delivery Controller Revenue Share (%), by Application 2024 & 2032
- Figure 4: North America Automotive USB Type-C Power Delivery Controller Revenue (million), by Types 2024 & 2032
- Figure 5: North America Automotive USB Type-C Power Delivery Controller Revenue Share (%), by Types 2024 & 2032
- Figure 6: North America Automotive USB Type-C Power Delivery Controller Revenue (million), by Country 2024 & 2032
- Figure 7: North America Automotive USB Type-C Power Delivery Controller Revenue Share (%), by Country 2024 & 2032
- Figure 8: South America Automotive USB Type-C Power Delivery Controller Revenue (million), by Application 2024 & 2032
- Figure 9: South America Automotive USB Type-C Power Delivery Controller Revenue Share (%), by Application 2024 & 2032
- Figure 10: South America Automotive USB Type-C Power Delivery Controller Revenue (million), by Types 2024 & 2032
- Figure 11: South America Automotive USB Type-C Power Delivery Controller Revenue Share (%), by Types 2024 & 2032
- Figure 12: South America Automotive USB Type-C Power Delivery Controller Revenue (million), by Country 2024 & 2032
- Figure 13: South America Automotive USB Type-C Power Delivery Controller Revenue Share (%), by Country 2024 & 2032
- Figure 14: Europe Automotive USB Type-C Power Delivery Controller Revenue (million), by Application 2024 & 2032
- Figure 15: Europe Automotive USB Type-C Power Delivery Controller Revenue Share (%), by Application 2024 & 2032
- Figure 16: Europe Automotive USB Type-C Power Delivery Controller Revenue (million), by Types 2024 & 2032
- Figure 17: Europe Automotive USB Type-C Power Delivery Controller Revenue Share (%), by Types 2024 & 2032
- Figure 18: Europe Automotive USB Type-C Power Delivery Controller Revenue (million), by Country 2024 & 2032
- Figure 19: Europe Automotive USB Type-C Power Delivery Controller Revenue Share (%), by Country 2024 & 2032
- Figure 20: Middle East & Africa Automotive USB Type-C Power Delivery Controller Revenue (million), by Application 2024 & 2032
- Figure 21: Middle East & Africa Automotive USB Type-C Power Delivery Controller Revenue Share (%), by Application 2024 & 2032
- Figure 22: Middle East & Africa Automotive USB Type-C Power Delivery Controller Revenue (million), by Types 2024 & 2032
- Figure 23: Middle East & Africa Automotive USB Type-C Power Delivery Controller Revenue Share (%), by Types 2024 & 2032
- Figure 24: Middle East & Africa Automotive USB Type-C Power Delivery Controller Revenue (million), by Country 2024 & 2032
- Figure 25: Middle East & Africa Automotive USB Type-C Power Delivery Controller Revenue Share (%), by Country 2024 & 2032
- Figure 26: Asia Pacific Automotive USB Type-C Power Delivery Controller Revenue (million), by Application 2024 & 2032
- Figure 27: Asia Pacific Automotive USB Type-C Power Delivery Controller Revenue Share (%), by Application 2024 & 2032
- Figure 28: Asia Pacific Automotive USB Type-C Power Delivery Controller Revenue (million), by Types 2024 & 2032
- Figure 29: Asia Pacific Automotive USB Type-C Power Delivery Controller Revenue Share (%), by Types 2024 & 2032
- Figure 30: Asia Pacific Automotive USB Type-C Power Delivery Controller Revenue (million), by Country 2024 & 2032
- Figure 31: Asia Pacific Automotive USB Type-C Power Delivery Controller Revenue Share (%), by Country 2024 & 2032
List of Tables
- Table 1: Global Automotive USB Type-C Power Delivery Controller Revenue million Forecast, by Region 2019 & 2032
- Table 2: Global Automotive USB Type-C Power Delivery Controller Revenue million Forecast, by Application 2019 & 2032
- Table 3: Global Automotive USB Type-C Power Delivery Controller Revenue million Forecast, by Types 2019 & 2032
- Table 4: Global Automotive USB Type-C Power Delivery Controller Revenue million Forecast, by Region 2019 & 2032
- Table 5: Global Automotive USB Type-C Power Delivery Controller Revenue million Forecast, by Application 2019 & 2032
- Table 6: Global Automotive USB Type-C Power Delivery Controller Revenue million Forecast, by Types 2019 & 2032
- Table 7: Global Automotive USB Type-C Power Delivery Controller Revenue million Forecast, by Country 2019 & 2032
- Table 8: United States Automotive USB Type-C Power Delivery Controller Revenue (million) Forecast, by Application 2019 & 2032
- Table 9: Canada Automotive USB Type-C Power Delivery Controller Revenue (million) Forecast, by Application 2019 & 2032
- Table 10: Mexico Automotive USB Type-C Power Delivery Controller Revenue (million) Forecast, by Application 2019 & 2032
- Table 11: Global Automotive USB Type-C Power Delivery Controller Revenue million Forecast, by Application 2019 & 2032
- Table 12: Global Automotive USB Type-C Power Delivery Controller Revenue million Forecast, by Types 2019 & 2032
- Table 13: Global Automotive USB Type-C Power Delivery Controller Revenue million Forecast, by Country 2019 & 2032
- Table 14: Brazil Automotive USB Type-C Power Delivery Controller Revenue (million) Forecast, by Application 2019 & 2032
- Table 15: Argentina Automotive USB Type-C Power Delivery Controller Revenue (million) Forecast, by Application 2019 & 2032
- Table 16: Rest of South America Automotive USB Type-C Power Delivery Controller Revenue (million) Forecast, by Application 2019 & 2032
- Table 17: Global Automotive USB Type-C Power Delivery Controller Revenue million Forecast, by Application 2019 & 2032
- Table 18: Global Automotive USB Type-C Power Delivery Controller Revenue million Forecast, by Types 2019 & 2032
- Table 19: Global Automotive USB Type-C Power Delivery Controller Revenue million Forecast, by Country 2019 & 2032
- Table 20: United Kingdom Automotive USB Type-C Power Delivery Controller Revenue (million) Forecast, by Application 2019 & 2032
- Table 21: Germany Automotive USB Type-C Power Delivery Controller Revenue (million) Forecast, by Application 2019 & 2032
- Table 22: France Automotive USB Type-C Power Delivery Controller Revenue (million) Forecast, by Application 2019 & 2032
- Table 23: Italy Automotive USB Type-C Power Delivery Controller Revenue (million) Forecast, by Application 2019 & 2032
- Table 24: Spain Automotive USB Type-C Power Delivery Controller Revenue (million) Forecast, by Application 2019 & 2032
- Table 25: Russia Automotive USB Type-C Power Delivery Controller Revenue (million) Forecast, by Application 2019 & 2032
- Table 26: Benelux Automotive USB Type-C Power Delivery Controller Revenue (million) Forecast, by Application 2019 & 2032
- Table 27: Nordics Automotive USB Type-C Power Delivery Controller Revenue (million) Forecast, by Application 2019 & 2032
- Table 28: Rest of Europe Automotive USB Type-C Power Delivery Controller Revenue (million) Forecast, by Application 2019 & 2032
- Table 29: Global Automotive USB Type-C Power Delivery Controller Revenue million Forecast, by Application 2019 & 2032
- Table 30: Global Automotive USB Type-C Power Delivery Controller Revenue million Forecast, by Types 2019 & 2032
- Table 31: Global Automotive USB Type-C Power Delivery Controller Revenue million Forecast, by Country 2019 & 2032
- Table 32: Turkey Automotive USB Type-C Power Delivery Controller Revenue (million) Forecast, by Application 2019 & 2032
- Table 33: Israel Automotive USB Type-C Power Delivery Controller Revenue (million) Forecast, by Application 2019 & 2032
- Table 34: GCC Automotive USB Type-C Power Delivery Controller Revenue (million) Forecast, by Application 2019 & 2032
- Table 35: North Africa Automotive USB Type-C Power Delivery Controller Revenue (million) Forecast, by Application 2019 & 2032
- Table 36: South Africa Automotive USB Type-C Power Delivery Controller Revenue (million) Forecast, by Application 2019 & 2032
- Table 37: Rest of Middle East & Africa Automotive USB Type-C Power Delivery Controller Revenue (million) Forecast, by Application 2019 & 2032
- Table 38: Global Automotive USB Type-C Power Delivery Controller Revenue million Forecast, by Application 2019 & 2032
- Table 39: Global Automotive USB Type-C Power Delivery Controller Revenue million Forecast, by Types 2019 & 2032
- Table 40: Global Automotive USB Type-C Power Delivery Controller Revenue million Forecast, by Country 2019 & 2032
- Table 41: China Automotive USB Type-C Power Delivery Controller Revenue (million) Forecast, by Application 2019 & 2032
- Table 42: India Automotive USB Type-C Power Delivery Controller Revenue (million) Forecast, by Application 2019 & 2032
- Table 43: Japan Automotive USB Type-C Power Delivery Controller Revenue (million) Forecast, by Application 2019 & 2032
- Table 44: South Korea Automotive USB Type-C Power Delivery Controller Revenue (million) Forecast, by Application 2019 & 2032
- Table 45: ASEAN Automotive USB Type-C Power Delivery Controller Revenue (million) Forecast, by Application 2019 & 2032
- Table 46: Oceania Automotive USB Type-C Power Delivery Controller Revenue (million) Forecast, by Application 2019 & 2032
- Table 47: Rest of Asia Pacific Automotive USB Type-C Power Delivery Controller Revenue (million) Forecast, by Application 2019 & 2032
Frequently Asked Questions
1. What is the projected Compound Annual Growth Rate (CAGR) of the Automotive USB Type-C Power Delivery Controller?
The projected CAGR is approximately 9.8%.
2. Which companies are prominent players in the Automotive USB Type-C Power Delivery Controller?
Key companies in the market include STMicroelectronics, Infineon, Texas Instruments Incorporated, Renesas, Analog Devices, Microchip Technology, NXP, ON Semiconductor.
3. What are the main segments of the Automotive USB Type-C Power Delivery Controller?
The market segments include Application, Types.
4. Can you provide details about the market size?
The market size is estimated to be USD 372 million as of 2022.
5. What are some drivers contributing to market growth?
N/A
6. What are the notable trends driving market growth?
N/A
7. Are there any restraints impacting market growth?
N/A
8. Can you provide examples of recent developments in the market?
N/A
9. What pricing options are available for accessing the report?
Pricing options include single-user, multi-user, and enterprise licenses priced at USD 4900.00, USD 7350.00, and USD 9800.00 respectively.
10. Is the market size provided in terms of value or volume?
The market size is provided in terms of value, measured in million.
11. Are there any specific market keywords associated with the report?
Yes, the market keyword associated with the report is "Automotive USB Type-C Power Delivery Controller," which aids in identifying and referencing the specific market segment covered.
12. How do I determine which pricing option suits my needs best?
The pricing options vary based on user requirements and access needs. Individual users may opt for single-user licenses, while businesses requiring broader access may choose multi-user or enterprise licenses for cost-effective access to the report.
13. Are there any additional resources or data provided in the Automotive USB Type-C Power Delivery Controller report?
While the report offers comprehensive insights, it's advisable to review the specific contents or supplementary materials provided to ascertain if additional resources or data are available.
14. How can I stay updated on further developments or reports in the Automotive USB Type-C Power Delivery Controller?
To stay informed about further developments, trends, and reports in the Automotive USB Type-C Power Delivery Controller, consider subscribing to industry newsletters, following relevant companies and organizations, or regularly checking reputable industry news sources and publications.
Methodology
Step 1 - Identification of Relevant Samples Size from Population Database


Step 2 - Approaches for Defining Global Market Size (Value, Volume* & Price*)

Note*: In applicable scenarios
Step 3 - Data Sources
Primary Research
- Web Analytics
- Survey Reports
- Research Institute
- Latest Research Reports
- Opinion Leaders
Secondary Research
- Annual Reports
- White Paper
- Latest Press Release
- Industry Association
- Paid Database
- Investor Presentations

Step 4 - Data Triangulation
Involves using different sources of information in order to increase the validity of a study
These sources are likely to be stakeholders in a program - participants, other researchers, program staff, other community members, and so on.
Then we put all data in single framework & apply various statistical tools to find out the dynamic on the market.
During the analysis stage, feedback from the stakeholder groups would be compared to determine areas of agreement as well as areas of divergence


