
Key Insights
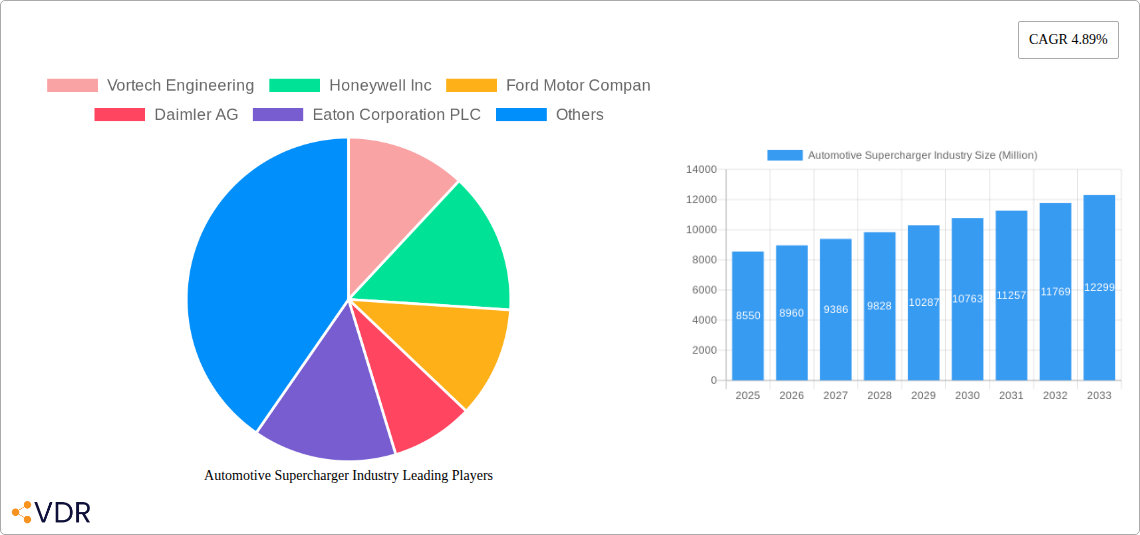
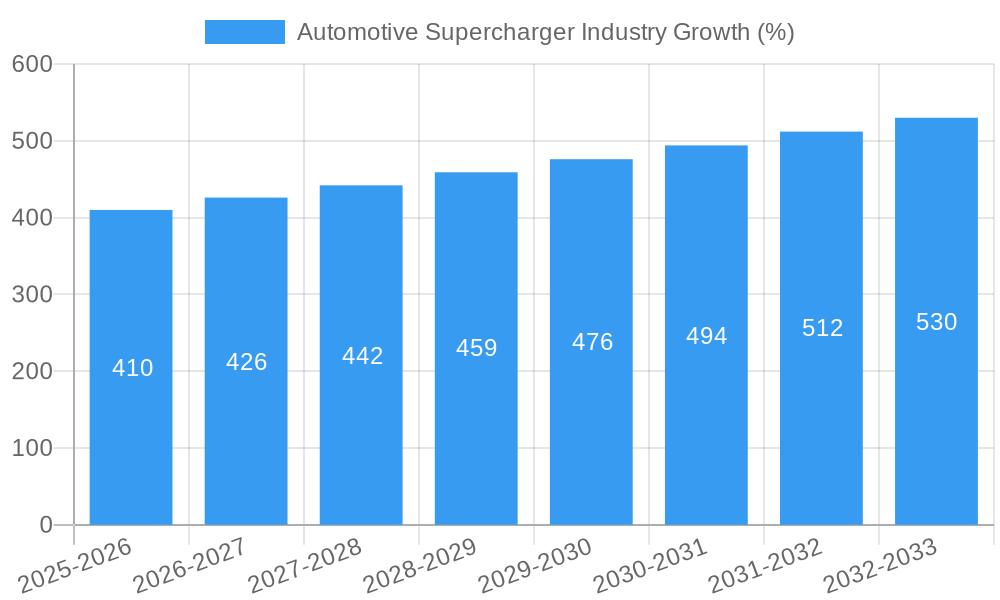
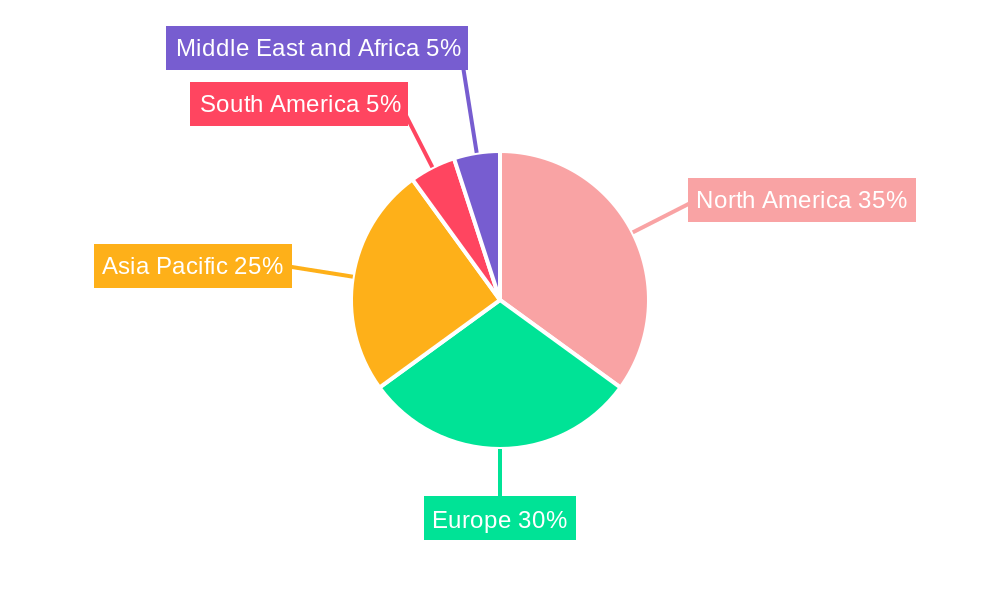
The automotive supercharger market, valued at $8.55 billion in 2025, is projected to experience robust growth, driven by increasing demand for enhanced engine performance and fuel efficiency in both passenger cars and commercial vehicles. A compound annual growth rate (CAGR) of 4.89% from 2025 to 2033 signifies a significant expansion of this market. Key drivers include the rising popularity of performance-oriented vehicles, stricter emission regulations prompting the adoption of superchargers for improved fuel economy, and technological advancements leading to smaller, lighter, and more efficient supercharger designs. The market segmentation reveals a dynamic landscape with centrifugal superchargers dominating the technology segment due to their high efficiency at higher RPMs. Gasoline-powered vehicles currently constitute a larger share of the fuel type segment, although the rising adoption of diesel vehicles in commercial applications presents a growth opportunity. The OEM sales channel holds the largest market share, reflecting the integration of superchargers directly into vehicle manufacturing. However, the aftermarket segment is also expected to show notable growth fueled by the increasing popularity of vehicle modifications and performance enhancements. Regional analysis indicates that North America and Europe are currently the largest markets, but the Asia-Pacific region is projected to witness substantial growth due to rapid economic development and rising automotive sales in countries like China and India. The competitive landscape is characterized by a mix of established automotive giants like Ford and Daimler alongside specialized supercharger manufacturers like Vortech and Rotrex, creating a vibrant and innovative market.
The forecast period (2025-2033) anticipates continued market expansion, fueled by several factors. The increasing adoption of electric vehicles (EVs) may initially seem like a restraint, but the development of electric motor-driven superchargers for hybrid and electric vehicles offers a promising avenue for future growth within this segment. Furthermore, advancements in materials science and manufacturing technologies are expected to lead to cost reductions, making superchargers more accessible to a wider range of vehicle manufacturers and consumers. However, potential challenges include the relatively high initial cost of superchargers compared to naturally aspirated engines and the need for advanced engine management systems for optimal performance. Despite these challenges, the overall market outlook remains positive, with sustained growth expected throughout the forecast period driven by technological innovation and evolving consumer preferences for high-performance vehicles.
This comprehensive report provides a detailed analysis of the automotive supercharger industry, covering market dynamics, growth trends, regional analysis, product landscape, key players, and future outlook. The report uses 2025 as the base year, with data spanning the historical period (2019-2024), the study period (2019-2033), and the forecast period (2025-2033). All market size values are presented in million units.
Automotive Supercharger Industry Market Dynamics & Structure
The automotive supercharger market is characterized by a moderately concentrated landscape, with key players like Eaton Corporation PLC, Honeywell Inc., and Vortech Engineering holding significant market share. Technological innovation, driven by the demand for higher engine performance and efficiency, is a major growth driver. Stringent emission regulations globally are influencing the adoption of specific supercharger technologies, while the rising popularity of electric vehicles presents both a challenge and an opportunity for the industry (exploring electric motor-driven superchargers). The market witnesses continuous M&A activity, with xx deals recorded between 2019 and 2024, primarily focused on expanding product portfolios and geographical reach. Substitute technologies, such as turbochargers, pose competitive pressure, necessitating continuous innovation. End-user demographics shift towards performance-oriented vehicles and luxury cars, fueling demand in the aftermarket segment.
- Market Concentration: Moderately concentrated, with top 5 players holding xx% market share (2024).
- Technological Innovation: Focus on improving efficiency, reducing emissions, and enhancing power output.
- Regulatory Frameworks: Stringent emission norms impacting technology adoption and product design.
- Competitive Substitutes: Turbochargers and other forced induction systems.
- End-User Demographics: Growing demand from luxury and performance car segments.
- M&A Activity: xx deals recorded between 2019 and 2024, indicating consolidation and expansion.
Automotive Supercharger Industry Growth Trends & Insights
The automotive supercharger market witnessed a CAGR of xx% during the historical period (2019-2024), reaching xx million units in 2024. This growth is primarily attributed to the increasing demand for high-performance vehicles, particularly in developing economies. The market is expected to continue its growth trajectory, with a projected CAGR of xx% during the forecast period (2025-2033), driven by technological advancements, such as the development of more efficient and compact supercharger designs. The adoption rate of superchargers in passenger cars is higher compared to commercial vehicles, although the latter segment is exhibiting growth potential. Technological disruptions, such as the emergence of electric motor-driven superchargers and advancements in materials science, are shaping market dynamics. Shifts in consumer behavior, with a preference for fuel-efficient yet powerful vehicles, are further boosting demand for technologically advanced superchargers. Market penetration is expected to increase from xx% in 2024 to xx% by 2033.
Dominant Regions, Countries, or Segments in Automotive Supercharger Industry
North America currently dominates the automotive supercharger market, driven by strong demand from the US and Canada's automotive sectors and a well-established aftermarket. Europe follows as a significant market, with substantial contributions from Germany and the UK. Within the segments, passenger cars comprise the largest share, followed by the aftermarket sales channel.
- By Vehicle Type: Passenger cars dominate (xx million units in 2024), followed by commercial vehicles (xx million units in 2024).
- By Technology: Centrifugal superchargers hold the largest market share (xx% in 2024), owing to their efficiency and compact design.
- By Fuel Type: Gasoline-powered vehicles account for the majority of supercharger installations (xx% in 2024).
- By Power Source: Engine-driven superchargers currently dominate (xx% in 2024), but electric motor-driven superchargers are emerging.
- By Sales Channel: The aftermarket segment is experiencing robust growth (xx% CAGR during 2019-2024).
Automotive Supercharger Industry Product Landscape
The automotive supercharger market offers a diverse range of products, categorized by technology (centrifugal, roots, twin-screw), power source (engine-driven, electric motor-driven), and application (OEM, aftermarket). Recent innovations focus on improving efficiency, reducing noise and vibration, and enhancing durability. Key features include advanced materials, improved airflow dynamics, and optimized control systems. Unique selling propositions often highlight superior performance, enhanced fuel efficiency, and reduced emissions. Technological advancements like integrated electronic controls and compact designs are driving product differentiation.
Key Drivers, Barriers & Challenges in Automotive Supercharger Industry
Key Drivers:
- Increasing demand for high-performance vehicles.
- Advancements in supercharger technology, improving efficiency and reducing emissions.
- Growth of the aftermarket segment.
Challenges & Restraints:
- Competition from turbochargers.
- Stringent emission regulations.
- Fluctuations in raw material prices impacting production costs.
- Supply chain disruptions affecting production and delivery timelines.
Emerging Opportunities in Automotive Supercharger Industry
- Expansion into emerging markets with growing automotive industries.
- Development of electric motor-driven superchargers for hybrid and electric vehicles.
- Growing demand for superchargers in performance-oriented electric vehicles (EVs).
Growth Accelerators in the Automotive Supercharger Industry
Technological advancements, strategic partnerships between supercharger manufacturers and automotive OEMs, and expansion into new geographic markets are key growth accelerators. Increased focus on developing hybrid and electric vehicle-compatible superchargers presents significant growth opportunities.
Key Players Shaping the Automotive Supercharger Industry Market
- Vortech Engineering
- Honeywell Inc
- Ford Motor Company
- Daimler AG
- Eaton Corporation PLC
- Ferrari N.V.
- Aeristech
- A&A Corvette
- Federal-Mogul Corporation
- Koenigsegg Automotive AB
- Rotrex A/S
- IHI Corporation
- Mitsubishi Heavy Industries Ltd
Notable Milestones in Automotive Supercharger Industry Sector
- October 2023: HySE announces plans for a hydrogen ICE-powered vehicle using a supercharger for Dakar 2024.
- June 2023: Late Model Engines introduces Whipple’s Gen 5 3.0L supercharger capable of 1,400 horsepower.
- November 2022: Eaton Corporation launches Twin Vortices Series X3100 supercharger for aftermarket applications.
In-Depth Automotive Supercharger Industry Market Outlook
The automotive supercharger market is poised for continued growth, driven by technological innovation, the expanding aftermarket segment, and rising demand in developing economies. Strategic partnerships between OEMs and supercharger manufacturers, along with the development of new applications for hybrid and electric vehicles, present substantial opportunities for market expansion and increased profitability. The focus on enhancing efficiency, reducing emissions, and improving performance will shape the future of the automotive supercharger industry.
Automotive Supercharger Industry Segmentation
-
1. Technology
- 1.1. Centrifugal Supercharger
- 1.2. Roots Supercharger
- 1.3. Twin-Screw Supercharger
-
2. Fuel Type
- 2.1. Gasoline
- 2.2. Diesel
-
3. Power Source
- 3.1. Engine Driven
- 3.2. Electric Motor Driven
-
4. Sales Channel
- 4.1. Original Equipment Manufacturer (OEM)
- 4.2. Aftermarket
-
5. Vehicle Type
- 5.1. Passenger Cars
- 5.2. Commercial Vehicles
Automotive Supercharger Industry Segmentation By Geography
-
1. North America
- 1.1. United States
- 1.2. Canada
- 1.3. Rest of North America
-
2. Europe
- 2.1. Germany
- 2.2. United Kingdom
- 2.3. France
- 2.4. Italy
- 2.5. Rest of Europe
-
3. Asia Pacific
- 3.1. China
- 3.2. India
- 3.3. Japan
- 3.4. South Korea
- 3.5. Rest of Asia Pacific
-
4. South America
- 4.1. Brazil
- 4.2. Argentina
- 4.3. Rest of South America
-
5. Middle East and Africa
- 5.1. United Arab Emirates
- 5.2. Saudi Arabia
- 5.3. Rest of Middle East and Africa
Automotive Supercharger Industry REPORT HIGHLIGHTS
| Aspects | Details |
|---|---|
| Study Period | 2019-2033 |
| Base Year | 2024 |
| Estimated Year | 2025 |
| Forecast Period | 2025-2033 |
| Historical Period | 2019-2024 |
| Growth Rate | CAGR of 4.89% from 2019-2033 |
| Segmentation |
|
Table of Contents
- 1. Introduction
- 1.1. Research Scope
- 1.2. Market Segmentation
- 1.3. Research Methodology
- 1.4. Definitions and Assumptions
- 2. Executive Summary
- 2.1. Introduction
- 3. Market Dynamics
- 3.1. Introduction
- 3.2. Market Drivers
- 3.2.1. Increasing Demand for Luxury Vehicles to Foster the Growth of the Market
- 3.3. Market Restrains
- 3.3.1. Rising Adoption of Electric Vehicles Deter Market Growth
- 3.4. Market Trends
- 3.4.1. Passengers Cars Segment to Dominate the Market during the Forecast Period
- 4. Market Factor Analysis
- 4.1. Porters Five Forces
- 4.2. Supply/Value Chain
- 4.3. PESTEL analysis
- 4.4. Market Entropy
- 4.5. Patent/Trademark Analysis
- 5. Global Automotive Supercharger Industry Analysis, Insights and Forecast, 2019-2031
- 5.1. Market Analysis, Insights and Forecast - by Technology
- 5.1.1. Centrifugal Supercharger
- 5.1.2. Roots Supercharger
- 5.1.3. Twin-Screw Supercharger
- 5.2. Market Analysis, Insights and Forecast - by Fuel Type
- 5.2.1. Gasoline
- 5.2.2. Diesel
- 5.3. Market Analysis, Insights and Forecast - by Power Source
- 5.3.1. Engine Driven
- 5.3.2. Electric Motor Driven
- 5.4. Market Analysis, Insights and Forecast - by Sales Channel
- 5.4.1. Original Equipment Manufacturer (OEM)
- 5.4.2. Aftermarket
- 5.5. Market Analysis, Insights and Forecast - by Vehicle Type
- 5.5.1. Passenger Cars
- 5.5.2. Commercial Vehicles
- 5.6. Market Analysis, Insights and Forecast - by Region
- 5.6.1. North America
- 5.6.2. Europe
- 5.6.3. Asia Pacific
- 5.6.4. South America
- 5.6.5. Middle East and Africa
- 5.1. Market Analysis, Insights and Forecast - by Technology
- 6. North America Automotive Supercharger Industry Analysis, Insights and Forecast, 2019-2031
- 6.1. Market Analysis, Insights and Forecast - by Technology
- 6.1.1. Centrifugal Supercharger
- 6.1.2. Roots Supercharger
- 6.1.3. Twin-Screw Supercharger
- 6.2. Market Analysis, Insights and Forecast - by Fuel Type
- 6.2.1. Gasoline
- 6.2.2. Diesel
- 6.3. Market Analysis, Insights and Forecast - by Power Source
- 6.3.1. Engine Driven
- 6.3.2. Electric Motor Driven
- 6.4. Market Analysis, Insights and Forecast - by Sales Channel
- 6.4.1. Original Equipment Manufacturer (OEM)
- 6.4.2. Aftermarket
- 6.5. Market Analysis, Insights and Forecast - by Vehicle Type
- 6.5.1. Passenger Cars
- 6.5.2. Commercial Vehicles
- 6.1. Market Analysis, Insights and Forecast - by Technology
- 7. Europe Automotive Supercharger Industry Analysis, Insights and Forecast, 2019-2031
- 7.1. Market Analysis, Insights and Forecast - by Technology
- 7.1.1. Centrifugal Supercharger
- 7.1.2. Roots Supercharger
- 7.1.3. Twin-Screw Supercharger
- 7.2. Market Analysis, Insights and Forecast - by Fuel Type
- 7.2.1. Gasoline
- 7.2.2. Diesel
- 7.3. Market Analysis, Insights and Forecast - by Power Source
- 7.3.1. Engine Driven
- 7.3.2. Electric Motor Driven
- 7.4. Market Analysis, Insights and Forecast - by Sales Channel
- 7.4.1. Original Equipment Manufacturer (OEM)
- 7.4.2. Aftermarket
- 7.5. Market Analysis, Insights and Forecast - by Vehicle Type
- 7.5.1. Passenger Cars
- 7.5.2. Commercial Vehicles
- 7.1. Market Analysis, Insights and Forecast - by Technology
- 8. Asia Pacific Automotive Supercharger Industry Analysis, Insights and Forecast, 2019-2031
- 8.1. Market Analysis, Insights and Forecast - by Technology
- 8.1.1. Centrifugal Supercharger
- 8.1.2. Roots Supercharger
- 8.1.3. Twin-Screw Supercharger
- 8.2. Market Analysis, Insights and Forecast - by Fuel Type
- 8.2.1. Gasoline
- 8.2.2. Diesel
- 8.3. Market Analysis, Insights and Forecast - by Power Source
- 8.3.1. Engine Driven
- 8.3.2. Electric Motor Driven
- 8.4. Market Analysis, Insights and Forecast - by Sales Channel
- 8.4.1. Original Equipment Manufacturer (OEM)
- 8.4.2. Aftermarket
- 8.5. Market Analysis, Insights and Forecast - by Vehicle Type
- 8.5.1. Passenger Cars
- 8.5.2. Commercial Vehicles
- 8.1. Market Analysis, Insights and Forecast - by Technology
- 9. South America Automotive Supercharger Industry Analysis, Insights and Forecast, 2019-2031
- 9.1. Market Analysis, Insights and Forecast - by Technology
- 9.1.1. Centrifugal Supercharger
- 9.1.2. Roots Supercharger
- 9.1.3. Twin-Screw Supercharger
- 9.2. Market Analysis, Insights and Forecast - by Fuel Type
- 9.2.1. Gasoline
- 9.2.2. Diesel
- 9.3. Market Analysis, Insights and Forecast - by Power Source
- 9.3.1. Engine Driven
- 9.3.2. Electric Motor Driven
- 9.4. Market Analysis, Insights and Forecast - by Sales Channel
- 9.4.1. Original Equipment Manufacturer (OEM)
- 9.4.2. Aftermarket
- 9.5. Market Analysis, Insights and Forecast - by Vehicle Type
- 9.5.1. Passenger Cars
- 9.5.2. Commercial Vehicles
- 9.1. Market Analysis, Insights and Forecast - by Technology
- 10. Middle East and Africa Automotive Supercharger Industry Analysis, Insights and Forecast, 2019-2031
- 10.1. Market Analysis, Insights and Forecast - by Technology
- 10.1.1. Centrifugal Supercharger
- 10.1.2. Roots Supercharger
- 10.1.3. Twin-Screw Supercharger
- 10.2. Market Analysis, Insights and Forecast - by Fuel Type
- 10.2.1. Gasoline
- 10.2.2. Diesel
- 10.3. Market Analysis, Insights and Forecast - by Power Source
- 10.3.1. Engine Driven
- 10.3.2. Electric Motor Driven
- 10.4. Market Analysis, Insights and Forecast - by Sales Channel
- 10.4.1. Original Equipment Manufacturer (OEM)
- 10.4.2. Aftermarket
- 10.5. Market Analysis, Insights and Forecast - by Vehicle Type
- 10.5.1. Passenger Cars
- 10.5.2. Commercial Vehicles
- 10.1. Market Analysis, Insights and Forecast - by Technology
- 11. North America Automotive Supercharger Industry Analysis, Insights and Forecast, 2019-2031
- 11.1. Market Analysis, Insights and Forecast - By Country/Sub-region
- 11.1.1 United States
- 11.1.2 Canada
- 11.1.3 Rest of North America
- 12. Europe Automotive Supercharger Industry Analysis, Insights and Forecast, 2019-2031
- 12.1. Market Analysis, Insights and Forecast - By Country/Sub-region
- 12.1.1 Germany
- 12.1.2 United Kingdom
- 12.1.3 France
- 12.1.4 Italy
- 12.1.5 Rest of Europe
- 13. Asia Pacific Automotive Supercharger Industry Analysis, Insights and Forecast, 2019-2031
- 13.1. Market Analysis, Insights and Forecast - By Country/Sub-region
- 13.1.1 China
- 13.1.2 India
- 13.1.3 Japan
- 13.1.4 South Korea
- 13.1.5 Rest of Asia Pacific
- 14. South America Automotive Supercharger Industry Analysis, Insights and Forecast, 2019-2031
- 14.1. Market Analysis, Insights and Forecast - By Country/Sub-region
- 14.1.1 Brazil
- 14.1.2 Argentina
- 14.1.3 Rest of South America
- 15. Middle East and Africa Automotive Supercharger Industry Analysis, Insights and Forecast, 2019-2031
- 15.1. Market Analysis, Insights and Forecast - By Country/Sub-region
- 15.1.1 United Arab Emirates
- 15.1.2 Saudi Arabia
- 15.1.3 Rest of Middle East and Africa
- 16. Competitive Analysis
- 16.1. Global Market Share Analysis 2024
- 16.2. Company Profiles
- 16.2.1 Vortech Engineering
- 16.2.1.1. Overview
- 16.2.1.2. Products
- 16.2.1.3. SWOT Analysis
- 16.2.1.4. Recent Developments
- 16.2.1.5. Financials (Based on Availability)
- 16.2.2 Honeywell Inc
- 16.2.2.1. Overview
- 16.2.2.2. Products
- 16.2.2.3. SWOT Analysis
- 16.2.2.4. Recent Developments
- 16.2.2.5. Financials (Based on Availability)
- 16.2.3 Ford Motor Compan
- 16.2.3.1. Overview
- 16.2.3.2. Products
- 16.2.3.3. SWOT Analysis
- 16.2.3.4. Recent Developments
- 16.2.3.5. Financials (Based on Availability)
- 16.2.4 Daimler AG
- 16.2.4.1. Overview
- 16.2.4.2. Products
- 16.2.4.3. SWOT Analysis
- 16.2.4.4. Recent Developments
- 16.2.4.5. Financials (Based on Availability)
- 16.2.5 Eaton Corporation PLC
- 16.2.5.1. Overview
- 16.2.5.2. Products
- 16.2.5.3. SWOT Analysis
- 16.2.5.4. Recent Developments
- 16.2.5.5. Financials (Based on Availability)
- 16.2.6 Ferarri N V
- 16.2.6.1. Overview
- 16.2.6.2. Products
- 16.2.6.3. SWOT Analysis
- 16.2.6.4. Recent Developments
- 16.2.6.5. Financials (Based on Availability)
- 16.2.7 Aeristech
- 16.2.7.1. Overview
- 16.2.7.2. Products
- 16.2.7.3. SWOT Analysis
- 16.2.7.4. Recent Developments
- 16.2.7.5. Financials (Based on Availability)
- 16.2.8 A&A Corvette
- 16.2.8.1. Overview
- 16.2.8.2. Products
- 16.2.8.3. SWOT Analysis
- 16.2.8.4. Recent Developments
- 16.2.8.5. Financials (Based on Availability)
- 16.2.9 Federal-Mogul Corporation
- 16.2.9.1. Overview
- 16.2.9.2. Products
- 16.2.9.3. SWOT Analysis
- 16.2.9.4. Recent Developments
- 16.2.9.5. Financials (Based on Availability)
- 16.2.10 Koenigsegg Automotive AB
- 16.2.10.1. Overview
- 16.2.10.2. Products
- 16.2.10.3. SWOT Analysis
- 16.2.10.4. Recent Developments
- 16.2.10.5. Financials (Based on Availability)
- 16.2.11 Rotrex A/S
- 16.2.11.1. Overview
- 16.2.11.2. Products
- 16.2.11.3. SWOT Analysis
- 16.2.11.4. Recent Developments
- 16.2.11.5. Financials (Based on Availability)
- 16.2.12 IHI Corporation
- 16.2.12.1. Overview
- 16.2.12.2. Products
- 16.2.12.3. SWOT Analysis
- 16.2.12.4. Recent Developments
- 16.2.12.5. Financials (Based on Availability)
- 16.2.13 Mitsubishi Heavy Industries Ltd
- 16.2.13.1. Overview
- 16.2.13.2. Products
- 16.2.13.3. SWOT Analysis
- 16.2.13.4. Recent Developments
- 16.2.13.5. Financials (Based on Availability)
- 16.2.1 Vortech Engineering
List of Figures
- Figure 1: Global Automotive Supercharger Industry Revenue Breakdown (Million, %) by Region 2024 & 2032
- Figure 2: North America Automotive Supercharger Industry Revenue (Million), by Country 2024 & 2032
- Figure 3: North America Automotive Supercharger Industry Revenue Share (%), by Country 2024 & 2032
- Figure 4: Europe Automotive Supercharger Industry Revenue (Million), by Country 2024 & 2032
- Figure 5: Europe Automotive Supercharger Industry Revenue Share (%), by Country 2024 & 2032
- Figure 6: Asia Pacific Automotive Supercharger Industry Revenue (Million), by Country 2024 & 2032
- Figure 7: Asia Pacific Automotive Supercharger Industry Revenue Share (%), by Country 2024 & 2032
- Figure 8: South America Automotive Supercharger Industry Revenue (Million), by Country 2024 & 2032
- Figure 9: South America Automotive Supercharger Industry Revenue Share (%), by Country 2024 & 2032
- Figure 10: Middle East and Africa Automotive Supercharger Industry Revenue (Million), by Country 2024 & 2032
- Figure 11: Middle East and Africa Automotive Supercharger Industry Revenue Share (%), by Country 2024 & 2032
- Figure 12: North America Automotive Supercharger Industry Revenue (Million), by Technology 2024 & 2032
- Figure 13: North America Automotive Supercharger Industry Revenue Share (%), by Technology 2024 & 2032
- Figure 14: North America Automotive Supercharger Industry Revenue (Million), by Fuel Type 2024 & 2032
- Figure 15: North America Automotive Supercharger Industry Revenue Share (%), by Fuel Type 2024 & 2032
- Figure 16: North America Automotive Supercharger Industry Revenue (Million), by Power Source 2024 & 2032
- Figure 17: North America Automotive Supercharger Industry Revenue Share (%), by Power Source 2024 & 2032
- Figure 18: North America Automotive Supercharger Industry Revenue (Million), by Sales Channel 2024 & 2032
- Figure 19: North America Automotive Supercharger Industry Revenue Share (%), by Sales Channel 2024 & 2032
- Figure 20: North America Automotive Supercharger Industry Revenue (Million), by Vehicle Type 2024 & 2032
- Figure 21: North America Automotive Supercharger Industry Revenue Share (%), by Vehicle Type 2024 & 2032
- Figure 22: North America Automotive Supercharger Industry Revenue (Million), by Country 2024 & 2032
- Figure 23: North America Automotive Supercharger Industry Revenue Share (%), by Country 2024 & 2032
- Figure 24: Europe Automotive Supercharger Industry Revenue (Million), by Technology 2024 & 2032
- Figure 25: Europe Automotive Supercharger Industry Revenue Share (%), by Technology 2024 & 2032
- Figure 26: Europe Automotive Supercharger Industry Revenue (Million), by Fuel Type 2024 & 2032
- Figure 27: Europe Automotive Supercharger Industry Revenue Share (%), by Fuel Type 2024 & 2032
- Figure 28: Europe Automotive Supercharger Industry Revenue (Million), by Power Source 2024 & 2032
- Figure 29: Europe Automotive Supercharger Industry Revenue Share (%), by Power Source 2024 & 2032
- Figure 30: Europe Automotive Supercharger Industry Revenue (Million), by Sales Channel 2024 & 2032
- Figure 31: Europe Automotive Supercharger Industry Revenue Share (%), by Sales Channel 2024 & 2032
- Figure 32: Europe Automotive Supercharger Industry Revenue (Million), by Vehicle Type 2024 & 2032
- Figure 33: Europe Automotive Supercharger Industry Revenue Share (%), by Vehicle Type 2024 & 2032
- Figure 34: Europe Automotive Supercharger Industry Revenue (Million), by Country 2024 & 2032
- Figure 35: Europe Automotive Supercharger Industry Revenue Share (%), by Country 2024 & 2032
- Figure 36: Asia Pacific Automotive Supercharger Industry Revenue (Million), by Technology 2024 & 2032
- Figure 37: Asia Pacific Automotive Supercharger Industry Revenue Share (%), by Technology 2024 & 2032
- Figure 38: Asia Pacific Automotive Supercharger Industry Revenue (Million), by Fuel Type 2024 & 2032
- Figure 39: Asia Pacific Automotive Supercharger Industry Revenue Share (%), by Fuel Type 2024 & 2032
- Figure 40: Asia Pacific Automotive Supercharger Industry Revenue (Million), by Power Source 2024 & 2032
- Figure 41: Asia Pacific Automotive Supercharger Industry Revenue Share (%), by Power Source 2024 & 2032
- Figure 42: Asia Pacific Automotive Supercharger Industry Revenue (Million), by Sales Channel 2024 & 2032
- Figure 43: Asia Pacific Automotive Supercharger Industry Revenue Share (%), by Sales Channel 2024 & 2032
- Figure 44: Asia Pacific Automotive Supercharger Industry Revenue (Million), by Vehicle Type 2024 & 2032
- Figure 45: Asia Pacific Automotive Supercharger Industry Revenue Share (%), by Vehicle Type 2024 & 2032
- Figure 46: Asia Pacific Automotive Supercharger Industry Revenue (Million), by Country 2024 & 2032
- Figure 47: Asia Pacific Automotive Supercharger Industry Revenue Share (%), by Country 2024 & 2032
- Figure 48: South America Automotive Supercharger Industry Revenue (Million), by Technology 2024 & 2032
- Figure 49: South America Automotive Supercharger Industry Revenue Share (%), by Technology 2024 & 2032
- Figure 50: South America Automotive Supercharger Industry Revenue (Million), by Fuel Type 2024 & 2032
- Figure 51: South America Automotive Supercharger Industry Revenue Share (%), by Fuel Type 2024 & 2032
- Figure 52: South America Automotive Supercharger Industry Revenue (Million), by Power Source 2024 & 2032
- Figure 53: South America Automotive Supercharger Industry Revenue Share (%), by Power Source 2024 & 2032
- Figure 54: South America Automotive Supercharger Industry Revenue (Million), by Sales Channel 2024 & 2032
- Figure 55: South America Automotive Supercharger Industry Revenue Share (%), by Sales Channel 2024 & 2032
- Figure 56: South America Automotive Supercharger Industry Revenue (Million), by Vehicle Type 2024 & 2032
- Figure 57: South America Automotive Supercharger Industry Revenue Share (%), by Vehicle Type 2024 & 2032
- Figure 58: South America Automotive Supercharger Industry Revenue (Million), by Country 2024 & 2032
- Figure 59: South America Automotive Supercharger Industry Revenue Share (%), by Country 2024 & 2032
- Figure 60: Middle East and Africa Automotive Supercharger Industry Revenue (Million), by Technology 2024 & 2032
- Figure 61: Middle East and Africa Automotive Supercharger Industry Revenue Share (%), by Technology 2024 & 2032
- Figure 62: Middle East and Africa Automotive Supercharger Industry Revenue (Million), by Fuel Type 2024 & 2032
- Figure 63: Middle East and Africa Automotive Supercharger Industry Revenue Share (%), by Fuel Type 2024 & 2032
- Figure 64: Middle East and Africa Automotive Supercharger Industry Revenue (Million), by Power Source 2024 & 2032
- Figure 65: Middle East and Africa Automotive Supercharger Industry Revenue Share (%), by Power Source 2024 & 2032
- Figure 66: Middle East and Africa Automotive Supercharger Industry Revenue (Million), by Sales Channel 2024 & 2032
- Figure 67: Middle East and Africa Automotive Supercharger Industry Revenue Share (%), by Sales Channel 2024 & 2032
- Figure 68: Middle East and Africa Automotive Supercharger Industry Revenue (Million), by Vehicle Type 2024 & 2032
- Figure 69: Middle East and Africa Automotive Supercharger Industry Revenue Share (%), by Vehicle Type 2024 & 2032
- Figure 70: Middle East and Africa Automotive Supercharger Industry Revenue (Million), by Country 2024 & 2032
- Figure 71: Middle East and Africa Automotive Supercharger Industry Revenue Share (%), by Country 2024 & 2032
List of Tables
- Table 1: Global Automotive Supercharger Industry Revenue Million Forecast, by Region 2019 & 2032
- Table 2: Global Automotive Supercharger Industry Revenue Million Forecast, by Technology 2019 & 2032
- Table 3: Global Automotive Supercharger Industry Revenue Million Forecast, by Fuel Type 2019 & 2032
- Table 4: Global Automotive Supercharger Industry Revenue Million Forecast, by Power Source 2019 & 2032
- Table 5: Global Automotive Supercharger Industry Revenue Million Forecast, by Sales Channel 2019 & 2032
- Table 6: Global Automotive Supercharger Industry Revenue Million Forecast, by Vehicle Type 2019 & 2032
- Table 7: Global Automotive Supercharger Industry Revenue Million Forecast, by Region 2019 & 2032
- Table 8: Global Automotive Supercharger Industry Revenue Million Forecast, by Country 2019 & 2032
- Table 9: United States Automotive Supercharger Industry Revenue (Million) Forecast, by Application 2019 & 2032
- Table 10: Canada Automotive Supercharger Industry Revenue (Million) Forecast, by Application 2019 & 2032
- Table 11: Rest of North America Automotive Supercharger Industry Revenue (Million) Forecast, by Application 2019 & 2032
- Table 12: Global Automotive Supercharger Industry Revenue Million Forecast, by Country 2019 & 2032
- Table 13: Germany Automotive Supercharger Industry Revenue (Million) Forecast, by Application 2019 & 2032
- Table 14: United Kingdom Automotive Supercharger Industry Revenue (Million) Forecast, by Application 2019 & 2032
- Table 15: France Automotive Supercharger Industry Revenue (Million) Forecast, by Application 2019 & 2032
- Table 16: Italy Automotive Supercharger Industry Revenue (Million) Forecast, by Application 2019 & 2032
- Table 17: Rest of Europe Automotive Supercharger Industry Revenue (Million) Forecast, by Application 2019 & 2032
- Table 18: Global Automotive Supercharger Industry Revenue Million Forecast, by Country 2019 & 2032
- Table 19: China Automotive Supercharger Industry Revenue (Million) Forecast, by Application 2019 & 2032
- Table 20: India Automotive Supercharger Industry Revenue (Million) Forecast, by Application 2019 & 2032
- Table 21: Japan Automotive Supercharger Industry Revenue (Million) Forecast, by Application 2019 & 2032
- Table 22: South Korea Automotive Supercharger Industry Revenue (Million) Forecast, by Application 2019 & 2032
- Table 23: Rest of Asia Pacific Automotive Supercharger Industry Revenue (Million) Forecast, by Application 2019 & 2032
- Table 24: Global Automotive Supercharger Industry Revenue Million Forecast, by Country 2019 & 2032
- Table 25: Brazil Automotive Supercharger Industry Revenue (Million) Forecast, by Application 2019 & 2032
- Table 26: Argentina Automotive Supercharger Industry Revenue (Million) Forecast, by Application 2019 & 2032
- Table 27: Rest of South America Automotive Supercharger Industry Revenue (Million) Forecast, by Application 2019 & 2032
- Table 28: Global Automotive Supercharger Industry Revenue Million Forecast, by Country 2019 & 2032
- Table 29: United Arab Emirates Automotive Supercharger Industry Revenue (Million) Forecast, by Application 2019 & 2032
- Table 30: Saudi Arabia Automotive Supercharger Industry Revenue (Million) Forecast, by Application 2019 & 2032
- Table 31: Rest of Middle East and Africa Automotive Supercharger Industry Revenue (Million) Forecast, by Application 2019 & 2032
- Table 32: Global Automotive Supercharger Industry Revenue Million Forecast, by Technology 2019 & 2032
- Table 33: Global Automotive Supercharger Industry Revenue Million Forecast, by Fuel Type 2019 & 2032
- Table 34: Global Automotive Supercharger Industry Revenue Million Forecast, by Power Source 2019 & 2032
- Table 35: Global Automotive Supercharger Industry Revenue Million Forecast, by Sales Channel 2019 & 2032
- Table 36: Global Automotive Supercharger Industry Revenue Million Forecast, by Vehicle Type 2019 & 2032
- Table 37: Global Automotive Supercharger Industry Revenue Million Forecast, by Country 2019 & 2032
- Table 38: United States Automotive Supercharger Industry Revenue (Million) Forecast, by Application 2019 & 2032
- Table 39: Canada Automotive Supercharger Industry Revenue (Million) Forecast, by Application 2019 & 2032
- Table 40: Rest of North America Automotive Supercharger Industry Revenue (Million) Forecast, by Application 2019 & 2032
- Table 41: Global Automotive Supercharger Industry Revenue Million Forecast, by Technology 2019 & 2032
- Table 42: Global Automotive Supercharger Industry Revenue Million Forecast, by Fuel Type 2019 & 2032
- Table 43: Global Automotive Supercharger Industry Revenue Million Forecast, by Power Source 2019 & 2032
- Table 44: Global Automotive Supercharger Industry Revenue Million Forecast, by Sales Channel 2019 & 2032
- Table 45: Global Automotive Supercharger Industry Revenue Million Forecast, by Vehicle Type 2019 & 2032
- Table 46: Global Automotive Supercharger Industry Revenue Million Forecast, by Country 2019 & 2032
- Table 47: Germany Automotive Supercharger Industry Revenue (Million) Forecast, by Application 2019 & 2032
- Table 48: United Kingdom Automotive Supercharger Industry Revenue (Million) Forecast, by Application 2019 & 2032
- Table 49: France Automotive Supercharger Industry Revenue (Million) Forecast, by Application 2019 & 2032
- Table 50: Italy Automotive Supercharger Industry Revenue (Million) Forecast, by Application 2019 & 2032
- Table 51: Rest of Europe Automotive Supercharger Industry Revenue (Million) Forecast, by Application 2019 & 2032
- Table 52: Global Automotive Supercharger Industry Revenue Million Forecast, by Technology 2019 & 2032
- Table 53: Global Automotive Supercharger Industry Revenue Million Forecast, by Fuel Type 2019 & 2032
- Table 54: Global Automotive Supercharger Industry Revenue Million Forecast, by Power Source 2019 & 2032
- Table 55: Global Automotive Supercharger Industry Revenue Million Forecast, by Sales Channel 2019 & 2032
- Table 56: Global Automotive Supercharger Industry Revenue Million Forecast, by Vehicle Type 2019 & 2032
- Table 57: Global Automotive Supercharger Industry Revenue Million Forecast, by Country 2019 & 2032
- Table 58: China Automotive Supercharger Industry Revenue (Million) Forecast, by Application 2019 & 2032
- Table 59: India Automotive Supercharger Industry Revenue (Million) Forecast, by Application 2019 & 2032
- Table 60: Japan Automotive Supercharger Industry Revenue (Million) Forecast, by Application 2019 & 2032
- Table 61: South Korea Automotive Supercharger Industry Revenue (Million) Forecast, by Application 2019 & 2032
- Table 62: Rest of Asia Pacific Automotive Supercharger Industry Revenue (Million) Forecast, by Application 2019 & 2032
- Table 63: Global Automotive Supercharger Industry Revenue Million Forecast, by Technology 2019 & 2032
- Table 64: Global Automotive Supercharger Industry Revenue Million Forecast, by Fuel Type 2019 & 2032
- Table 65: Global Automotive Supercharger Industry Revenue Million Forecast, by Power Source 2019 & 2032
- Table 66: Global Automotive Supercharger Industry Revenue Million Forecast, by Sales Channel 2019 & 2032
- Table 67: Global Automotive Supercharger Industry Revenue Million Forecast, by Vehicle Type 2019 & 2032
- Table 68: Global Automotive Supercharger Industry Revenue Million Forecast, by Country 2019 & 2032
- Table 69: Brazil Automotive Supercharger Industry Revenue (Million) Forecast, by Application 2019 & 2032
- Table 70: Argentina Automotive Supercharger Industry Revenue (Million) Forecast, by Application 2019 & 2032
- Table 71: Rest of South America Automotive Supercharger Industry Revenue (Million) Forecast, by Application 2019 & 2032
- Table 72: Global Automotive Supercharger Industry Revenue Million Forecast, by Technology 2019 & 2032
- Table 73: Global Automotive Supercharger Industry Revenue Million Forecast, by Fuel Type 2019 & 2032
- Table 74: Global Automotive Supercharger Industry Revenue Million Forecast, by Power Source 2019 & 2032
- Table 75: Global Automotive Supercharger Industry Revenue Million Forecast, by Sales Channel 2019 & 2032
- Table 76: Global Automotive Supercharger Industry Revenue Million Forecast, by Vehicle Type 2019 & 2032
- Table 77: Global Automotive Supercharger Industry Revenue Million Forecast, by Country 2019 & 2032
- Table 78: United Arab Emirates Automotive Supercharger Industry Revenue (Million) Forecast, by Application 2019 & 2032
- Table 79: Saudi Arabia Automotive Supercharger Industry Revenue (Million) Forecast, by Application 2019 & 2032
- Table 80: Rest of Middle East and Africa Automotive Supercharger Industry Revenue (Million) Forecast, by Application 2019 & 2032
Frequently Asked Questions
1. What is the projected Compound Annual Growth Rate (CAGR) of the Automotive Supercharger Industry?
The projected CAGR is approximately 4.89%.
2. Which companies are prominent players in the Automotive Supercharger Industry?
Key companies in the market include Vortech Engineering, Honeywell Inc, Ford Motor Compan, Daimler AG, Eaton Corporation PLC, Ferarri N V, Aeristech, A&A Corvette, Federal-Mogul Corporation, Koenigsegg Automotive AB, Rotrex A/S, IHI Corporation, Mitsubishi Heavy Industries Ltd.
3. What are the main segments of the Automotive Supercharger Industry?
The market segments include Technology, Fuel Type, Power Source, Sales Channel, Vehicle Type.
4. Can you provide details about the market size?
The market size is estimated to be USD 8.55 Million as of 2022.
5. What are some drivers contributing to market growth?
Increasing Demand for Luxury Vehicles to Foster the Growth of the Market.
6. What are the notable trends driving market growth?
Passengers Cars Segment to Dominate the Market during the Forecast Period.
7. Are there any restraints impacting market growth?
Rising Adoption of Electric Vehicles Deter Market Growth.
8. Can you provide examples of recent developments in the market?
October 2023: HySE, a Japanese research association that includes some of Japan's leading hydrogen engines and off-roading manufacturers, such as Honda, Toyota, and Yamaha, announced its plan to introduce a hydrogen ICE-powered side-by-side X1 for debut at Dakar 2024. The X1 is set to be powered by a 1.0-liter four-stroke inline-four hydrogen motorcycle engine hooked to a supercharger for more efficient power production.
9. What pricing options are available for accessing the report?
Pricing options include single-user, multi-user, and enterprise licenses priced at USD 4750, USD 5250, and USD 8750 respectively.
10. Is the market size provided in terms of value or volume?
The market size is provided in terms of value, measured in Million.
11. Are there any specific market keywords associated with the report?
Yes, the market keyword associated with the report is "Automotive Supercharger Industry," which aids in identifying and referencing the specific market segment covered.
12. How do I determine which pricing option suits my needs best?
The pricing options vary based on user requirements and access needs. Individual users may opt for single-user licenses, while businesses requiring broader access may choose multi-user or enterprise licenses for cost-effective access to the report.
13. Are there any additional resources or data provided in the Automotive Supercharger Industry report?
While the report offers comprehensive insights, it's advisable to review the specific contents or supplementary materials provided to ascertain if additional resources or data are available.
14. How can I stay updated on further developments or reports in the Automotive Supercharger Industry?
To stay informed about further developments, trends, and reports in the Automotive Supercharger Industry, consider subscribing to industry newsletters, following relevant companies and organizations, or regularly checking reputable industry news sources and publications.
Methodology
Step 1 - Identification of Relevant Samples Size from Population Database


Step 2 - Approaches for Defining Global Market Size (Value, Volume* & Price*)

Note*: In applicable scenarios
Step 3 - Data Sources
Primary Research
- Web Analytics
- Survey Reports
- Research Institute
- Latest Research Reports
- Opinion Leaders
Secondary Research
- Annual Reports
- White Paper
- Latest Press Release
- Industry Association
- Paid Database
- Investor Presentations

Step 4 - Data Triangulation
Involves using different sources of information in order to increase the validity of a study
These sources are likely to be stakeholders in a program - participants, other researchers, program staff, other community members, and so on.
Then we put all data in single framework & apply various statistical tools to find out the dynamic on the market.
During the analysis stage, feedback from the stakeholder groups would be compared to determine areas of agreement as well as areas of divergence


