
Key Insights
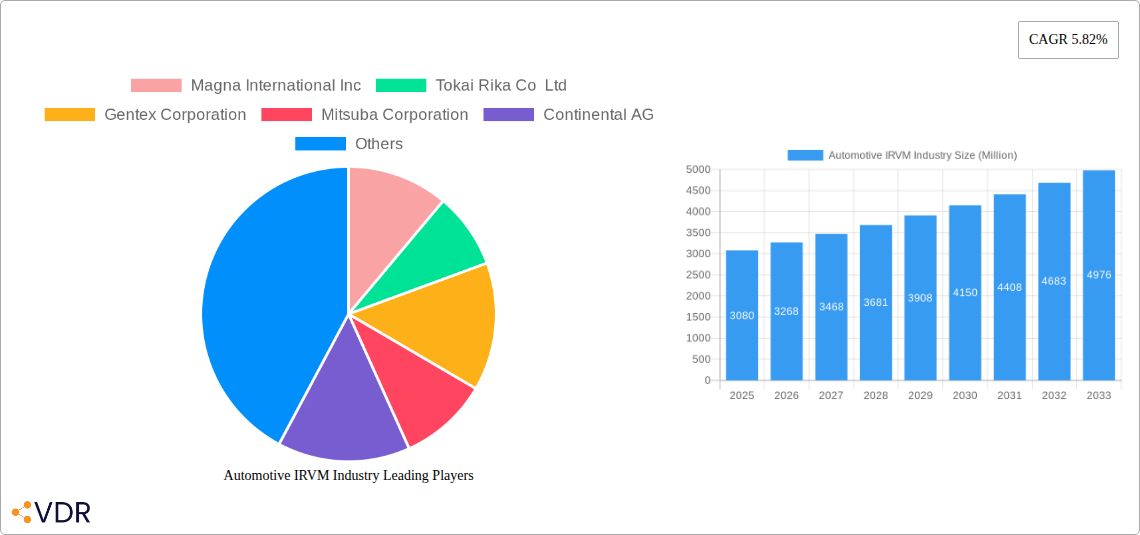
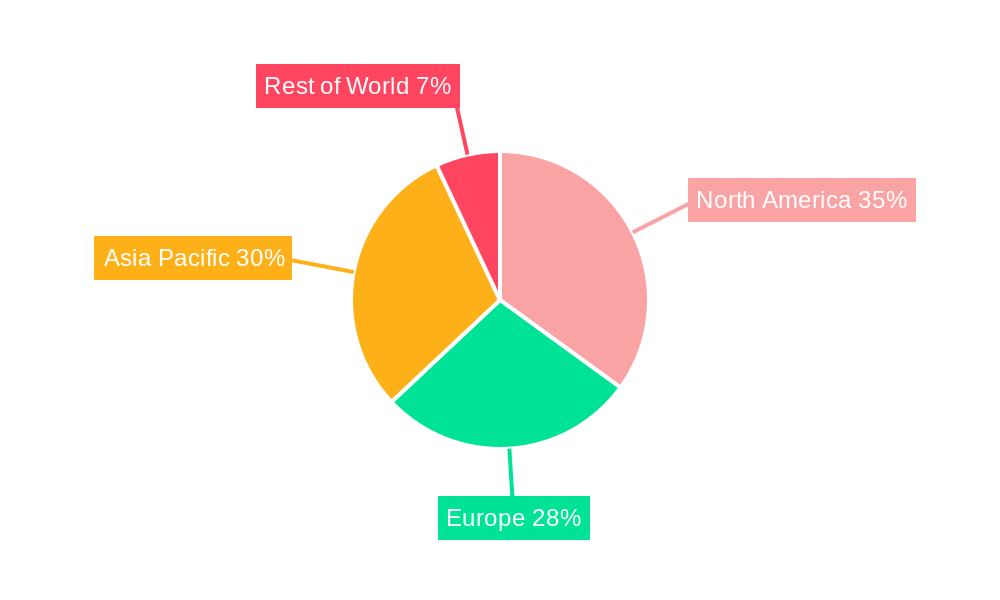
The global automotive interior rearview mirror (IRVM) market is experiencing robust growth, projected to reach \$3.08 billion in 2025 and maintain a Compound Annual Growth Rate (CAGR) of 5.82% from 2025 to 2033. This expansion is driven by several key factors. The increasing adoption of advanced driver-assistance systems (ADAS) features like blind-spot detection and lane departure warning, integrated directly into IRVMs, is a significant catalyst. Furthermore, the rising demand for enhanced safety and comfort features in vehicles, particularly in luxury and high-end passenger cars, fuels market growth. The shift towards electric vehicles (EVs) also presents opportunities, as IRVMs can incorporate features tailored to EVs, such as improved energy efficiency and integration with infotainment systems. The aftermarket segment is expected to contribute significantly to market growth, driven by the increasing preference for aftermarket upgrades and customization. Geographically, North America and Asia Pacific are major contributors, with the latter experiencing rapid growth due to increasing vehicle production and a burgeoning middle class.
Competition in the automotive IRVM market is intense, with key players like Magna International, Gentex Corporation, and Tokai Rika holding significant market share. These companies are investing heavily in research and development to introduce innovative products featuring advanced functionalities such as auto-dimming, panoramic views, and integrated cameras. However, challenges such as fluctuating raw material prices and stringent government regulations regarding vehicle safety standards could potentially restrain market growth. The market segmentation by vehicle type (passenger car vs. commercial vehicle), powertrain type (ICE vs. electric), and feature type (auto-dimming, prismatic, blind-spot indicators) provides valuable insights into market dynamics and helps identify key growth opportunities. The OEM (original equipment manufacturer) channel remains dominant, although the aftermarket segment shows strong potential for future expansion. Successful players will need to focus on technological innovation, strategic partnerships, and efficient supply chain management to thrive in this competitive landscape.
Automotive IRVM Industry Market Report: 2019-2033
This comprehensive report provides a detailed analysis of the Automotive Interior Rearview Mirror (IRVM) market, encompassing market dynamics, growth trends, regional insights, and competitive landscape. With a focus on the parent market (Automotive Mirrors) and child market (Interior Rearview Mirrors), this report offers invaluable insights for industry professionals, investors, and strategic decision-makers. The study period spans from 2019 to 2033, with 2025 as the base and estimated year. The forecast period is 2025-2033, and the historical period covers 2019-2024. The report projects a market size of xx Million units by 2033.
Automotive IRVM Industry Market Dynamics & Structure
The Automotive IRVM market exhibits a moderately consolidated structure, with key players such as Magna International Inc, Tokai Rika Co Ltd, Gentex Corporation, Mitsuba Corporation, Continental AG, Flabeg Automotive Holding GmbH, Samvardhana Motherson Reflectec, SL Corporation, Ficosa International SA, and Murakami Corporation holding significant market share. Technological innovation, particularly in areas like auto-dimming, blind-spot indicators, and integration with advanced driver-assistance systems (ADAS), is a crucial driver. Stringent safety regulations globally are further shaping the market, pushing for enhanced functionalities and features. The market faces competition from alternative technologies such as digital rearview mirrors and camera-based systems. The automotive industry’s shift towards electric vehicles (EVs) presents both opportunities and challenges, requiring adaptation of IRVM technology for compatibility. Mergers and acquisitions (M&A) activity has been moderate, with strategic partnerships playing a larger role in driving growth and expansion.
- Market Concentration: Moderately consolidated, with top 10 players holding approximately xx% market share in 2024.
- Technological Innovation: Key drivers include ADAS integration, auto-dimming, and improved visibility features.
- Regulatory Frameworks: Stringent safety regulations in developed markets drive adoption of advanced features.
- Competitive Substitutes: Digital rearview mirrors and camera systems pose a competitive threat.
- End-User Demographics: Primarily driven by passenger car segments, with growth expected in commercial vehicles.
- M&A Trends: Moderate M&A activity, with strategic partnerships becoming increasingly prevalent.
Automotive IRVM Industry Growth Trends & Insights
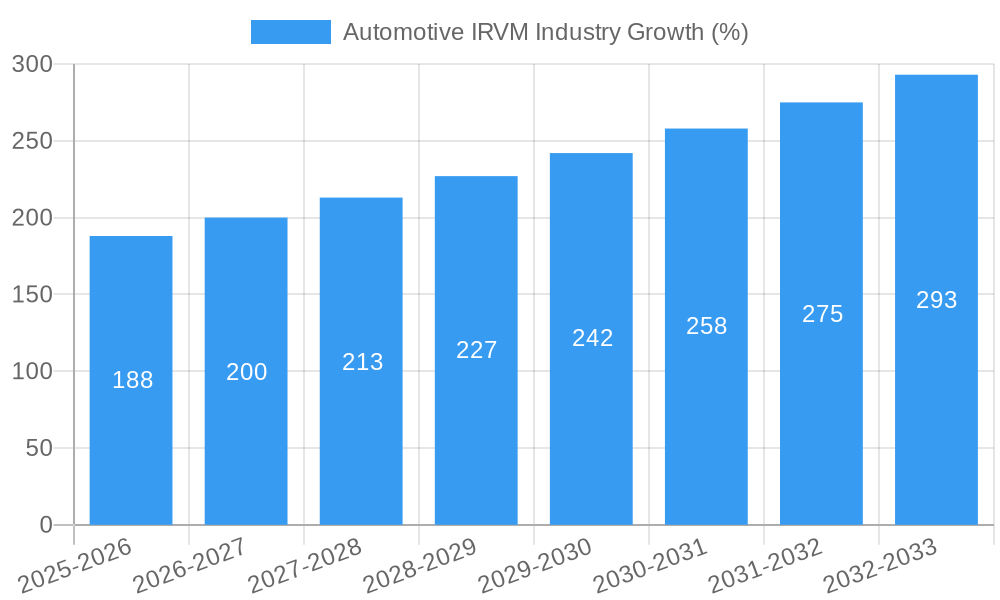
The global Automotive IRVM market witnessed significant growth during the historical period (2019-2024), driven by rising vehicle production and increasing demand for enhanced safety features. The market size is estimated at xx million units in 2025 and is projected to grow at a Compound Annual Growth Rate (CAGR) of xx% during the forecast period (2025-2033). Technological advancements, such as the incorporation of ADAS functionalities and the shift towards digital rearview mirrors, are disrupting the traditional IRVM market. Consumer preference for improved visibility and safety features is boosting market growth. The increasing adoption of EVs is also driving the demand for specialized IRVMs compatible with electric powertrains. Market penetration is increasing in developing economies due to rising vehicle ownership and improving infrastructure.
Dominant Regions, Countries, or Segments in Automotive IRVM Industry
The Asia-Pacific region is currently the dominant market for Automotive IRVMs, driven by high vehicle production in countries like China, India, and Japan. Within the segment breakdown:
- By Vehicle Type: Passenger cars represent the largest segment, followed by commercial vehicles. Growth in the commercial vehicle segment is expected to be faster due to increasing demand for safety features in commercial fleets.
- By Powertrain Type: The Internal Combustion Engine (ICE) segment currently dominates, but the Electric Vehicle (EV) segment is experiencing rapid growth and is expected to become a significant driver in the future.
- By Feature Type: Auto-dimming IRVMs hold the largest market share, followed by prismatic and blind-spot indicator features. Advanced features are witnessing strong growth.
- By Sales Channel Type: Original Equipment Manufacturers (OEMs) represent the primary sales channel, but the aftermarket segment is also experiencing growth, driven by replacement and upgrade needs.
Key drivers in the Asia-Pacific region include favorable government policies supporting automotive manufacturing, expanding road infrastructure, and rising disposable incomes. The North American and European markets are also substantial, with established automotive industries and high safety standards driving growth.
Automotive IRVM Industry Product Landscape
Automotive IRVMs are evolving from basic reflective mirrors to sophisticated integrated systems incorporating various advanced features such as auto-dimming, integrated cameras for rearview and blind-spot monitoring, and even heads-up display (HUD) capabilities. These advancements aim to enhance driver safety, visibility, and convenience. Key performance metrics include clarity, durability, ease of installation, and integration with other vehicle systems. Unique selling propositions (USPs) often involve features like improved night vision, reduced glare, and seamless integration with ADAS.
Key Drivers, Barriers & Challenges in Automotive IRVM Industry
Key Drivers:
- Increasing demand for enhanced vehicle safety features.
- Technological advancements, leading to improved performance and functionality.
- Stringent government regulations regarding vehicle safety standards.
- Rising disposable incomes and increasing vehicle ownership in developing countries.
Challenges and Restraints:
- High initial investment costs associated with advanced features.
- Intense competition from alternative technologies (e.g., digital rearview mirrors).
- Supply chain disruptions impacting the availability of raw materials and components.
- Potential regulatory hurdles in different markets.
Emerging Opportunities in Automotive IRVM Industry
- Expansion into developing markets with growing vehicle ownership.
- Development of integrated solutions combining IRVMs with ADAS functionalities.
- Growing demand for customized and high-end features in luxury vehicles.
- Exploration of new materials and technologies to enhance durability and performance.
Growth Accelerators in the Automotive IRVM Industry Industry
Technological breakthroughs in areas such as improved camera resolution and sensor technology are driving the integration of advanced features. Strategic partnerships between automotive manufacturers and technology providers are enhancing innovation and streamlining production processes. The ongoing expansion of the global automotive market, particularly in developing countries, presents significant growth opportunities.
Key Players Shaping the Automotive IRVM Market
- Magna International Inc
- Tokai Rika Co Ltd
- Gentex Corporation
- Mitsuba Corporation
- Continental AG
- Flabeg Automotive Holding GmbH
- Samvardhana Motherson Reflectec
- SL Corporation
- Ficosa International SA
- Murakami Corporation
Notable Milestones in Automotive IRVM Industry Sector
- September 2022: OMNIVISION and Analog Devices partnered to offer a camera system enabling seamless HD upgrades for automotive OEMs.
- August 2022: Gentex announced a $300 million investment in a new manufacturing facility, expanding its capacity for auto-dimming mirrors. In 2021, Gentex distributed 27.2 million interior automatic-dimming mirrors.
- August 2022: Holitech Europe GmbH announced development of various video cameras for rearview applications and ADAS integration.
In-Depth Automotive IRVM Industry Market Outlook
The future of the Automotive IRVM market is bright, driven by continuous technological innovation, rising demand for safety features, and growth in the global automotive industry. Strategic partnerships and investments in R&D will further accelerate the adoption of advanced functionalities, expanding market opportunities for key players. The increasing penetration of EVs presents a key area of growth, requiring specialized solutions to meet the unique requirements of electric powertrains. The market is poised for continued growth, driven by factors outlined above, and is expected to see strong expansion throughout the forecast period.
Automotive IRVM Industry Segmentation
-
1. Vehicle Type
- 1.1. Passenger Car
- 1.2. Commercial Vehicle
-
2. Powertrain Type
- 2.1. ICE
- 2.2. Electric
-
3. Feature Type
- 3.1. Auto-Dimming
- 3.2. Prismatic
- 3.3. Blind spot indicator
-
4. Sales Channel Type
- 4.1. OEM
- 4.2. Aftermarket
Automotive IRVM Industry Segmentation By Geography
-
1. North America
- 1.1. United States
- 1.2. Canada
- 1.3. Rest of North America
-
2. Europe
- 2.1. Germany
- 2.2. United Kingdom
- 2.3. France
- 2.4. Rest of Europe
-
3. Asia Pacific
- 3.1. India
- 3.2. China
- 3.3. Japan
- 3.4. South Korea
- 3.5. Rest of Asia Pacific
-
4. Rest of the World
- 4.1. Brazil
- 4.2. United Arab Emirates
- 4.3. Other Countries
Automotive IRVM Industry REPORT HIGHLIGHTS
| Aspects | Details |
|---|---|
| Study Period | 2019-2033 |
| Base Year | 2024 |
| Estimated Year | 2025 |
| Forecast Period | 2025-2033 |
| Historical Period | 2019-2024 |
| Growth Rate | CAGR of 5.82% from 2019-2033 |
| Segmentation |
|
Table of Contents
- 1. Introduction
- 1.1. Research Scope
- 1.2. Market Segmentation
- 1.3. Research Methodology
- 1.4. Definitions and Assumptions
- 2. Executive Summary
- 2.1. Introduction
- 3. Market Dynamics
- 3.1. Introduction
- 3.2. Market Drivers
- 3.2.1. Surge in Awareness About the Benefits of Leasing; Shift in Trends Towards Rental
- 3.3. Market Restrains
- 3.3.1. Labor Shortage may obstruct the market growth; The economic downturn in the equipment leasing sector will impede market expansion
- 3.4. Market Trends
- 3.4.1. Passenger Car Segment Likely to Hold Significant Share in the Market
- 4. Market Factor Analysis
- 4.1. Porters Five Forces
- 4.2. Supply/Value Chain
- 4.3. PESTEL analysis
- 4.4. Market Entropy
- 4.5. Patent/Trademark Analysis
- 5. Global Automotive IRVM Industry Analysis, Insights and Forecast, 2019-2031
- 5.1. Market Analysis, Insights and Forecast - by Vehicle Type
- 5.1.1. Passenger Car
- 5.1.2. Commercial Vehicle
- 5.2. Market Analysis, Insights and Forecast - by Powertrain Type
- 5.2.1. ICE
- 5.2.2. Electric
- 5.3. Market Analysis, Insights and Forecast - by Feature Type
- 5.3.1. Auto-Dimming
- 5.3.2. Prismatic
- 5.3.3. Blind spot indicator
- 5.4. Market Analysis, Insights and Forecast - by Sales Channel Type
- 5.4.1. OEM
- 5.4.2. Aftermarket
- 5.5. Market Analysis, Insights and Forecast - by Region
- 5.5.1. North America
- 5.5.2. Europe
- 5.5.3. Asia Pacific
- 5.5.4. Rest of the World
- 5.1. Market Analysis, Insights and Forecast - by Vehicle Type
- 6. North America Automotive IRVM Industry Analysis, Insights and Forecast, 2019-2031
- 6.1. Market Analysis, Insights and Forecast - by Vehicle Type
- 6.1.1. Passenger Car
- 6.1.2. Commercial Vehicle
- 6.2. Market Analysis, Insights and Forecast - by Powertrain Type
- 6.2.1. ICE
- 6.2.2. Electric
- 6.3. Market Analysis, Insights and Forecast - by Feature Type
- 6.3.1. Auto-Dimming
- 6.3.2. Prismatic
- 6.3.3. Blind spot indicator
- 6.4. Market Analysis, Insights and Forecast - by Sales Channel Type
- 6.4.1. OEM
- 6.4.2. Aftermarket
- 6.1. Market Analysis, Insights and Forecast - by Vehicle Type
- 7. Europe Automotive IRVM Industry Analysis, Insights and Forecast, 2019-2031
- 7.1. Market Analysis, Insights and Forecast - by Vehicle Type
- 7.1.1. Passenger Car
- 7.1.2. Commercial Vehicle
- 7.2. Market Analysis, Insights and Forecast - by Powertrain Type
- 7.2.1. ICE
- 7.2.2. Electric
- 7.3. Market Analysis, Insights and Forecast - by Feature Type
- 7.3.1. Auto-Dimming
- 7.3.2. Prismatic
- 7.3.3. Blind spot indicator
- 7.4. Market Analysis, Insights and Forecast - by Sales Channel Type
- 7.4.1. OEM
- 7.4.2. Aftermarket
- 7.1. Market Analysis, Insights and Forecast - by Vehicle Type
- 8. Asia Pacific Automotive IRVM Industry Analysis, Insights and Forecast, 2019-2031
- 8.1. Market Analysis, Insights and Forecast - by Vehicle Type
- 8.1.1. Passenger Car
- 8.1.2. Commercial Vehicle
- 8.2. Market Analysis, Insights and Forecast - by Powertrain Type
- 8.2.1. ICE
- 8.2.2. Electric
- 8.3. Market Analysis, Insights and Forecast - by Feature Type
- 8.3.1. Auto-Dimming
- 8.3.2. Prismatic
- 8.3.3. Blind spot indicator
- 8.4. Market Analysis, Insights and Forecast - by Sales Channel Type
- 8.4.1. OEM
- 8.4.2. Aftermarket
- 8.1. Market Analysis, Insights and Forecast - by Vehicle Type
- 9. Rest of the World Automotive IRVM Industry Analysis, Insights and Forecast, 2019-2031
- 9.1. Market Analysis, Insights and Forecast - by Vehicle Type
- 9.1.1. Passenger Car
- 9.1.2. Commercial Vehicle
- 9.2. Market Analysis, Insights and Forecast - by Powertrain Type
- 9.2.1. ICE
- 9.2.2. Electric
- 9.3. Market Analysis, Insights and Forecast - by Feature Type
- 9.3.1. Auto-Dimming
- 9.3.2. Prismatic
- 9.3.3. Blind spot indicator
- 9.4. Market Analysis, Insights and Forecast - by Sales Channel Type
- 9.4.1. OEM
- 9.4.2. Aftermarket
- 9.1. Market Analysis, Insights and Forecast - by Vehicle Type
- 10. North America Automotive IRVM Industry Analysis, Insights and Forecast, 2019-2031
- 10.1. Market Analysis, Insights and Forecast - By Country/Sub-region
- 10.1.1 United States
- 10.1.2 Canada
- 10.1.3 Rest of North America
- 11. Europe Automotive IRVM Industry Analysis, Insights and Forecast, 2019-2031
- 11.1. Market Analysis, Insights and Forecast - By Country/Sub-region
- 11.1.1 Germany
- 11.1.2 United Kingdom
- 11.1.3 France
- 11.1.4 Rest of Europe
- 12. Asia Pacific Automotive IRVM Industry Analysis, Insights and Forecast, 2019-2031
- 12.1. Market Analysis, Insights and Forecast - By Country/Sub-region
- 12.1.1 India
- 12.1.2 China
- 12.1.3 Japan
- 12.1.4 South Korea
- 12.1.5 Rest of Asia Pacific
- 13. Rest of the World Automotive IRVM Industry Analysis, Insights and Forecast, 2019-2031
- 13.1. Market Analysis, Insights and Forecast - By Country/Sub-region
- 13.1.1 Brazil
- 13.1.2 United Arab Emirates
- 13.1.3 Other Countries
- 14. Competitive Analysis
- 14.1. Global Market Share Analysis 2024
- 14.2. Company Profiles
- 14.2.1 Magna International Inc
- 14.2.1.1. Overview
- 14.2.1.2. Products
- 14.2.1.3. SWOT Analysis
- 14.2.1.4. Recent Developments
- 14.2.1.5. Financials (Based on Availability)
- 14.2.2 Tokai Rika Co Ltd
- 14.2.2.1. Overview
- 14.2.2.2. Products
- 14.2.2.3. SWOT Analysis
- 14.2.2.4. Recent Developments
- 14.2.2.5. Financials (Based on Availability)
- 14.2.3 Gentex Corporation
- 14.2.3.1. Overview
- 14.2.3.2. Products
- 14.2.3.3. SWOT Analysis
- 14.2.3.4. Recent Developments
- 14.2.3.5. Financials (Based on Availability)
- 14.2.4 Mitsuba Corporation
- 14.2.4.1. Overview
- 14.2.4.2. Products
- 14.2.4.3. SWOT Analysis
- 14.2.4.4. Recent Developments
- 14.2.4.5. Financials (Based on Availability)
- 14.2.5 Continental AG
- 14.2.5.1. Overview
- 14.2.5.2. Products
- 14.2.5.3. SWOT Analysis
- 14.2.5.4. Recent Developments
- 14.2.5.5. Financials (Based on Availability)
- 14.2.6 Flabeg Automotive Holding GmbH*List Not Exhaustive
- 14.2.6.1. Overview
- 14.2.6.2. Products
- 14.2.6.3. SWOT Analysis
- 14.2.6.4. Recent Developments
- 14.2.6.5. Financials (Based on Availability)
- 14.2.7 Samvardhana Motherson Reflectec
- 14.2.7.1. Overview
- 14.2.7.2. Products
- 14.2.7.3. SWOT Analysis
- 14.2.7.4. Recent Developments
- 14.2.7.5. Financials (Based on Availability)
- 14.2.8 SL Corporation
- 14.2.8.1. Overview
- 14.2.8.2. Products
- 14.2.8.3. SWOT Analysis
- 14.2.8.4. Recent Developments
- 14.2.8.5. Financials (Based on Availability)
- 14.2.9 Ficosa International SA
- 14.2.9.1. Overview
- 14.2.9.2. Products
- 14.2.9.3. SWOT Analysis
- 14.2.9.4. Recent Developments
- 14.2.9.5. Financials (Based on Availability)
- 14.2.10 Murakami Corporation
- 14.2.10.1. Overview
- 14.2.10.2. Products
- 14.2.10.3. SWOT Analysis
- 14.2.10.4. Recent Developments
- 14.2.10.5. Financials (Based on Availability)
- 14.2.1 Magna International Inc
List of Figures
- Figure 1: Global Automotive IRVM Industry Revenue Breakdown (Million, %) by Region 2024 & 2032
- Figure 2: North America Automotive IRVM Industry Revenue (Million), by Country 2024 & 2032
- Figure 3: North America Automotive IRVM Industry Revenue Share (%), by Country 2024 & 2032
- Figure 4: Europe Automotive IRVM Industry Revenue (Million), by Country 2024 & 2032
- Figure 5: Europe Automotive IRVM Industry Revenue Share (%), by Country 2024 & 2032
- Figure 6: Asia Pacific Automotive IRVM Industry Revenue (Million), by Country 2024 & 2032
- Figure 7: Asia Pacific Automotive IRVM Industry Revenue Share (%), by Country 2024 & 2032
- Figure 8: Rest of the World Automotive IRVM Industry Revenue (Million), by Country 2024 & 2032
- Figure 9: Rest of the World Automotive IRVM Industry Revenue Share (%), by Country 2024 & 2032
- Figure 10: North America Automotive IRVM Industry Revenue (Million), by Vehicle Type 2024 & 2032
- Figure 11: North America Automotive IRVM Industry Revenue Share (%), by Vehicle Type 2024 & 2032
- Figure 12: North America Automotive IRVM Industry Revenue (Million), by Powertrain Type 2024 & 2032
- Figure 13: North America Automotive IRVM Industry Revenue Share (%), by Powertrain Type 2024 & 2032
- Figure 14: North America Automotive IRVM Industry Revenue (Million), by Feature Type 2024 & 2032
- Figure 15: North America Automotive IRVM Industry Revenue Share (%), by Feature Type 2024 & 2032
- Figure 16: North America Automotive IRVM Industry Revenue (Million), by Sales Channel Type 2024 & 2032
- Figure 17: North America Automotive IRVM Industry Revenue Share (%), by Sales Channel Type 2024 & 2032
- Figure 18: North America Automotive IRVM Industry Revenue (Million), by Country 2024 & 2032
- Figure 19: North America Automotive IRVM Industry Revenue Share (%), by Country 2024 & 2032
- Figure 20: Europe Automotive IRVM Industry Revenue (Million), by Vehicle Type 2024 & 2032
- Figure 21: Europe Automotive IRVM Industry Revenue Share (%), by Vehicle Type 2024 & 2032
- Figure 22: Europe Automotive IRVM Industry Revenue (Million), by Powertrain Type 2024 & 2032
- Figure 23: Europe Automotive IRVM Industry Revenue Share (%), by Powertrain Type 2024 & 2032
- Figure 24: Europe Automotive IRVM Industry Revenue (Million), by Feature Type 2024 & 2032
- Figure 25: Europe Automotive IRVM Industry Revenue Share (%), by Feature Type 2024 & 2032
- Figure 26: Europe Automotive IRVM Industry Revenue (Million), by Sales Channel Type 2024 & 2032
- Figure 27: Europe Automotive IRVM Industry Revenue Share (%), by Sales Channel Type 2024 & 2032
- Figure 28: Europe Automotive IRVM Industry Revenue (Million), by Country 2024 & 2032
- Figure 29: Europe Automotive IRVM Industry Revenue Share (%), by Country 2024 & 2032
- Figure 30: Asia Pacific Automotive IRVM Industry Revenue (Million), by Vehicle Type 2024 & 2032
- Figure 31: Asia Pacific Automotive IRVM Industry Revenue Share (%), by Vehicle Type 2024 & 2032
- Figure 32: Asia Pacific Automotive IRVM Industry Revenue (Million), by Powertrain Type 2024 & 2032
- Figure 33: Asia Pacific Automotive IRVM Industry Revenue Share (%), by Powertrain Type 2024 & 2032
- Figure 34: Asia Pacific Automotive IRVM Industry Revenue (Million), by Feature Type 2024 & 2032
- Figure 35: Asia Pacific Automotive IRVM Industry Revenue Share (%), by Feature Type 2024 & 2032
- Figure 36: Asia Pacific Automotive IRVM Industry Revenue (Million), by Sales Channel Type 2024 & 2032
- Figure 37: Asia Pacific Automotive IRVM Industry Revenue Share (%), by Sales Channel Type 2024 & 2032
- Figure 38: Asia Pacific Automotive IRVM Industry Revenue (Million), by Country 2024 & 2032
- Figure 39: Asia Pacific Automotive IRVM Industry Revenue Share (%), by Country 2024 & 2032
- Figure 40: Rest of the World Automotive IRVM Industry Revenue (Million), by Vehicle Type 2024 & 2032
- Figure 41: Rest of the World Automotive IRVM Industry Revenue Share (%), by Vehicle Type 2024 & 2032
- Figure 42: Rest of the World Automotive IRVM Industry Revenue (Million), by Powertrain Type 2024 & 2032
- Figure 43: Rest of the World Automotive IRVM Industry Revenue Share (%), by Powertrain Type 2024 & 2032
- Figure 44: Rest of the World Automotive IRVM Industry Revenue (Million), by Feature Type 2024 & 2032
- Figure 45: Rest of the World Automotive IRVM Industry Revenue Share (%), by Feature Type 2024 & 2032
- Figure 46: Rest of the World Automotive IRVM Industry Revenue (Million), by Sales Channel Type 2024 & 2032
- Figure 47: Rest of the World Automotive IRVM Industry Revenue Share (%), by Sales Channel Type 2024 & 2032
- Figure 48: Rest of the World Automotive IRVM Industry Revenue (Million), by Country 2024 & 2032
- Figure 49: Rest of the World Automotive IRVM Industry Revenue Share (%), by Country 2024 & 2032
List of Tables
- Table 1: Global Automotive IRVM Industry Revenue Million Forecast, by Region 2019 & 2032
- Table 2: Global Automotive IRVM Industry Revenue Million Forecast, by Vehicle Type 2019 & 2032
- Table 3: Global Automotive IRVM Industry Revenue Million Forecast, by Powertrain Type 2019 & 2032
- Table 4: Global Automotive IRVM Industry Revenue Million Forecast, by Feature Type 2019 & 2032
- Table 5: Global Automotive IRVM Industry Revenue Million Forecast, by Sales Channel Type 2019 & 2032
- Table 6: Global Automotive IRVM Industry Revenue Million Forecast, by Region 2019 & 2032
- Table 7: Global Automotive IRVM Industry Revenue Million Forecast, by Country 2019 & 2032
- Table 8: United States Automotive IRVM Industry Revenue (Million) Forecast, by Application 2019 & 2032
- Table 9: Canada Automotive IRVM Industry Revenue (Million) Forecast, by Application 2019 & 2032
- Table 10: Rest of North America Automotive IRVM Industry Revenue (Million) Forecast, by Application 2019 & 2032
- Table 11: Global Automotive IRVM Industry Revenue Million Forecast, by Country 2019 & 2032
- Table 12: Germany Automotive IRVM Industry Revenue (Million) Forecast, by Application 2019 & 2032
- Table 13: United Kingdom Automotive IRVM Industry Revenue (Million) Forecast, by Application 2019 & 2032
- Table 14: France Automotive IRVM Industry Revenue (Million) Forecast, by Application 2019 & 2032
- Table 15: Rest of Europe Automotive IRVM Industry Revenue (Million) Forecast, by Application 2019 & 2032
- Table 16: Global Automotive IRVM Industry Revenue Million Forecast, by Country 2019 & 2032
- Table 17: India Automotive IRVM Industry Revenue (Million) Forecast, by Application 2019 & 2032
- Table 18: China Automotive IRVM Industry Revenue (Million) Forecast, by Application 2019 & 2032
- Table 19: Japan Automotive IRVM Industry Revenue (Million) Forecast, by Application 2019 & 2032
- Table 20: South Korea Automotive IRVM Industry Revenue (Million) Forecast, by Application 2019 & 2032
- Table 21: Rest of Asia Pacific Automotive IRVM Industry Revenue (Million) Forecast, by Application 2019 & 2032
- Table 22: Global Automotive IRVM Industry Revenue Million Forecast, by Country 2019 & 2032
- Table 23: Brazil Automotive IRVM Industry Revenue (Million) Forecast, by Application 2019 & 2032
- Table 24: United Arab Emirates Automotive IRVM Industry Revenue (Million) Forecast, by Application 2019 & 2032
- Table 25: Other Countries Automotive IRVM Industry Revenue (Million) Forecast, by Application 2019 & 2032
- Table 26: Global Automotive IRVM Industry Revenue Million Forecast, by Vehicle Type 2019 & 2032
- Table 27: Global Automotive IRVM Industry Revenue Million Forecast, by Powertrain Type 2019 & 2032
- Table 28: Global Automotive IRVM Industry Revenue Million Forecast, by Feature Type 2019 & 2032
- Table 29: Global Automotive IRVM Industry Revenue Million Forecast, by Sales Channel Type 2019 & 2032
- Table 30: Global Automotive IRVM Industry Revenue Million Forecast, by Country 2019 & 2032
- Table 31: United States Automotive IRVM Industry Revenue (Million) Forecast, by Application 2019 & 2032
- Table 32: Canada Automotive IRVM Industry Revenue (Million) Forecast, by Application 2019 & 2032
- Table 33: Rest of North America Automotive IRVM Industry Revenue (Million) Forecast, by Application 2019 & 2032
- Table 34: Global Automotive IRVM Industry Revenue Million Forecast, by Vehicle Type 2019 & 2032
- Table 35: Global Automotive IRVM Industry Revenue Million Forecast, by Powertrain Type 2019 & 2032
- Table 36: Global Automotive IRVM Industry Revenue Million Forecast, by Feature Type 2019 & 2032
- Table 37: Global Automotive IRVM Industry Revenue Million Forecast, by Sales Channel Type 2019 & 2032
- Table 38: Global Automotive IRVM Industry Revenue Million Forecast, by Country 2019 & 2032
- Table 39: Germany Automotive IRVM Industry Revenue (Million) Forecast, by Application 2019 & 2032
- Table 40: United Kingdom Automotive IRVM Industry Revenue (Million) Forecast, by Application 2019 & 2032
- Table 41: France Automotive IRVM Industry Revenue (Million) Forecast, by Application 2019 & 2032
- Table 42: Rest of Europe Automotive IRVM Industry Revenue (Million) Forecast, by Application 2019 & 2032
- Table 43: Global Automotive IRVM Industry Revenue Million Forecast, by Vehicle Type 2019 & 2032
- Table 44: Global Automotive IRVM Industry Revenue Million Forecast, by Powertrain Type 2019 & 2032
- Table 45: Global Automotive IRVM Industry Revenue Million Forecast, by Feature Type 2019 & 2032
- Table 46: Global Automotive IRVM Industry Revenue Million Forecast, by Sales Channel Type 2019 & 2032
- Table 47: Global Automotive IRVM Industry Revenue Million Forecast, by Country 2019 & 2032
- Table 48: India Automotive IRVM Industry Revenue (Million) Forecast, by Application 2019 & 2032
- Table 49: China Automotive IRVM Industry Revenue (Million) Forecast, by Application 2019 & 2032
- Table 50: Japan Automotive IRVM Industry Revenue (Million) Forecast, by Application 2019 & 2032
- Table 51: South Korea Automotive IRVM Industry Revenue (Million) Forecast, by Application 2019 & 2032
- Table 52: Rest of Asia Pacific Automotive IRVM Industry Revenue (Million) Forecast, by Application 2019 & 2032
- Table 53: Global Automotive IRVM Industry Revenue Million Forecast, by Vehicle Type 2019 & 2032
- Table 54: Global Automotive IRVM Industry Revenue Million Forecast, by Powertrain Type 2019 & 2032
- Table 55: Global Automotive IRVM Industry Revenue Million Forecast, by Feature Type 2019 & 2032
- Table 56: Global Automotive IRVM Industry Revenue Million Forecast, by Sales Channel Type 2019 & 2032
- Table 57: Global Automotive IRVM Industry Revenue Million Forecast, by Country 2019 & 2032
- Table 58: Brazil Automotive IRVM Industry Revenue (Million) Forecast, by Application 2019 & 2032
- Table 59: United Arab Emirates Automotive IRVM Industry Revenue (Million) Forecast, by Application 2019 & 2032
- Table 60: Other Countries Automotive IRVM Industry Revenue (Million) Forecast, by Application 2019 & 2032
Frequently Asked Questions
1. What is the projected Compound Annual Growth Rate (CAGR) of the Automotive IRVM Industry?
The projected CAGR is approximately 5.82%.
2. Which companies are prominent players in the Automotive IRVM Industry?
Key companies in the market include Magna International Inc, Tokai Rika Co Ltd, Gentex Corporation, Mitsuba Corporation, Continental AG, Flabeg Automotive Holding GmbH*List Not Exhaustive, Samvardhana Motherson Reflectec, SL Corporation, Ficosa International SA, Murakami Corporation.
3. What are the main segments of the Automotive IRVM Industry?
The market segments include Vehicle Type, Powertrain Type, Feature Type, Sales Channel Type.
4. Can you provide details about the market size?
The market size is estimated to be USD 3.08 Million as of 2022.
5. What are some drivers contributing to market growth?
Surge in Awareness About the Benefits of Leasing; Shift in Trends Towards Rental.
6. What are the notable trends driving market growth?
Passenger Car Segment Likely to Hold Significant Share in the Market.
7. Are there any restraints impacting market growth?
Labor Shortage may obstruct the market growth; The economic downturn in the equipment leasing sector will impede market expansion.
8. Can you provide examples of recent developments in the market?
In September 2022, OMNIVISION has partnered with Analog Devices, Inc. (ADI) to provide a camera system that allows automotive OEMs to seamlessly upgrade from SD to HD resolution while maintaining exceptional performance and the lowest system cost. The solution features OMNIVISION's OX01F10 1.3-megapixel (MP) SoC coupled with ADI's C2B Car Camera Bus (C2B) link technology for entry-level HD rear-view (RVC) and surround-view (SVS) cameras and e-mirrors.
9. What pricing options are available for accessing the report?
Pricing options include single-user, multi-user, and enterprise licenses priced at USD 4750, USD 5250, and USD 8750 respectively.
10. Is the market size provided in terms of value or volume?
The market size is provided in terms of value, measured in Million.
11. Are there any specific market keywords associated with the report?
Yes, the market keyword associated with the report is "Automotive IRVM Industry," which aids in identifying and referencing the specific market segment covered.
12. How do I determine which pricing option suits my needs best?
The pricing options vary based on user requirements and access needs. Individual users may opt for single-user licenses, while businesses requiring broader access may choose multi-user or enterprise licenses for cost-effective access to the report.
13. Are there any additional resources or data provided in the Automotive IRVM Industry report?
While the report offers comprehensive insights, it's advisable to review the specific contents or supplementary materials provided to ascertain if additional resources or data are available.
14. How can I stay updated on further developments or reports in the Automotive IRVM Industry?
To stay informed about further developments, trends, and reports in the Automotive IRVM Industry, consider subscribing to industry newsletters, following relevant companies and organizations, or regularly checking reputable industry news sources and publications.
Methodology
Step 1 - Identification of Relevant Samples Size from Population Database


Step 2 - Approaches for Defining Global Market Size (Value, Volume* & Price*)

Note*: In applicable scenarios
Step 3 - Data Sources
Primary Research
- Web Analytics
- Survey Reports
- Research Institute
- Latest Research Reports
- Opinion Leaders
Secondary Research
- Annual Reports
- White Paper
- Latest Press Release
- Industry Association
- Paid Database
- Investor Presentations

Step 4 - Data Triangulation
Involves using different sources of information in order to increase the validity of a study
These sources are likely to be stakeholders in a program - participants, other researchers, program staff, other community members, and so on.
Then we put all data in single framework & apply various statistical tools to find out the dynamic on the market.
During the analysis stage, feedback from the stakeholder groups would be compared to determine areas of agreement as well as areas of divergence


