
Key Insights
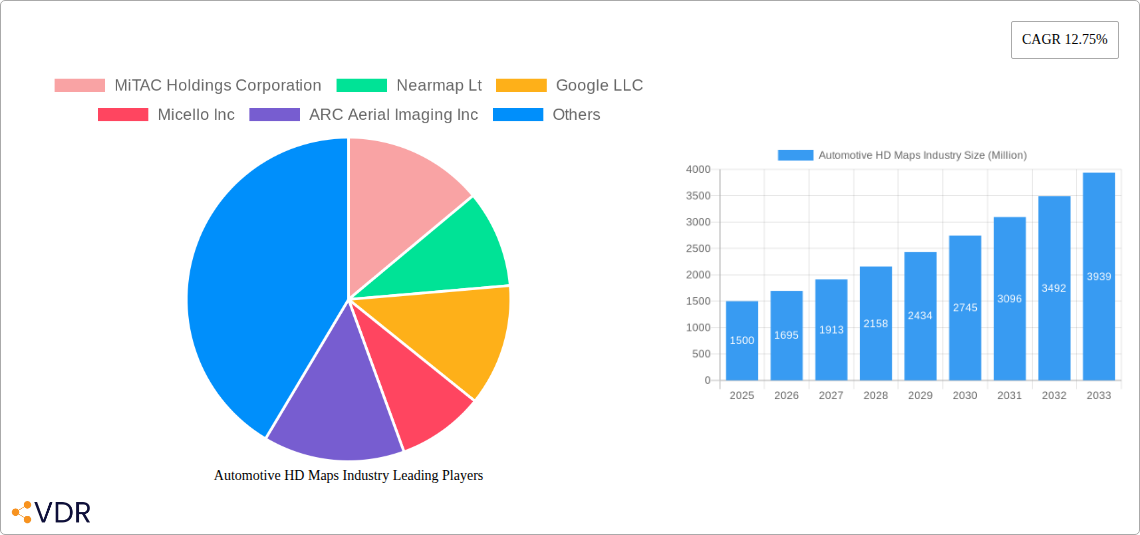
The Automotive HD Maps market is experiencing robust growth, driven by the burgeoning adoption of autonomous vehicles, advanced driver-assistance systems (ADAS), and fleet management solutions. The market's Compound Annual Growth Rate (CAGR) of 12.75% from 2019 to 2024 suggests a significant expansion, projected to continue through 2033. Key drivers include increasing demand for enhanced safety features in vehicles, the need for precise localization in autonomous driving, and the rising adoption of connected car technologies. The market is segmented into components (solutions and services) and applications (autonomous cars, fleet management, and ADAS). Solutions encompass map data creation, processing, and distribution, while services include map updates and maintenance. Autonomous vehicles represent the largest application segment, fueled by the development of self-driving technology and the associated need for highly accurate and detailed map data. While technological advancements are driving growth, challenges remain, including high initial investment costs for map creation and maintenance, the need for continuous data updates to reflect dynamic road conditions, and ensuring data privacy and security. North America, particularly the United States, currently holds a substantial market share due to early adoption and strong technological advancements. However, rapid technological growth in Asia-Pacific regions, especially China and Japan, indicates a significant shift in geographical market dominance is expected in the coming years.
The competitive landscape is characterized by a mix of established technology companies, specialized mapping providers, and automotive manufacturers. Companies like Google, TomTom, HERE Technologies, and Apple are major players, leveraging their existing infrastructure and expertise to develop and offer comprehensive HD map solutions. The market is witnessing increased partnerships and collaborations to address the complex challenges of data acquisition, processing, and integration. The future growth of the Automotive HD Maps market will be influenced by factors such as the pace of autonomous vehicle adoption, government regulations promoting autonomous driving, and the development of innovative mapping technologies. Further advancements in sensor technology and artificial intelligence (AI) will play a crucial role in improving map accuracy, real-time updates, and overall functionality. The market will likely see increased focus on data security, privacy concerns, and standardization efforts to ensure interoperability and seamless integration across various automotive platforms.
Automotive HD Maps Industry: A Comprehensive Market Report (2019-2033)
This in-depth report provides a comprehensive analysis of the Automotive HD Maps industry, covering market dynamics, growth trends, key players, and future outlook. The report examines the parent market of automotive technology and its child market segment of high-definition mapping, providing crucial insights for industry professionals, investors, and strategists. The study period spans 2019-2033, with a base year of 2025 and a forecast period of 2025-2033. Market values are presented in million units.
Automotive HD Maps Industry Market Dynamics & Structure
The Automotive HD Maps market is characterized by a moderately concentrated structure with several key players vying for market share. Technological innovation, particularly in sensor technology, AI, and data processing, is a major driver. Stringent regulatory frameworks concerning data privacy and map accuracy significantly impact market development. Competitive substitutes, such as traditional navigation systems, are gradually losing ground due to the superior accuracy and functionality of HD maps. The end-user demographic primarily includes autonomous vehicle developers, fleet management companies, and ADAS manufacturers. M&A activity has been moderate, with xx deals recorded between 2019 and 2024.
- Market Concentration: Moderately concentrated, with the top 5 players holding an estimated xx% market share in 2025.
- Technological Innovation: Rapid advancements in sensor fusion, AI-powered map creation, and edge computing are key drivers.
- Regulatory Framework: Data privacy regulations and standardization efforts influence market growth and adoption.
- Competitive Substitutes: Traditional navigation systems face increasing competition from HD maps.
- End-User Demographics: Autonomous vehicle developers, fleet management companies, and ADAS manufacturers.
- M&A Trends: xx M&A deals recorded between 2019 and 2024, indicating consolidation within the industry.
Automotive HD Maps Industry Growth Trends & Insights
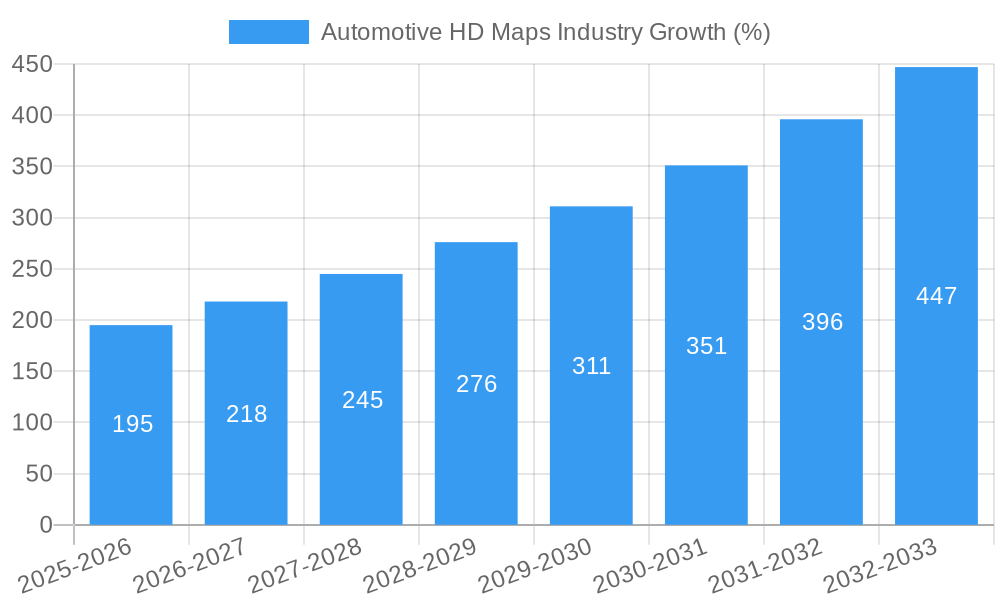
The Automotive HD Maps market experienced significant growth between 2019 and 2024, driven by the increasing adoption of autonomous vehicles and ADAS. The market size reached xx million units in 2024 and is projected to reach xx million units by 2033, exhibiting a CAGR of xx% during the forecast period. This growth is fueled by technological advancements, rising consumer demand for enhanced safety features, and supportive government policies promoting autonomous driving initiatives. Market penetration for HD maps in autonomous vehicles is expected to increase from xx% in 2024 to xx% by 2033. Disruptions from new entrants and evolving consumer preferences (e.g., demand for personalized mapping solutions) continue to shape the market.
Dominant Regions, Countries, or Segments in Automotive HD Maps Industry
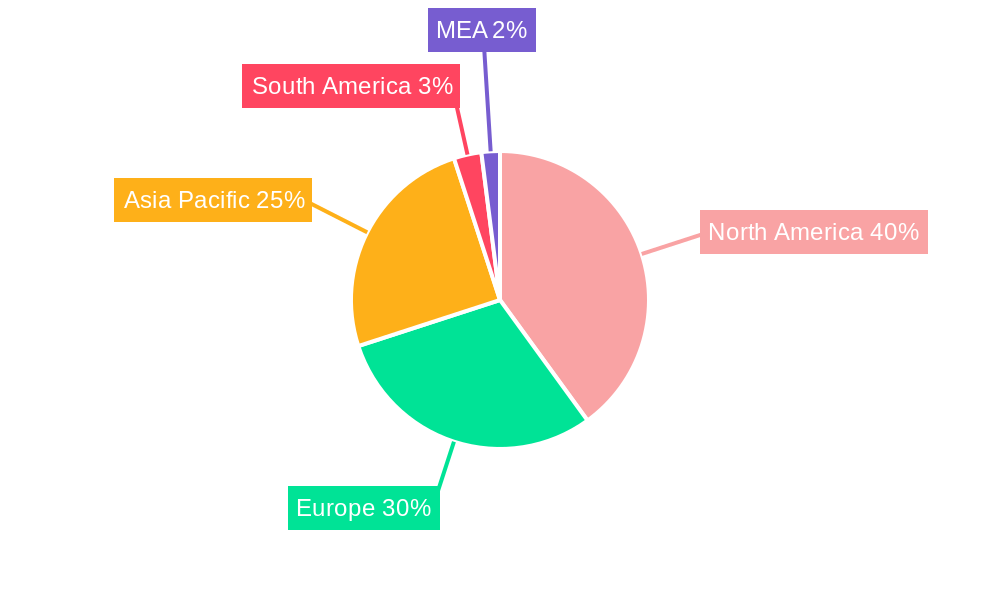
North America currently holds the largest market share in the Automotive HD Maps industry, driven by strong investments in autonomous vehicle technology and well-established infrastructure for data collection and processing. Within the segments, the autonomous vehicles application segment is the most dominant, followed by ADAS and fleet management. The Solutions segment holds a larger market share than Services due to the high initial investment in HD map creation and data acquisition.
- Key Drivers in North America: Significant investments in AV technology, well-developed infrastructure, and supportive government regulations.
- Europe: Strong growth driven by government initiatives supporting autonomous driving and stringent vehicle safety standards.
- Asia-Pacific: Rapid market expansion, fueled by increasing vehicle production and government investments in smart city infrastructure.
- Dominant Segments: Autonomous Cars (largest market share), followed by ADAS and Fleet Management.
- Component Dominance: Solutions segment holds a larger share than Services segment, driven by high initial investment in data acquisition and map creation.
Automotive HD Maps Industry Product Landscape
The Automotive HD Maps market offers a range of products, including highly accurate lane-level maps, 3D point cloud maps, and real-time map updates. These maps are designed to cater to the specific needs of autonomous vehicles, fleet management systems, and ADAS. Key differentiators include map accuracy, update frequency, data richness, and integration capabilities with other vehicle systems. Technological advancements focus on incorporating sensor data fusion, AI-powered map generation, and edge computing to enhance map accuracy and real-time capabilities. The unique selling propositions of various products often center on improved precision, dynamic updates, and customized solutions for specific applications.
Key Drivers, Barriers & Challenges in Automotive HD Maps Industry
Key Drivers: The proliferation of autonomous vehicles, the increasing demand for advanced driver-assistance systems, and government initiatives promoting smart city infrastructure are major drivers. Technological advancements in sensor technology, AI, and data processing further accelerate market growth.
Key Challenges & Restraints: High initial investment costs, data privacy concerns, map accuracy challenges, and competition from established players are major challenges. Supply chain disruptions can impact the timely delivery of maps. Regulatory hurdles related to data usage and map standards create barriers to entry. The xx% market share held by established players creates significant competitive pressure for new entrants.
Emerging Opportunities in Automotive HD Maps Industry
Emerging opportunities lie in expanding into untapped markets such as developing economies, and developing new applications for HD maps such as augmented reality navigation, and integrating HD maps with other smart city technologies. Furthermore, focusing on personalized mapping solutions and the growing demand for high-precision maps for robotics and drone applications provide lucrative prospects. The development of more efficient and cost-effective HD map generation technologies will also open up new opportunities.
Growth Accelerators in the Automotive HD Maps Industry
Technological breakthroughs in AI and sensor fusion will continue to be significant growth accelerators. Strategic partnerships between map providers, automakers, and technology companies will further facilitate market expansion. Government support for autonomous driving initiatives and the increasing adoption of ADAS will also propel market growth. Furthermore, advancements in edge computing and the development of 5G networks will support the faster processing and distribution of real-time map updates.
Key Players Shaping the Automotive HD Maps Industry Market
- MiTAC Holdings Corporation
- Nearmap Ltd
- Google LLC
- Micello Inc
- ARC Aerial Imaging Inc
- Mapquest Inc
- ESRI Inc
- TomTom NV
- Apple Inc
- HERE Technologies
Notable Milestones in Automotive HD Maps Industry Sector
- 2020: Google launches enhanced mapping features for autonomous vehicles.
- 2021: TomTom announces a strategic partnership with a major automaker for HD map development.
- 2022: Several significant M&A deals occur within the industry, leading to increased market consolidation.
- 2023: New regulations on data privacy and map accuracy are implemented in several countries.
- 2024: Several companies launch new products integrating AI-powered mapping capabilities.
In-Depth Automotive HD Maps Industry Market Outlook
The future of the Automotive HD Maps market appears promising. Continued technological advancements, increased adoption of autonomous vehicles, and expanding applications in diverse sectors will propel significant growth. Strategic partnerships and collaborations will further contribute to market expansion and innovation. However, challenges relating to data privacy and regulatory compliance will need to be addressed effectively. The market presents significant opportunities for companies that can leverage innovative technologies and establish strong partnerships.
Automotive HD Maps Industry Segmentation
-
1. Component
- 1.1. Solutions
- 1.2. Services
-
2. Application
- 2.1. Autonomous Cars
- 2.2. Fleet Management
- 2.3. Advance Driver Assistance Systems (ADAS)
Automotive HD Maps Industry Segmentation By Geography
- 1. North America
- 2. Europe
- 3. Asia Pacific
- 4. Latin America
- 5. Middle East and Africa
Automotive HD Maps Industry REPORT HIGHLIGHTS
| Aspects | Details |
|---|---|
| Study Period | 2019-2033 |
| Base Year | 2024 |
| Estimated Year | 2025 |
| Forecast Period | 2025-2033 |
| Historical Period | 2019-2024 |
| Growth Rate | CAGR of 12.75% from 2019-2033 |
| Segmentation |
|
Table of Contents
- 1. Introduction
- 1.1. Research Scope
- 1.2. Market Segmentation
- 1.3. Research Methodology
- 1.4. Definitions and Assumptions
- 2. Executive Summary
- 2.1. Introduction
- 3. Market Dynamics
- 3.1. Introduction
- 3.2. Market Drivers
- 3.2.1. ; Growth in the Number of Connected Cars; Increase in the Use of 3D Platforms
- 3.3. Market Restrains
- 3.3.1. ; Stringent Regulations and Legal Challenges for Safeguarding Privacy and Security; Lack of In-house Expertise
- 3.4. Market Trends
- 3.4.1. Advance Driver Assistance Systems (ADAS) is expected to have significant Growth Rate
- 4. Market Factor Analysis
- 4.1. Porters Five Forces
- 4.2. Supply/Value Chain
- 4.3. PESTEL analysis
- 4.4. Market Entropy
- 4.5. Patent/Trademark Analysis
- 5. Global Automotive HD Maps Industry Analysis, Insights and Forecast, 2019-2031
- 5.1. Market Analysis, Insights and Forecast - by Component
- 5.1.1. Solutions
- 5.1.2. Services
- 5.2. Market Analysis, Insights and Forecast - by Application
- 5.2.1. Autonomous Cars
- 5.2.2. Fleet Management
- 5.2.3. Advance Driver Assistance Systems (ADAS)
- 5.3. Market Analysis, Insights and Forecast - by Region
- 5.3.1. North America
- 5.3.2. Europe
- 5.3.3. Asia Pacific
- 5.3.4. Latin America
- 5.3.5. Middle East and Africa
- 5.1. Market Analysis, Insights and Forecast - by Component
- 6. North America Automotive HD Maps Industry Analysis, Insights and Forecast, 2019-2031
- 6.1. Market Analysis, Insights and Forecast - by Component
- 6.1.1. Solutions
- 6.1.2. Services
- 6.2. Market Analysis, Insights and Forecast - by Application
- 6.2.1. Autonomous Cars
- 6.2.2. Fleet Management
- 6.2.3. Advance Driver Assistance Systems (ADAS)
- 6.1. Market Analysis, Insights and Forecast - by Component
- 7. Europe Automotive HD Maps Industry Analysis, Insights and Forecast, 2019-2031
- 7.1. Market Analysis, Insights and Forecast - by Component
- 7.1.1. Solutions
- 7.1.2. Services
- 7.2. Market Analysis, Insights and Forecast - by Application
- 7.2.1. Autonomous Cars
- 7.2.2. Fleet Management
- 7.2.3. Advance Driver Assistance Systems (ADAS)
- 7.1. Market Analysis, Insights and Forecast - by Component
- 8. Asia Pacific Automotive HD Maps Industry Analysis, Insights and Forecast, 2019-2031
- 8.1. Market Analysis, Insights and Forecast - by Component
- 8.1.1. Solutions
- 8.1.2. Services
- 8.2. Market Analysis, Insights and Forecast - by Application
- 8.2.1. Autonomous Cars
- 8.2.2. Fleet Management
- 8.2.3. Advance Driver Assistance Systems (ADAS)
- 8.1. Market Analysis, Insights and Forecast - by Component
- 9. Latin America Automotive HD Maps Industry Analysis, Insights and Forecast, 2019-2031
- 9.1. Market Analysis, Insights and Forecast - by Component
- 9.1.1. Solutions
- 9.1.2. Services
- 9.2. Market Analysis, Insights and Forecast - by Application
- 9.2.1. Autonomous Cars
- 9.2.2. Fleet Management
- 9.2.3. Advance Driver Assistance Systems (ADAS)
- 9.1. Market Analysis, Insights and Forecast - by Component
- 10. Middle East and Africa Automotive HD Maps Industry Analysis, Insights and Forecast, 2019-2031
- 10.1. Market Analysis, Insights and Forecast - by Component
- 10.1.1. Solutions
- 10.1.2. Services
- 10.2. Market Analysis, Insights and Forecast - by Application
- 10.2.1. Autonomous Cars
- 10.2.2. Fleet Management
- 10.2.3. Advance Driver Assistance Systems (ADAS)
- 10.1. Market Analysis, Insights and Forecast - by Component
- 11. North America Automotive HD Maps Industry Analysis, Insights and Forecast, 2019-2031
- 11.1. Market Analysis, Insights and Forecast - By Country/Sub-region
- 11.1.1 United States
- 11.1.2 Canada
- 11.1.3 Mexico
- 12. Europe Automotive HD Maps Industry Analysis, Insights and Forecast, 2019-2031
- 12.1. Market Analysis, Insights and Forecast - By Country/Sub-region
- 12.1.1 Germany
- 12.1.2 United Kingdom
- 12.1.3 France
- 12.1.4 Spain
- 12.1.5 Italy
- 12.1.6 Spain
- 12.1.7 Belgium
- 12.1.8 Netherland
- 12.1.9 Nordics
- 12.1.10 Rest of Europe
- 13. Asia Pacific Automotive HD Maps Industry Analysis, Insights and Forecast, 2019-2031
- 13.1. Market Analysis, Insights and Forecast - By Country/Sub-region
- 13.1.1 China
- 13.1.2 Japan
- 13.1.3 India
- 13.1.4 South Korea
- 13.1.5 Southeast Asia
- 13.1.6 Australia
- 13.1.7 Indonesia
- 13.1.8 Phillipes
- 13.1.9 Singapore
- 13.1.10 Thailandc
- 13.1.11 Rest of Asia Pacific
- 14. South America Automotive HD Maps Industry Analysis, Insights and Forecast, 2019-2031
- 14.1. Market Analysis, Insights and Forecast - By Country/Sub-region
- 14.1.1 Brazil
- 14.1.2 Argentina
- 14.1.3 Peru
- 14.1.4 Chile
- 14.1.5 Colombia
- 14.1.6 Ecuador
- 14.1.7 Venezuela
- 14.1.8 Rest of South America
- 15. North America Automotive HD Maps Industry Analysis, Insights and Forecast, 2019-2031
- 15.1. Market Analysis, Insights and Forecast - By Country/Sub-region
- 15.1.1 United States
- 15.1.2 Canada
- 15.1.3 Mexico
- 16. MEA Automotive HD Maps Industry Analysis, Insights and Forecast, 2019-2031
- 16.1. Market Analysis, Insights and Forecast - By Country/Sub-region
- 16.1.1 United Arab Emirates
- 16.1.2 Saudi Arabia
- 16.1.3 South Africa
- 16.1.4 Rest of Middle East and Africa
- 17. Competitive Analysis
- 17.1. Global Market Share Analysis 2024
- 17.2. Company Profiles
- 17.2.1 MiTAC Holdings Corporation
- 17.2.1.1. Overview
- 17.2.1.2. Products
- 17.2.1.3. SWOT Analysis
- 17.2.1.4. Recent Developments
- 17.2.1.5. Financials (Based on Availability)
- 17.2.2 Nearmap Lt
- 17.2.2.1. Overview
- 17.2.2.2. Products
- 17.2.2.3. SWOT Analysis
- 17.2.2.4. Recent Developments
- 17.2.2.5. Financials (Based on Availability)
- 17.2.3 Google LLC
- 17.2.3.1. Overview
- 17.2.3.2. Products
- 17.2.3.3. SWOT Analysis
- 17.2.3.4. Recent Developments
- 17.2.3.5. Financials (Based on Availability)
- 17.2.4 Micello Inc
- 17.2.4.1. Overview
- 17.2.4.2. Products
- 17.2.4.3. SWOT Analysis
- 17.2.4.4. Recent Developments
- 17.2.4.5. Financials (Based on Availability)
- 17.2.5 ARC Aerial Imaging Inc
- 17.2.5.1. Overview
- 17.2.5.2. Products
- 17.2.5.3. SWOT Analysis
- 17.2.5.4. Recent Developments
- 17.2.5.5. Financials (Based on Availability)
- 17.2.6 Mapquest Inc
- 17.2.6.1. Overview
- 17.2.6.2. Products
- 17.2.6.3. SWOT Analysis
- 17.2.6.4. Recent Developments
- 17.2.6.5. Financials (Based on Availability)
- 17.2.7 ESRI Inc
- 17.2.7.1. Overview
- 17.2.7.2. Products
- 17.2.7.3. SWOT Analysis
- 17.2.7.4. Recent Developments
- 17.2.7.5. Financials (Based on Availability)
- 17.2.8 TomTom NV
- 17.2.8.1. Overview
- 17.2.8.2. Products
- 17.2.8.3. SWOT Analysis
- 17.2.8.4. Recent Developments
- 17.2.8.5. Financials (Based on Availability)
- 17.2.9 Apple Inc
- 17.2.9.1. Overview
- 17.2.9.2. Products
- 17.2.9.3. SWOT Analysis
- 17.2.9.4. Recent Developments
- 17.2.9.5. Financials (Based on Availability)
- 17.2.10 HERE Technologies
- 17.2.10.1. Overview
- 17.2.10.2. Products
- 17.2.10.3. SWOT Analysis
- 17.2.10.4. Recent Developments
- 17.2.10.5. Financials (Based on Availability)
- 17.2.1 MiTAC Holdings Corporation
List of Figures
- Figure 1: Global Automotive HD Maps Industry Revenue Breakdown (Million, %) by Region 2024 & 2032
- Figure 2: Global Automotive HD Maps Industry Volume Breakdown (K Unit, %) by Region 2024 & 2032
- Figure 3: North America Automotive HD Maps Industry Revenue (Million), by Country 2024 & 2032
- Figure 4: North America Automotive HD Maps Industry Volume (K Unit), by Country 2024 & 2032
- Figure 5: North America Automotive HD Maps Industry Revenue Share (%), by Country 2024 & 2032
- Figure 6: North America Automotive HD Maps Industry Volume Share (%), by Country 2024 & 2032
- Figure 7: Europe Automotive HD Maps Industry Revenue (Million), by Country 2024 & 2032
- Figure 8: Europe Automotive HD Maps Industry Volume (K Unit), by Country 2024 & 2032
- Figure 9: Europe Automotive HD Maps Industry Revenue Share (%), by Country 2024 & 2032
- Figure 10: Europe Automotive HD Maps Industry Volume Share (%), by Country 2024 & 2032
- Figure 11: Asia Pacific Automotive HD Maps Industry Revenue (Million), by Country 2024 & 2032
- Figure 12: Asia Pacific Automotive HD Maps Industry Volume (K Unit), by Country 2024 & 2032
- Figure 13: Asia Pacific Automotive HD Maps Industry Revenue Share (%), by Country 2024 & 2032
- Figure 14: Asia Pacific Automotive HD Maps Industry Volume Share (%), by Country 2024 & 2032
- Figure 15: South America Automotive HD Maps Industry Revenue (Million), by Country 2024 & 2032
- Figure 16: South America Automotive HD Maps Industry Volume (K Unit), by Country 2024 & 2032
- Figure 17: South America Automotive HD Maps Industry Revenue Share (%), by Country 2024 & 2032
- Figure 18: South America Automotive HD Maps Industry Volume Share (%), by Country 2024 & 2032
- Figure 19: North America Automotive HD Maps Industry Revenue (Million), by Country 2024 & 2032
- Figure 20: North America Automotive HD Maps Industry Volume (K Unit), by Country 2024 & 2032
- Figure 21: North America Automotive HD Maps Industry Revenue Share (%), by Country 2024 & 2032
- Figure 22: North America Automotive HD Maps Industry Volume Share (%), by Country 2024 & 2032
- Figure 23: MEA Automotive HD Maps Industry Revenue (Million), by Country 2024 & 2032
- Figure 24: MEA Automotive HD Maps Industry Volume (K Unit), by Country 2024 & 2032
- Figure 25: MEA Automotive HD Maps Industry Revenue Share (%), by Country 2024 & 2032
- Figure 26: MEA Automotive HD Maps Industry Volume Share (%), by Country 2024 & 2032
- Figure 27: North America Automotive HD Maps Industry Revenue (Million), by Component 2024 & 2032
- Figure 28: North America Automotive HD Maps Industry Volume (K Unit), by Component 2024 & 2032
- Figure 29: North America Automotive HD Maps Industry Revenue Share (%), by Component 2024 & 2032
- Figure 30: North America Automotive HD Maps Industry Volume Share (%), by Component 2024 & 2032
- Figure 31: North America Automotive HD Maps Industry Revenue (Million), by Application 2024 & 2032
- Figure 32: North America Automotive HD Maps Industry Volume (K Unit), by Application 2024 & 2032
- Figure 33: North America Automotive HD Maps Industry Revenue Share (%), by Application 2024 & 2032
- Figure 34: North America Automotive HD Maps Industry Volume Share (%), by Application 2024 & 2032
- Figure 35: North America Automotive HD Maps Industry Revenue (Million), by Country 2024 & 2032
- Figure 36: North America Automotive HD Maps Industry Volume (K Unit), by Country 2024 & 2032
- Figure 37: North America Automotive HD Maps Industry Revenue Share (%), by Country 2024 & 2032
- Figure 38: North America Automotive HD Maps Industry Volume Share (%), by Country 2024 & 2032
- Figure 39: Europe Automotive HD Maps Industry Revenue (Million), by Component 2024 & 2032
- Figure 40: Europe Automotive HD Maps Industry Volume (K Unit), by Component 2024 & 2032
- Figure 41: Europe Automotive HD Maps Industry Revenue Share (%), by Component 2024 & 2032
- Figure 42: Europe Automotive HD Maps Industry Volume Share (%), by Component 2024 & 2032
- Figure 43: Europe Automotive HD Maps Industry Revenue (Million), by Application 2024 & 2032
- Figure 44: Europe Automotive HD Maps Industry Volume (K Unit), by Application 2024 & 2032
- Figure 45: Europe Automotive HD Maps Industry Revenue Share (%), by Application 2024 & 2032
- Figure 46: Europe Automotive HD Maps Industry Volume Share (%), by Application 2024 & 2032
- Figure 47: Europe Automotive HD Maps Industry Revenue (Million), by Country 2024 & 2032
- Figure 48: Europe Automotive HD Maps Industry Volume (K Unit), by Country 2024 & 2032
- Figure 49: Europe Automotive HD Maps Industry Revenue Share (%), by Country 2024 & 2032
- Figure 50: Europe Automotive HD Maps Industry Volume Share (%), by Country 2024 & 2032
- Figure 51: Asia Pacific Automotive HD Maps Industry Revenue (Million), by Component 2024 & 2032
- Figure 52: Asia Pacific Automotive HD Maps Industry Volume (K Unit), by Component 2024 & 2032
- Figure 53: Asia Pacific Automotive HD Maps Industry Revenue Share (%), by Component 2024 & 2032
- Figure 54: Asia Pacific Automotive HD Maps Industry Volume Share (%), by Component 2024 & 2032
- Figure 55: Asia Pacific Automotive HD Maps Industry Revenue (Million), by Application 2024 & 2032
- Figure 56: Asia Pacific Automotive HD Maps Industry Volume (K Unit), by Application 2024 & 2032
- Figure 57: Asia Pacific Automotive HD Maps Industry Revenue Share (%), by Application 2024 & 2032
- Figure 58: Asia Pacific Automotive HD Maps Industry Volume Share (%), by Application 2024 & 2032
- Figure 59: Asia Pacific Automotive HD Maps Industry Revenue (Million), by Country 2024 & 2032
- Figure 60: Asia Pacific Automotive HD Maps Industry Volume (K Unit), by Country 2024 & 2032
- Figure 61: Asia Pacific Automotive HD Maps Industry Revenue Share (%), by Country 2024 & 2032
- Figure 62: Asia Pacific Automotive HD Maps Industry Volume Share (%), by Country 2024 & 2032
- Figure 63: Latin America Automotive HD Maps Industry Revenue (Million), by Component 2024 & 2032
- Figure 64: Latin America Automotive HD Maps Industry Volume (K Unit), by Component 2024 & 2032
- Figure 65: Latin America Automotive HD Maps Industry Revenue Share (%), by Component 2024 & 2032
- Figure 66: Latin America Automotive HD Maps Industry Volume Share (%), by Component 2024 & 2032
- Figure 67: Latin America Automotive HD Maps Industry Revenue (Million), by Application 2024 & 2032
- Figure 68: Latin America Automotive HD Maps Industry Volume (K Unit), by Application 2024 & 2032
- Figure 69: Latin America Automotive HD Maps Industry Revenue Share (%), by Application 2024 & 2032
- Figure 70: Latin America Automotive HD Maps Industry Volume Share (%), by Application 2024 & 2032
- Figure 71: Latin America Automotive HD Maps Industry Revenue (Million), by Country 2024 & 2032
- Figure 72: Latin America Automotive HD Maps Industry Volume (K Unit), by Country 2024 & 2032
- Figure 73: Latin America Automotive HD Maps Industry Revenue Share (%), by Country 2024 & 2032
- Figure 74: Latin America Automotive HD Maps Industry Volume Share (%), by Country 2024 & 2032
- Figure 75: Middle East and Africa Automotive HD Maps Industry Revenue (Million), by Component 2024 & 2032
- Figure 76: Middle East and Africa Automotive HD Maps Industry Volume (K Unit), by Component 2024 & 2032
- Figure 77: Middle East and Africa Automotive HD Maps Industry Revenue Share (%), by Component 2024 & 2032
- Figure 78: Middle East and Africa Automotive HD Maps Industry Volume Share (%), by Component 2024 & 2032
- Figure 79: Middle East and Africa Automotive HD Maps Industry Revenue (Million), by Application 2024 & 2032
- Figure 80: Middle East and Africa Automotive HD Maps Industry Volume (K Unit), by Application 2024 & 2032
- Figure 81: Middle East and Africa Automotive HD Maps Industry Revenue Share (%), by Application 2024 & 2032
- Figure 82: Middle East and Africa Automotive HD Maps Industry Volume Share (%), by Application 2024 & 2032
- Figure 83: Middle East and Africa Automotive HD Maps Industry Revenue (Million), by Country 2024 & 2032
- Figure 84: Middle East and Africa Automotive HD Maps Industry Volume (K Unit), by Country 2024 & 2032
- Figure 85: Middle East and Africa Automotive HD Maps Industry Revenue Share (%), by Country 2024 & 2032
- Figure 86: Middle East and Africa Automotive HD Maps Industry Volume Share (%), by Country 2024 & 2032
List of Tables
- Table 1: Global Automotive HD Maps Industry Revenue Million Forecast, by Region 2019 & 2032
- Table 2: Global Automotive HD Maps Industry Volume K Unit Forecast, by Region 2019 & 2032
- Table 3: Global Automotive HD Maps Industry Revenue Million Forecast, by Component 2019 & 2032
- Table 4: Global Automotive HD Maps Industry Volume K Unit Forecast, by Component 2019 & 2032
- Table 5: Global Automotive HD Maps Industry Revenue Million Forecast, by Application 2019 & 2032
- Table 6: Global Automotive HD Maps Industry Volume K Unit Forecast, by Application 2019 & 2032
- Table 7: Global Automotive HD Maps Industry Revenue Million Forecast, by Region 2019 & 2032
- Table 8: Global Automotive HD Maps Industry Volume K Unit Forecast, by Region 2019 & 2032
- Table 9: Global Automotive HD Maps Industry Revenue Million Forecast, by Country 2019 & 2032
- Table 10: Global Automotive HD Maps Industry Volume K Unit Forecast, by Country 2019 & 2032
- Table 11: United States Automotive HD Maps Industry Revenue (Million) Forecast, by Application 2019 & 2032
- Table 12: United States Automotive HD Maps Industry Volume (K Unit) Forecast, by Application 2019 & 2032
- Table 13: Canada Automotive HD Maps Industry Revenue (Million) Forecast, by Application 2019 & 2032
- Table 14: Canada Automotive HD Maps Industry Volume (K Unit) Forecast, by Application 2019 & 2032
- Table 15: Mexico Automotive HD Maps Industry Revenue (Million) Forecast, by Application 2019 & 2032
- Table 16: Mexico Automotive HD Maps Industry Volume (K Unit) Forecast, by Application 2019 & 2032
- Table 17: Global Automotive HD Maps Industry Revenue Million Forecast, by Country 2019 & 2032
- Table 18: Global Automotive HD Maps Industry Volume K Unit Forecast, by Country 2019 & 2032
- Table 19: Germany Automotive HD Maps Industry Revenue (Million) Forecast, by Application 2019 & 2032
- Table 20: Germany Automotive HD Maps Industry Volume (K Unit) Forecast, by Application 2019 & 2032
- Table 21: United Kingdom Automotive HD Maps Industry Revenue (Million) Forecast, by Application 2019 & 2032
- Table 22: United Kingdom Automotive HD Maps Industry Volume (K Unit) Forecast, by Application 2019 & 2032
- Table 23: France Automotive HD Maps Industry Revenue (Million) Forecast, by Application 2019 & 2032
- Table 24: France Automotive HD Maps Industry Volume (K Unit) Forecast, by Application 2019 & 2032
- Table 25: Spain Automotive HD Maps Industry Revenue (Million) Forecast, by Application 2019 & 2032
- Table 26: Spain Automotive HD Maps Industry Volume (K Unit) Forecast, by Application 2019 & 2032
- Table 27: Italy Automotive HD Maps Industry Revenue (Million) Forecast, by Application 2019 & 2032
- Table 28: Italy Automotive HD Maps Industry Volume (K Unit) Forecast, by Application 2019 & 2032
- Table 29: Spain Automotive HD Maps Industry Revenue (Million) Forecast, by Application 2019 & 2032
- Table 30: Spain Automotive HD Maps Industry Volume (K Unit) Forecast, by Application 2019 & 2032
- Table 31: Belgium Automotive HD Maps Industry Revenue (Million) Forecast, by Application 2019 & 2032
- Table 32: Belgium Automotive HD Maps Industry Volume (K Unit) Forecast, by Application 2019 & 2032
- Table 33: Netherland Automotive HD Maps Industry Revenue (Million) Forecast, by Application 2019 & 2032
- Table 34: Netherland Automotive HD Maps Industry Volume (K Unit) Forecast, by Application 2019 & 2032
- Table 35: Nordics Automotive HD Maps Industry Revenue (Million) Forecast, by Application 2019 & 2032
- Table 36: Nordics Automotive HD Maps Industry Volume (K Unit) Forecast, by Application 2019 & 2032
- Table 37: Rest of Europe Automotive HD Maps Industry Revenue (Million) Forecast, by Application 2019 & 2032
- Table 38: Rest of Europe Automotive HD Maps Industry Volume (K Unit) Forecast, by Application 2019 & 2032
- Table 39: Global Automotive HD Maps Industry Revenue Million Forecast, by Country 2019 & 2032
- Table 40: Global Automotive HD Maps Industry Volume K Unit Forecast, by Country 2019 & 2032
- Table 41: China Automotive HD Maps Industry Revenue (Million) Forecast, by Application 2019 & 2032
- Table 42: China Automotive HD Maps Industry Volume (K Unit) Forecast, by Application 2019 & 2032
- Table 43: Japan Automotive HD Maps Industry Revenue (Million) Forecast, by Application 2019 & 2032
- Table 44: Japan Automotive HD Maps Industry Volume (K Unit) Forecast, by Application 2019 & 2032
- Table 45: India Automotive HD Maps Industry Revenue (Million) Forecast, by Application 2019 & 2032
- Table 46: India Automotive HD Maps Industry Volume (K Unit) Forecast, by Application 2019 & 2032
- Table 47: South Korea Automotive HD Maps Industry Revenue (Million) Forecast, by Application 2019 & 2032
- Table 48: South Korea Automotive HD Maps Industry Volume (K Unit) Forecast, by Application 2019 & 2032
- Table 49: Southeast Asia Automotive HD Maps Industry Revenue (Million) Forecast, by Application 2019 & 2032
- Table 50: Southeast Asia Automotive HD Maps Industry Volume (K Unit) Forecast, by Application 2019 & 2032
- Table 51: Australia Automotive HD Maps Industry Revenue (Million) Forecast, by Application 2019 & 2032
- Table 52: Australia Automotive HD Maps Industry Volume (K Unit) Forecast, by Application 2019 & 2032
- Table 53: Indonesia Automotive HD Maps Industry Revenue (Million) Forecast, by Application 2019 & 2032
- Table 54: Indonesia Automotive HD Maps Industry Volume (K Unit) Forecast, by Application 2019 & 2032
- Table 55: Phillipes Automotive HD Maps Industry Revenue (Million) Forecast, by Application 2019 & 2032
- Table 56: Phillipes Automotive HD Maps Industry Volume (K Unit) Forecast, by Application 2019 & 2032
- Table 57: Singapore Automotive HD Maps Industry Revenue (Million) Forecast, by Application 2019 & 2032
- Table 58: Singapore Automotive HD Maps Industry Volume (K Unit) Forecast, by Application 2019 & 2032
- Table 59: Thailandc Automotive HD Maps Industry Revenue (Million) Forecast, by Application 2019 & 2032
- Table 60: Thailandc Automotive HD Maps Industry Volume (K Unit) Forecast, by Application 2019 & 2032
- Table 61: Rest of Asia Pacific Automotive HD Maps Industry Revenue (Million) Forecast, by Application 2019 & 2032
- Table 62: Rest of Asia Pacific Automotive HD Maps Industry Volume (K Unit) Forecast, by Application 2019 & 2032
- Table 63: Global Automotive HD Maps Industry Revenue Million Forecast, by Country 2019 & 2032
- Table 64: Global Automotive HD Maps Industry Volume K Unit Forecast, by Country 2019 & 2032
- Table 65: Brazil Automotive HD Maps Industry Revenue (Million) Forecast, by Application 2019 & 2032
- Table 66: Brazil Automotive HD Maps Industry Volume (K Unit) Forecast, by Application 2019 & 2032
- Table 67: Argentina Automotive HD Maps Industry Revenue (Million) Forecast, by Application 2019 & 2032
- Table 68: Argentina Automotive HD Maps Industry Volume (K Unit) Forecast, by Application 2019 & 2032
- Table 69: Peru Automotive HD Maps Industry Revenue (Million) Forecast, by Application 2019 & 2032
- Table 70: Peru Automotive HD Maps Industry Volume (K Unit) Forecast, by Application 2019 & 2032
- Table 71: Chile Automotive HD Maps Industry Revenue (Million) Forecast, by Application 2019 & 2032
- Table 72: Chile Automotive HD Maps Industry Volume (K Unit) Forecast, by Application 2019 & 2032
- Table 73: Colombia Automotive HD Maps Industry Revenue (Million) Forecast, by Application 2019 & 2032
- Table 74: Colombia Automotive HD Maps Industry Volume (K Unit) Forecast, by Application 2019 & 2032
- Table 75: Ecuador Automotive HD Maps Industry Revenue (Million) Forecast, by Application 2019 & 2032
- Table 76: Ecuador Automotive HD Maps Industry Volume (K Unit) Forecast, by Application 2019 & 2032
- Table 77: Venezuela Automotive HD Maps Industry Revenue (Million) Forecast, by Application 2019 & 2032
- Table 78: Venezuela Automotive HD Maps Industry Volume (K Unit) Forecast, by Application 2019 & 2032
- Table 79: Rest of South America Automotive HD Maps Industry Revenue (Million) Forecast, by Application 2019 & 2032
- Table 80: Rest of South America Automotive HD Maps Industry Volume (K Unit) Forecast, by Application 2019 & 2032
- Table 81: Global Automotive HD Maps Industry Revenue Million Forecast, by Country 2019 & 2032
- Table 82: Global Automotive HD Maps Industry Volume K Unit Forecast, by Country 2019 & 2032
- Table 83: United States Automotive HD Maps Industry Revenue (Million) Forecast, by Application 2019 & 2032
- Table 84: United States Automotive HD Maps Industry Volume (K Unit) Forecast, by Application 2019 & 2032
- Table 85: Canada Automotive HD Maps Industry Revenue (Million) Forecast, by Application 2019 & 2032
- Table 86: Canada Automotive HD Maps Industry Volume (K Unit) Forecast, by Application 2019 & 2032
- Table 87: Mexico Automotive HD Maps Industry Revenue (Million) Forecast, by Application 2019 & 2032
- Table 88: Mexico Automotive HD Maps Industry Volume (K Unit) Forecast, by Application 2019 & 2032
- Table 89: Global Automotive HD Maps Industry Revenue Million Forecast, by Country 2019 & 2032
- Table 90: Global Automotive HD Maps Industry Volume K Unit Forecast, by Country 2019 & 2032
- Table 91: United Arab Emirates Automotive HD Maps Industry Revenue (Million) Forecast, by Application 2019 & 2032
- Table 92: United Arab Emirates Automotive HD Maps Industry Volume (K Unit) Forecast, by Application 2019 & 2032
- Table 93: Saudi Arabia Automotive HD Maps Industry Revenue (Million) Forecast, by Application 2019 & 2032
- Table 94: Saudi Arabia Automotive HD Maps Industry Volume (K Unit) Forecast, by Application 2019 & 2032
- Table 95: South Africa Automotive HD Maps Industry Revenue (Million) Forecast, by Application 2019 & 2032
- Table 96: South Africa Automotive HD Maps Industry Volume (K Unit) Forecast, by Application 2019 & 2032
- Table 97: Rest of Middle East and Africa Automotive HD Maps Industry Revenue (Million) Forecast, by Application 2019 & 2032
- Table 98: Rest of Middle East and Africa Automotive HD Maps Industry Volume (K Unit) Forecast, by Application 2019 & 2032
- Table 99: Global Automotive HD Maps Industry Revenue Million Forecast, by Component 2019 & 2032
- Table 100: Global Automotive HD Maps Industry Volume K Unit Forecast, by Component 2019 & 2032
- Table 101: Global Automotive HD Maps Industry Revenue Million Forecast, by Application 2019 & 2032
- Table 102: Global Automotive HD Maps Industry Volume K Unit Forecast, by Application 2019 & 2032
- Table 103: Global Automotive HD Maps Industry Revenue Million Forecast, by Country 2019 & 2032
- Table 104: Global Automotive HD Maps Industry Volume K Unit Forecast, by Country 2019 & 2032
- Table 105: Global Automotive HD Maps Industry Revenue Million Forecast, by Component 2019 & 2032
- Table 106: Global Automotive HD Maps Industry Volume K Unit Forecast, by Component 2019 & 2032
- Table 107: Global Automotive HD Maps Industry Revenue Million Forecast, by Application 2019 & 2032
- Table 108: Global Automotive HD Maps Industry Volume K Unit Forecast, by Application 2019 & 2032
- Table 109: Global Automotive HD Maps Industry Revenue Million Forecast, by Country 2019 & 2032
- Table 110: Global Automotive HD Maps Industry Volume K Unit Forecast, by Country 2019 & 2032
- Table 111: Global Automotive HD Maps Industry Revenue Million Forecast, by Component 2019 & 2032
- Table 112: Global Automotive HD Maps Industry Volume K Unit Forecast, by Component 2019 & 2032
- Table 113: Global Automotive HD Maps Industry Revenue Million Forecast, by Application 2019 & 2032
- Table 114: Global Automotive HD Maps Industry Volume K Unit Forecast, by Application 2019 & 2032
- Table 115: Global Automotive HD Maps Industry Revenue Million Forecast, by Country 2019 & 2032
- Table 116: Global Automotive HD Maps Industry Volume K Unit Forecast, by Country 2019 & 2032
- Table 117: Global Automotive HD Maps Industry Revenue Million Forecast, by Component 2019 & 2032
- Table 118: Global Automotive HD Maps Industry Volume K Unit Forecast, by Component 2019 & 2032
- Table 119: Global Automotive HD Maps Industry Revenue Million Forecast, by Application 2019 & 2032
- Table 120: Global Automotive HD Maps Industry Volume K Unit Forecast, by Application 2019 & 2032
- Table 121: Global Automotive HD Maps Industry Revenue Million Forecast, by Country 2019 & 2032
- Table 122: Global Automotive HD Maps Industry Volume K Unit Forecast, by Country 2019 & 2032
- Table 123: Global Automotive HD Maps Industry Revenue Million Forecast, by Component 2019 & 2032
- Table 124: Global Automotive HD Maps Industry Volume K Unit Forecast, by Component 2019 & 2032
- Table 125: Global Automotive HD Maps Industry Revenue Million Forecast, by Application 2019 & 2032
- Table 126: Global Automotive HD Maps Industry Volume K Unit Forecast, by Application 2019 & 2032
- Table 127: Global Automotive HD Maps Industry Revenue Million Forecast, by Country 2019 & 2032
- Table 128: Global Automotive HD Maps Industry Volume K Unit Forecast, by Country 2019 & 2032
Frequently Asked Questions
1. What is the projected Compound Annual Growth Rate (CAGR) of the Automotive HD Maps Industry?
The projected CAGR is approximately 12.75%.
2. Which companies are prominent players in the Automotive HD Maps Industry?
Key companies in the market include MiTAC Holdings Corporation, Nearmap Lt, Google LLC, Micello Inc, ARC Aerial Imaging Inc, Mapquest Inc, ESRI Inc, TomTom NV, Apple Inc, HERE Technologies.
3. What are the main segments of the Automotive HD Maps Industry?
The market segments include Component, Application.
4. Can you provide details about the market size?
The market size is estimated to be USD XX Million as of 2022.
5. What are some drivers contributing to market growth?
; Growth in the Number of Connected Cars; Increase in the Use of 3D Platforms.
6. What are the notable trends driving market growth?
Advance Driver Assistance Systems (ADAS) is expected to have significant Growth Rate.
7. Are there any restraints impacting market growth?
; Stringent Regulations and Legal Challenges for Safeguarding Privacy and Security; Lack of In-house Expertise.
8. Can you provide examples of recent developments in the market?
N/A
9. What pricing options are available for accessing the report?
Pricing options include single-user, multi-user, and enterprise licenses priced at USD 4750, USD 5250, and USD 8750 respectively.
10. Is the market size provided in terms of value or volume?
The market size is provided in terms of value, measured in Million and volume, measured in K Unit.
11. Are there any specific market keywords associated with the report?
Yes, the market keyword associated with the report is "Automotive HD Maps Industry," which aids in identifying and referencing the specific market segment covered.
12. How do I determine which pricing option suits my needs best?
The pricing options vary based on user requirements and access needs. Individual users may opt for single-user licenses, while businesses requiring broader access may choose multi-user or enterprise licenses for cost-effective access to the report.
13. Are there any additional resources or data provided in the Automotive HD Maps Industry report?
While the report offers comprehensive insights, it's advisable to review the specific contents or supplementary materials provided to ascertain if additional resources or data are available.
14. How can I stay updated on further developments or reports in the Automotive HD Maps Industry?
To stay informed about further developments, trends, and reports in the Automotive HD Maps Industry, consider subscribing to industry newsletters, following relevant companies and organizations, or regularly checking reputable industry news sources and publications.
Methodology
Step 1 - Identification of Relevant Samples Size from Population Database


Step 2 - Approaches for Defining Global Market Size (Value, Volume* & Price*)

Note*: In applicable scenarios
Step 3 - Data Sources
Primary Research
- Web Analytics
- Survey Reports
- Research Institute
- Latest Research Reports
- Opinion Leaders
Secondary Research
- Annual Reports
- White Paper
- Latest Press Release
- Industry Association
- Paid Database
- Investor Presentations

Step 4 - Data Triangulation
Involves using different sources of information in order to increase the validity of a study
These sources are likely to be stakeholders in a program - participants, other researchers, program staff, other community members, and so on.
Then we put all data in single framework & apply various statistical tools to find out the dynamic on the market.
During the analysis stage, feedback from the stakeholder groups would be compared to determine areas of agreement as well as areas of divergence


