
Key Insights
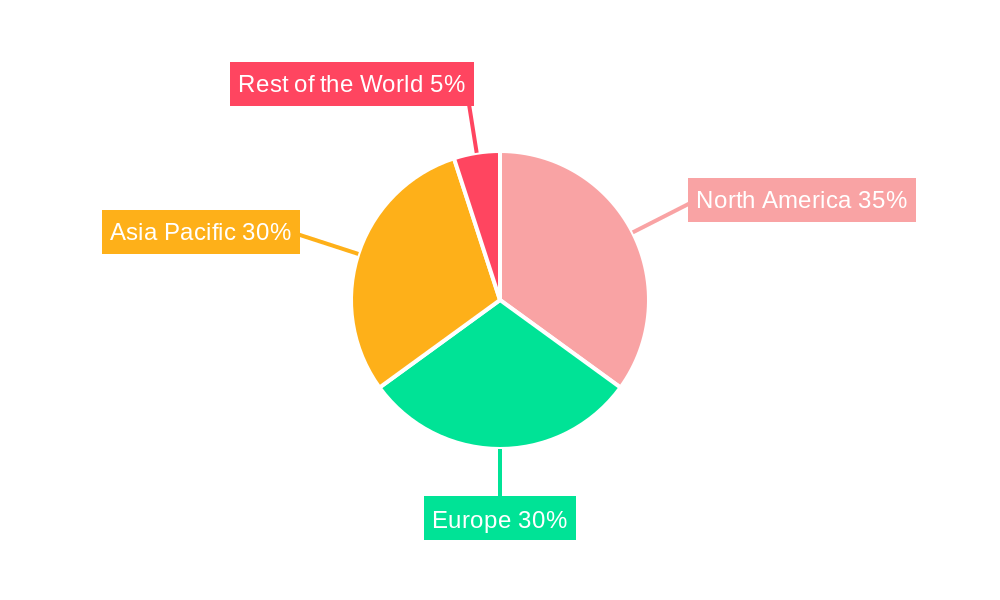
The automotive digital instrument cluster market is experiencing robust growth, driven by the increasing demand for advanced driver-assistance systems (ADAS), enhanced in-car entertainment, and the proliferation of electric vehicles (EVs). The market's expansion is fueled by several key factors. Firstly, the shift towards connected car technology necessitates sophisticated digital displays capable of handling complex information and seamless integration with various onboard systems. Secondly, consumer preference for a more intuitive and engaging driving experience is pushing automakers to adopt advanced digital instrument clusters offering customizable interfaces and improved readability. Thirdly, the rise of EVs creates a unique opportunity for innovative cluster designs, showcasing crucial information like battery level, range, and energy consumption. This trend is particularly pronounced in premium vehicle segments, where digital instrument clusters are becoming a standard feature. The market segmentation reveals significant opportunities across different vehicle types (passenger cars holding a larger share than commercial vehicles) and display technologies (with OLED showing promising growth due to superior image quality and energy efficiency compared to LCD and TFT-LCD). Geographic analysis indicates a strong presence in established automotive markets such as North America and Europe, while Asia-Pacific, particularly China and India, present substantial growth potential due to increasing vehicle production and adoption of advanced technologies. The market is witnessing competitive dynamics among major players, with established automotive component suppliers vying for market share alongside emerging technology providers.
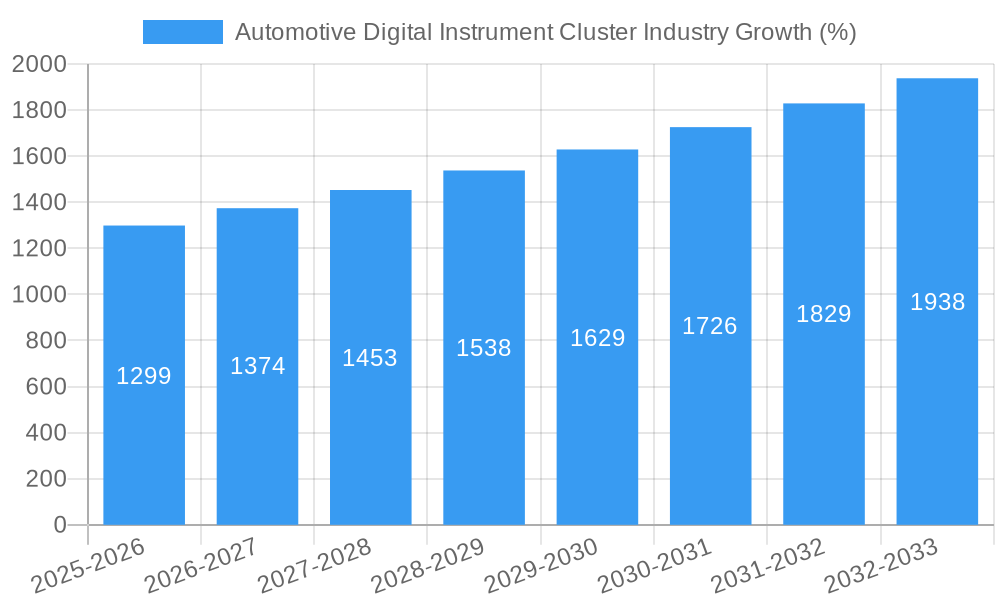
The 8.66% CAGR suggests a consistent upward trajectory, with continuous innovation in display technologies and functionalities further driving market expansion. However, factors such as high initial investment costs for manufacturers and potential software compatibility issues could act as restraints. Nevertheless, given the strong consumer demand and the continued integration of digital instrument clusters into newer vehicle models, the overall outlook for the automotive digital instrument cluster market remains positive over the forecast period (2025-2033). Regional growth will be influenced by factors like government regulations promoting vehicle electrification and autonomous driving in specific regions, along with economic growth and consumer purchasing power. The market's future will be shaped by collaborations between automakers and technology companies, leading to increasingly sophisticated and integrated digital cockpits.
Automotive Digital Instrument Cluster Industry Market Report: 2019-2033
This comprehensive report provides a detailed analysis of the Automotive Digital Instrument Cluster industry, encompassing market dynamics, growth trends, regional dominance, product landscape, key players, and future outlook. The report covers the period from 2019 to 2033, with a base year of 2025 and a forecast period of 2025-2033. The global market size is projected to reach xx Million units by 2033, exhibiting a robust CAGR. This report is an invaluable resource for industry professionals, investors, and strategic decision-makers seeking a deep understanding of this rapidly evolving sector.
Automotive Digital Instrument Cluster Industry Market Dynamics & Structure
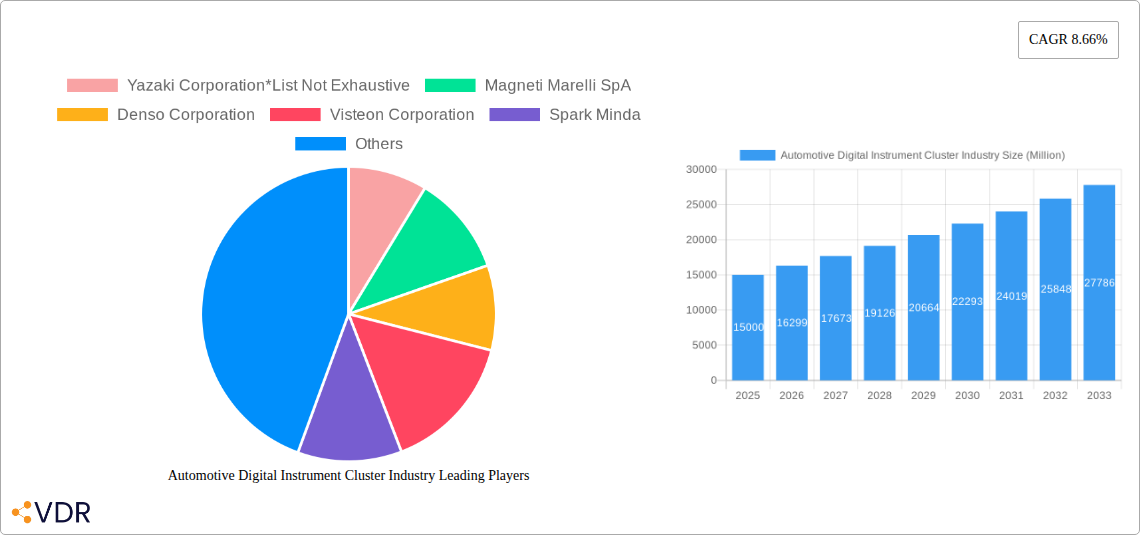
The automotive digital instrument cluster market is characterized by a moderately concentrated landscape with key players like Yazaki Corporation, Magneti Marelli SpA, Denso Corporation, Visteon Corporation, Spark Minda, Nippon Seiki Co Ltd, Continental AG, Robert Bosch GmbH, IAC Group, and Panasonic Corporation vying for market share. Technological innovation, particularly in display technologies (OLED, TFT-LCD) and connectivity features, is a major driver. Stringent regulatory frameworks concerning vehicle safety and emissions standards further shape the market. The rise of electric vehicles (EVs) is a significant growth catalyst, driving demand for sophisticated digital instrument clusters with enhanced functionalities. The market witnesses continuous mergers and acquisitions (M&A) activities, reflecting the industry's dynamic nature. For instance, the number of M&A deals in the sector from 2020-2024 was approximately xx, indicating consolidation efforts.
- Market Concentration: Moderately concentrated, with top 10 players holding approximately xx% market share in 2024.
- Technological Innovation: OLED and mini-LED displays are driving premiumization and improved visuals. Advanced driver-assistance systems (ADAS) integration is key.
- Regulatory Landscape: Emission regulations and safety standards are pushing for advanced features like driver monitoring systems.
- Competitive Substitutes: Traditional analog instrument clusters are being rapidly replaced.
- End-User Demographics: Shift towards premium vehicles and rising EV adoption fuels growth.
- M&A Trends: Consolidation is ongoing, driven by the need for scale and technological expertise.
Automotive Digital Instrument Cluster Industry Growth Trends & Insights
The global automotive digital instrument cluster market experienced significant growth during the historical period (2019-2024), driven by the increasing adoption of advanced driver-assistance systems (ADAS) and the rising demand for connected car features. The market size grew from xx Million units in 2019 to xx Million units in 2024, demonstrating a CAGR of xx%. This growth is primarily attributed to the rapid expansion of the automotive sector, coupled with the increasing preference for advanced infotainment systems and improved driver experience. Technological disruptions, such as the introduction of higher-resolution displays (OLED, mini-LED) and the integration of augmented reality (AR) features, have further propelled market expansion. Consumer behavior shifts, including a preference for personalized in-car experiences and user-friendly interfaces, have fueled demand for advanced digital instrument clusters. The forecast period (2025-2033) is projected to witness continued market expansion, driven by the widespread adoption of EVs, autonomous driving technologies, and connected car features. Market penetration is expected to reach xx% by 2033.
Dominant Regions, Countries, or Segments in Automotive Digital Instrument Cluster Industry
North America and Europe currently dominate the automotive digital instrument cluster market, driven by high vehicle production volumes, a strong preference for advanced vehicle features, and a well-established automotive ecosystem. However, Asia-Pacific is expected to witness the fastest growth due to expanding automotive production capacity and rising consumer demand for technologically advanced vehicles.
By Display Size Type:
- 9-11 inch: Holds the largest market share currently, owing to its balance between cost and visual appeal.
- More than 12 inch: Fastest-growing segment, driven by the rise of premium vehicles and increased screen real estate for infotainment integration.
By Vehicle Type:
- Passenger Cars: The largest segment, due to higher production volumes compared to commercial vehicles.
- Commercial Vehicles: Experiencing slower but steady growth, driven by the increasing integration of advanced safety features.
By Electric Vehicle Type:
- BEV (Battery Electric Vehicles): The fastest-growing segment, driven by rapid EV adoption globally.
- PHEV (Plug-in Hybrid Electric Vehicles): Significant growth potential driven by the increasing popularity of hybrids.
By Display Type:
- TFT-LCD: Currently holds the largest market share, offering a balance between cost and performance.
- OLED: Fastest-growing segment, due to superior image quality and power efficiency.
Key Drivers:
- Strong government support for EV adoption and technological advancements.
- Robust growth in the automotive sector, particularly in developing economies.
- Rising demand for enhanced safety and infotainment features.
Automotive Digital Instrument Cluster Industry Product Landscape
The automotive digital instrument cluster market offers a diverse range of products, varying in display size, resolution, features, and connectivity options. Innovation focuses on enhancing display quality (OLED, mini-LED), integrating advanced driver-assistance systems (ADAS), improving user interfaces (UI) and user experience (UX), and incorporating connectivity features like smartphone integration and over-the-air (OTA) updates. Key performance metrics include resolution, brightness, response time, power consumption, and durability. Unique selling propositions focus on advanced features like AR HUD overlays and personalized driver profiles.
Key Drivers, Barriers & Challenges in Automotive Digital Instrument Cluster Industry
Key Drivers:
- Increasing demand for advanced driver-assistance systems (ADAS).
- Rising adoption of electric vehicles (EVs).
- Growing preference for enhanced in-car infotainment and connectivity.
Key Challenges and Restraints:
- High initial investment costs associated with advanced technologies.
- Supply chain disruptions and component shortages impacting production.
- Intense competition from established players and new entrants.
- Concerns regarding cybersecurity and data privacy.
Emerging Opportunities in Automotive Digital Instrument Cluster Industry
The market presents several emerging opportunities, including the integration of augmented reality (AR) and virtual reality (VR) technologies for enhanced driver experiences, the development of customizable and personalized instrument clusters, and the expansion into untapped markets, such as developing economies. The integration of AI and machine learning for advanced driver monitoring and predictive maintenance is another significant opportunity.
Growth Accelerators in the Automotive Digital Instrument Cluster Industry
Technological breakthroughs, particularly in display technologies and software solutions, are key growth accelerators. Strategic partnerships between automotive manufacturers and technology providers are also driving market expansion. Aggressive market expansion strategies targeting developing economies and the growing EV market represent further catalysts for long-term growth.
Key Players Shaping the Automotive Digital Instrument Cluster Market
- Yazaki Corporation
- Magneti Marelli SpA
- Denso Corporation
- Visteon Corporation
- Spark Minda
- Nippon Seiki Co Ltd
- Continental AG
- Robert Bosch GmbH
- IAC Group
- Panasonic Corporation
Notable Milestones in Automotive Digital Instrument Cluster Industry Sector
- January 2022: Continental AG provided technology support to BMW for their iX electric vehicle, integrating a driver camera into the instrument cluster.
- January 2022: Renault launched the OpenR Link interface in the Megane E-Tech, featuring a 12.3-inch digital instrument cluster supplied by Continental AG.
- November 2021: Visteon Corporation and BlackBerry Limited expanded their collaboration to develop next-generation digital cockpit solutions, including digital instrument clusters.
In-Depth Automotive Digital Instrument Cluster Industry Market Outlook
The future of the automotive digital instrument cluster market is exceptionally bright. Continued technological advancements, particularly in display technologies, software capabilities, and connectivity, will propel further growth. The increasing demand for EVs and autonomous driving features will create significant opportunities for manufacturers and suppliers. Strategic partnerships and M&A activity will shape the industry's competitive landscape. The market is poised for sustained expansion, with significant potential for innovation and market penetration in the years to come.
Automotive Digital Instrument Cluster Industry Segmentation
-
1. Vehicle Type
- 1.1. Passenger Cars
- 1.2. Commercial Vehicles
-
2. Display Type
- 2.1. LCD
- 2.2. TFT-LCD
- 2.3. OLED
-
3. Display Size Type
- 3.1. 5-8 Inch
- 3.2. 9-11 Inch
- 3.3. More Than 12 Inch
Automotive Digital Instrument Cluster Industry Segmentation By Geography
-
1. North America
- 1.1. United States
- 1.2. Canada
- 1.3. Rest of North America
-
2. Europe
- 2.1. Germany
- 2.2. United Kingdom
- 2.3. France
- 2.4. Rest of Europe
-
3. Asia Pacific
- 3.1. India
- 3.2. China
- 3.3. Japan
- 3.4. South Korea
- 3.5. Rest of Asia Pacific
-
4. Rest of the World
- 4.1. Brazil
- 4.2. Mexico
- 4.3. United Arab Emirates
- 4.4. Other Countries
Automotive Digital Instrument Cluster Industry REPORT HIGHLIGHTS
| Aspects | Details |
|---|---|
| Study Period | 2019-2033 |
| Base Year | 2024 |
| Estimated Year | 2025 |
| Forecast Period | 2025-2033 |
| Historical Period | 2019-2024 |
| Growth Rate | CAGR of 8.66% from 2019-2033 |
| Segmentation |
|
Table of Contents
- 1. Introduction
- 1.1. Research Scope
- 1.2. Market Segmentation
- 1.3. Research Methodology
- 1.4. Definitions and Assumptions
- 2. Executive Summary
- 2.1. Introduction
- 3. Market Dynamics
- 3.1. Introduction
- 3.2. Market Drivers
- 3.2.1. 4.; Increasing demand from automobile industry4.; Increased focus on precision products
- 3.3. Market Restrains
- 3.3.1. 4.; The cost of production and transportation4.; Regulations and quality standards
- 3.4. Market Trends
- 3.4.1. 3D Cockpit Expected to be the Future of the Automotive Digital Instrument Cluster Market
- 4. Market Factor Analysis
- 4.1. Porters Five Forces
- 4.2. Supply/Value Chain
- 4.3. PESTEL analysis
- 4.4. Market Entropy
- 4.5. Patent/Trademark Analysis
- 5. Global Automotive Digital Instrument Cluster Industry Analysis, Insights and Forecast, 2019-2031
- 5.1. Market Analysis, Insights and Forecast - by Vehicle Type
- 5.1.1. Passenger Cars
- 5.1.2. Commercial Vehicles
- 5.2. Market Analysis, Insights and Forecast - by Display Type
- 5.2.1. LCD
- 5.2.2. TFT-LCD
- 5.2.3. OLED
- 5.3. Market Analysis, Insights and Forecast - by Display Size Type
- 5.3.1. 5-8 Inch
- 5.3.2. 9-11 Inch
- 5.3.3. More Than 12 Inch
- 5.4. Market Analysis, Insights and Forecast - by Region
- 5.4.1. North America
- 5.4.2. Europe
- 5.4.3. Asia Pacific
- 5.4.4. Rest of the World
- 5.1. Market Analysis, Insights and Forecast - by Vehicle Type
- 6. North America Automotive Digital Instrument Cluster Industry Analysis, Insights and Forecast, 2019-2031
- 6.1. Market Analysis, Insights and Forecast - by Vehicle Type
- 6.1.1. Passenger Cars
- 6.1.2. Commercial Vehicles
- 6.2. Market Analysis, Insights and Forecast - by Display Type
- 6.2.1. LCD
- 6.2.2. TFT-LCD
- 6.2.3. OLED
- 6.3. Market Analysis, Insights and Forecast - by Display Size Type
- 6.3.1. 5-8 Inch
- 6.3.2. 9-11 Inch
- 6.3.3. More Than 12 Inch
- 6.1. Market Analysis, Insights and Forecast - by Vehicle Type
- 7. Europe Automotive Digital Instrument Cluster Industry Analysis, Insights and Forecast, 2019-2031
- 7.1. Market Analysis, Insights and Forecast - by Vehicle Type
- 7.1.1. Passenger Cars
- 7.1.2. Commercial Vehicles
- 7.2. Market Analysis, Insights and Forecast - by Display Type
- 7.2.1. LCD
- 7.2.2. TFT-LCD
- 7.2.3. OLED
- 7.3. Market Analysis, Insights and Forecast - by Display Size Type
- 7.3.1. 5-8 Inch
- 7.3.2. 9-11 Inch
- 7.3.3. More Than 12 Inch
- 7.1. Market Analysis, Insights and Forecast - by Vehicle Type
- 8. Asia Pacific Automotive Digital Instrument Cluster Industry Analysis, Insights and Forecast, 2019-2031
- 8.1. Market Analysis, Insights and Forecast - by Vehicle Type
- 8.1.1. Passenger Cars
- 8.1.2. Commercial Vehicles
- 8.2. Market Analysis, Insights and Forecast - by Display Type
- 8.2.1. LCD
- 8.2.2. TFT-LCD
- 8.2.3. OLED
- 8.3. Market Analysis, Insights and Forecast - by Display Size Type
- 8.3.1. 5-8 Inch
- 8.3.2. 9-11 Inch
- 8.3.3. More Than 12 Inch
- 8.1. Market Analysis, Insights and Forecast - by Vehicle Type
- 9. Rest of the World Automotive Digital Instrument Cluster Industry Analysis, Insights and Forecast, 2019-2031
- 9.1. Market Analysis, Insights and Forecast - by Vehicle Type
- 9.1.1. Passenger Cars
- 9.1.2. Commercial Vehicles
- 9.2. Market Analysis, Insights and Forecast - by Display Type
- 9.2.1. LCD
- 9.2.2. TFT-LCD
- 9.2.3. OLED
- 9.3. Market Analysis, Insights and Forecast - by Display Size Type
- 9.3.1. 5-8 Inch
- 9.3.2. 9-11 Inch
- 9.3.3. More Than 12 Inch
- 9.1. Market Analysis, Insights and Forecast - by Vehicle Type
- 10. North America Automotive Digital Instrument Cluster Industry Analysis, Insights and Forecast, 2019-2031
- 10.1. Market Analysis, Insights and Forecast - By Country/Sub-region
- 10.1.1 United States
- 10.1.2 Canada
- 10.1.3 Rest of North America
- 11. Europe Automotive Digital Instrument Cluster Industry Analysis, Insights and Forecast, 2019-2031
- 11.1. Market Analysis, Insights and Forecast - By Country/Sub-region
- 11.1.1 Germany
- 11.1.2 United Kingdom
- 11.1.3 France
- 11.1.4 Rest of Europe
- 12. Asia Pacific Automotive Digital Instrument Cluster Industry Analysis, Insights and Forecast, 2019-2031
- 12.1. Market Analysis, Insights and Forecast - By Country/Sub-region
- 12.1.1 India
- 12.1.2 China
- 12.1.3 Japan
- 12.1.4 South Korea
- 12.1.5 Rest of Asia Pacific
- 13. Rest of the World Automotive Digital Instrument Cluster Industry Analysis, Insights and Forecast, 2019-2031
- 13.1. Market Analysis, Insights and Forecast - By Country/Sub-region
- 13.1.1 Brazil
- 13.1.2 Mexico
- 13.1.3 United Arab Emirates
- 13.1.4 Other Countries
- 14. Competitive Analysis
- 14.1. Global Market Share Analysis 2024
- 14.2. Company Profiles
- 14.2.1 Yazaki Corporation*List Not Exhaustive
- 14.2.1.1. Overview
- 14.2.1.2. Products
- 14.2.1.3. SWOT Analysis
- 14.2.1.4. Recent Developments
- 14.2.1.5. Financials (Based on Availability)
- 14.2.2 Magneti Marelli SpA
- 14.2.2.1. Overview
- 14.2.2.2. Products
- 14.2.2.3. SWOT Analysis
- 14.2.2.4. Recent Developments
- 14.2.2.5. Financials (Based on Availability)
- 14.2.3 Denso Corporation
- 14.2.3.1. Overview
- 14.2.3.2. Products
- 14.2.3.3. SWOT Analysis
- 14.2.3.4. Recent Developments
- 14.2.3.5. Financials (Based on Availability)
- 14.2.4 Visteon Corporation
- 14.2.4.1. Overview
- 14.2.4.2. Products
- 14.2.4.3. SWOT Analysis
- 14.2.4.4. Recent Developments
- 14.2.4.5. Financials (Based on Availability)
- 14.2.5 Spark Minda
- 14.2.5.1. Overview
- 14.2.5.2. Products
- 14.2.5.3. SWOT Analysis
- 14.2.5.4. Recent Developments
- 14.2.5.5. Financials (Based on Availability)
- 14.2.6 Nippon Seiki Co Ltd
- 14.2.6.1. Overview
- 14.2.6.2. Products
- 14.2.6.3. SWOT Analysis
- 14.2.6.4. Recent Developments
- 14.2.6.5. Financials (Based on Availability)
- 14.2.7 Continental AG
- 14.2.7.1. Overview
- 14.2.7.2. Products
- 14.2.7.3. SWOT Analysis
- 14.2.7.4. Recent Developments
- 14.2.7.5. Financials (Based on Availability)
- 14.2.8 Robert Bosch GmbH
- 14.2.8.1. Overview
- 14.2.8.2. Products
- 14.2.8.3. SWOT Analysis
- 14.2.8.4. Recent Developments
- 14.2.8.5. Financials (Based on Availability)
- 14.2.9 IAC Group
- 14.2.9.1. Overview
- 14.2.9.2. Products
- 14.2.9.3. SWOT Analysis
- 14.2.9.4. Recent Developments
- 14.2.9.5. Financials (Based on Availability)
- 14.2.10 Panasonic Corporation
- 14.2.10.1. Overview
- 14.2.10.2. Products
- 14.2.10.3. SWOT Analysis
- 14.2.10.4. Recent Developments
- 14.2.10.5. Financials (Based on Availability)
- 14.2.1 Yazaki Corporation*List Not Exhaustive
List of Figures
- Figure 1: Global Automotive Digital Instrument Cluster Industry Revenue Breakdown (Million, %) by Region 2024 & 2032
- Figure 2: North America Automotive Digital Instrument Cluster Industry Revenue (Million), by Country 2024 & 2032
- Figure 3: North America Automotive Digital Instrument Cluster Industry Revenue Share (%), by Country 2024 & 2032
- Figure 4: Europe Automotive Digital Instrument Cluster Industry Revenue (Million), by Country 2024 & 2032
- Figure 5: Europe Automotive Digital Instrument Cluster Industry Revenue Share (%), by Country 2024 & 2032
- Figure 6: Asia Pacific Automotive Digital Instrument Cluster Industry Revenue (Million), by Country 2024 & 2032
- Figure 7: Asia Pacific Automotive Digital Instrument Cluster Industry Revenue Share (%), by Country 2024 & 2032
- Figure 8: Rest of the World Automotive Digital Instrument Cluster Industry Revenue (Million), by Country 2024 & 2032
- Figure 9: Rest of the World Automotive Digital Instrument Cluster Industry Revenue Share (%), by Country 2024 & 2032
- Figure 10: North America Automotive Digital Instrument Cluster Industry Revenue (Million), by Vehicle Type 2024 & 2032
- Figure 11: North America Automotive Digital Instrument Cluster Industry Revenue Share (%), by Vehicle Type 2024 & 2032
- Figure 12: North America Automotive Digital Instrument Cluster Industry Revenue (Million), by Display Type 2024 & 2032
- Figure 13: North America Automotive Digital Instrument Cluster Industry Revenue Share (%), by Display Type 2024 & 2032
- Figure 14: North America Automotive Digital Instrument Cluster Industry Revenue (Million), by Display Size Type 2024 & 2032
- Figure 15: North America Automotive Digital Instrument Cluster Industry Revenue Share (%), by Display Size Type 2024 & 2032
- Figure 16: North America Automotive Digital Instrument Cluster Industry Revenue (Million), by Country 2024 & 2032
- Figure 17: North America Automotive Digital Instrument Cluster Industry Revenue Share (%), by Country 2024 & 2032
- Figure 18: Europe Automotive Digital Instrument Cluster Industry Revenue (Million), by Vehicle Type 2024 & 2032
- Figure 19: Europe Automotive Digital Instrument Cluster Industry Revenue Share (%), by Vehicle Type 2024 & 2032
- Figure 20: Europe Automotive Digital Instrument Cluster Industry Revenue (Million), by Display Type 2024 & 2032
- Figure 21: Europe Automotive Digital Instrument Cluster Industry Revenue Share (%), by Display Type 2024 & 2032
- Figure 22: Europe Automotive Digital Instrument Cluster Industry Revenue (Million), by Display Size Type 2024 & 2032
- Figure 23: Europe Automotive Digital Instrument Cluster Industry Revenue Share (%), by Display Size Type 2024 & 2032
- Figure 24: Europe Automotive Digital Instrument Cluster Industry Revenue (Million), by Country 2024 & 2032
- Figure 25: Europe Automotive Digital Instrument Cluster Industry Revenue Share (%), by Country 2024 & 2032
- Figure 26: Asia Pacific Automotive Digital Instrument Cluster Industry Revenue (Million), by Vehicle Type 2024 & 2032
- Figure 27: Asia Pacific Automotive Digital Instrument Cluster Industry Revenue Share (%), by Vehicle Type 2024 & 2032
- Figure 28: Asia Pacific Automotive Digital Instrument Cluster Industry Revenue (Million), by Display Type 2024 & 2032
- Figure 29: Asia Pacific Automotive Digital Instrument Cluster Industry Revenue Share (%), by Display Type 2024 & 2032
- Figure 30: Asia Pacific Automotive Digital Instrument Cluster Industry Revenue (Million), by Display Size Type 2024 & 2032
- Figure 31: Asia Pacific Automotive Digital Instrument Cluster Industry Revenue Share (%), by Display Size Type 2024 & 2032
- Figure 32: Asia Pacific Automotive Digital Instrument Cluster Industry Revenue (Million), by Country 2024 & 2032
- Figure 33: Asia Pacific Automotive Digital Instrument Cluster Industry Revenue Share (%), by Country 2024 & 2032
- Figure 34: Rest of the World Automotive Digital Instrument Cluster Industry Revenue (Million), by Vehicle Type 2024 & 2032
- Figure 35: Rest of the World Automotive Digital Instrument Cluster Industry Revenue Share (%), by Vehicle Type 2024 & 2032
- Figure 36: Rest of the World Automotive Digital Instrument Cluster Industry Revenue (Million), by Display Type 2024 & 2032
- Figure 37: Rest of the World Automotive Digital Instrument Cluster Industry Revenue Share (%), by Display Type 2024 & 2032
- Figure 38: Rest of the World Automotive Digital Instrument Cluster Industry Revenue (Million), by Display Size Type 2024 & 2032
- Figure 39: Rest of the World Automotive Digital Instrument Cluster Industry Revenue Share (%), by Display Size Type 2024 & 2032
- Figure 40: Rest of the World Automotive Digital Instrument Cluster Industry Revenue (Million), by Country 2024 & 2032
- Figure 41: Rest of the World Automotive Digital Instrument Cluster Industry Revenue Share (%), by Country 2024 & 2032
List of Tables
- Table 1: Global Automotive Digital Instrument Cluster Industry Revenue Million Forecast, by Region 2019 & 2032
- Table 2: Global Automotive Digital Instrument Cluster Industry Revenue Million Forecast, by Vehicle Type 2019 & 2032
- Table 3: Global Automotive Digital Instrument Cluster Industry Revenue Million Forecast, by Display Type 2019 & 2032
- Table 4: Global Automotive Digital Instrument Cluster Industry Revenue Million Forecast, by Display Size Type 2019 & 2032
- Table 5: Global Automotive Digital Instrument Cluster Industry Revenue Million Forecast, by Region 2019 & 2032
- Table 6: Global Automotive Digital Instrument Cluster Industry Revenue Million Forecast, by Country 2019 & 2032
- Table 7: United States Automotive Digital Instrument Cluster Industry Revenue (Million) Forecast, by Application 2019 & 2032
- Table 8: Canada Automotive Digital Instrument Cluster Industry Revenue (Million) Forecast, by Application 2019 & 2032
- Table 9: Rest of North America Automotive Digital Instrument Cluster Industry Revenue (Million) Forecast, by Application 2019 & 2032
- Table 10: Global Automotive Digital Instrument Cluster Industry Revenue Million Forecast, by Country 2019 & 2032
- Table 11: Germany Automotive Digital Instrument Cluster Industry Revenue (Million) Forecast, by Application 2019 & 2032
- Table 12: United Kingdom Automotive Digital Instrument Cluster Industry Revenue (Million) Forecast, by Application 2019 & 2032
- Table 13: France Automotive Digital Instrument Cluster Industry Revenue (Million) Forecast, by Application 2019 & 2032
- Table 14: Rest of Europe Automotive Digital Instrument Cluster Industry Revenue (Million) Forecast, by Application 2019 & 2032
- Table 15: Global Automotive Digital Instrument Cluster Industry Revenue Million Forecast, by Country 2019 & 2032
- Table 16: India Automotive Digital Instrument Cluster Industry Revenue (Million) Forecast, by Application 2019 & 2032
- Table 17: China Automotive Digital Instrument Cluster Industry Revenue (Million) Forecast, by Application 2019 & 2032
- Table 18: Japan Automotive Digital Instrument Cluster Industry Revenue (Million) Forecast, by Application 2019 & 2032
- Table 19: South Korea Automotive Digital Instrument Cluster Industry Revenue (Million) Forecast, by Application 2019 & 2032
- Table 20: Rest of Asia Pacific Automotive Digital Instrument Cluster Industry Revenue (Million) Forecast, by Application 2019 & 2032
- Table 21: Global Automotive Digital Instrument Cluster Industry Revenue Million Forecast, by Country 2019 & 2032
- Table 22: Brazil Automotive Digital Instrument Cluster Industry Revenue (Million) Forecast, by Application 2019 & 2032
- Table 23: Mexico Automotive Digital Instrument Cluster Industry Revenue (Million) Forecast, by Application 2019 & 2032
- Table 24: United Arab Emirates Automotive Digital Instrument Cluster Industry Revenue (Million) Forecast, by Application 2019 & 2032
- Table 25: Other Countries Automotive Digital Instrument Cluster Industry Revenue (Million) Forecast, by Application 2019 & 2032
- Table 26: Global Automotive Digital Instrument Cluster Industry Revenue Million Forecast, by Vehicle Type 2019 & 2032
- Table 27: Global Automotive Digital Instrument Cluster Industry Revenue Million Forecast, by Display Type 2019 & 2032
- Table 28: Global Automotive Digital Instrument Cluster Industry Revenue Million Forecast, by Display Size Type 2019 & 2032
- Table 29: Global Automotive Digital Instrument Cluster Industry Revenue Million Forecast, by Country 2019 & 2032
- Table 30: United States Automotive Digital Instrument Cluster Industry Revenue (Million) Forecast, by Application 2019 & 2032
- Table 31: Canada Automotive Digital Instrument Cluster Industry Revenue (Million) Forecast, by Application 2019 & 2032
- Table 32: Rest of North America Automotive Digital Instrument Cluster Industry Revenue (Million) Forecast, by Application 2019 & 2032
- Table 33: Global Automotive Digital Instrument Cluster Industry Revenue Million Forecast, by Vehicle Type 2019 & 2032
- Table 34: Global Automotive Digital Instrument Cluster Industry Revenue Million Forecast, by Display Type 2019 & 2032
- Table 35: Global Automotive Digital Instrument Cluster Industry Revenue Million Forecast, by Display Size Type 2019 & 2032
- Table 36: Global Automotive Digital Instrument Cluster Industry Revenue Million Forecast, by Country 2019 & 2032
- Table 37: Germany Automotive Digital Instrument Cluster Industry Revenue (Million) Forecast, by Application 2019 & 2032
- Table 38: United Kingdom Automotive Digital Instrument Cluster Industry Revenue (Million) Forecast, by Application 2019 & 2032
- Table 39: France Automotive Digital Instrument Cluster Industry Revenue (Million) Forecast, by Application 2019 & 2032
- Table 40: Rest of Europe Automotive Digital Instrument Cluster Industry Revenue (Million) Forecast, by Application 2019 & 2032
- Table 41: Global Automotive Digital Instrument Cluster Industry Revenue Million Forecast, by Vehicle Type 2019 & 2032
- Table 42: Global Automotive Digital Instrument Cluster Industry Revenue Million Forecast, by Display Type 2019 & 2032
- Table 43: Global Automotive Digital Instrument Cluster Industry Revenue Million Forecast, by Display Size Type 2019 & 2032
- Table 44: Global Automotive Digital Instrument Cluster Industry Revenue Million Forecast, by Country 2019 & 2032
- Table 45: India Automotive Digital Instrument Cluster Industry Revenue (Million) Forecast, by Application 2019 & 2032
- Table 46: China Automotive Digital Instrument Cluster Industry Revenue (Million) Forecast, by Application 2019 & 2032
- Table 47: Japan Automotive Digital Instrument Cluster Industry Revenue (Million) Forecast, by Application 2019 & 2032
- Table 48: South Korea Automotive Digital Instrument Cluster Industry Revenue (Million) Forecast, by Application 2019 & 2032
- Table 49: Rest of Asia Pacific Automotive Digital Instrument Cluster Industry Revenue (Million) Forecast, by Application 2019 & 2032
- Table 50: Global Automotive Digital Instrument Cluster Industry Revenue Million Forecast, by Vehicle Type 2019 & 2032
- Table 51: Global Automotive Digital Instrument Cluster Industry Revenue Million Forecast, by Display Type 2019 & 2032
- Table 52: Global Automotive Digital Instrument Cluster Industry Revenue Million Forecast, by Display Size Type 2019 & 2032
- Table 53: Global Automotive Digital Instrument Cluster Industry Revenue Million Forecast, by Country 2019 & 2032
- Table 54: Brazil Automotive Digital Instrument Cluster Industry Revenue (Million) Forecast, by Application 2019 & 2032
- Table 55: Mexico Automotive Digital Instrument Cluster Industry Revenue (Million) Forecast, by Application 2019 & 2032
- Table 56: United Arab Emirates Automotive Digital Instrument Cluster Industry Revenue (Million) Forecast, by Application 2019 & 2032
- Table 57: Other Countries Automotive Digital Instrument Cluster Industry Revenue (Million) Forecast, by Application 2019 & 2032
Frequently Asked Questions
1. What is the projected Compound Annual Growth Rate (CAGR) of the Automotive Digital Instrument Cluster Industry?
The projected CAGR is approximately 8.66%.
2. Which companies are prominent players in the Automotive Digital Instrument Cluster Industry?
Key companies in the market include Yazaki Corporation*List Not Exhaustive, Magneti Marelli SpA, Denso Corporation, Visteon Corporation, Spark Minda, Nippon Seiki Co Ltd, Continental AG, Robert Bosch GmbH, IAC Group, Panasonic Corporation.
3. What are the main segments of the Automotive Digital Instrument Cluster Industry?
The market segments include Vehicle Type, Display Type, Display Size Type.
4. Can you provide details about the market size?
The market size is estimated to be USD XX Million as of 2022.
5. What are some drivers contributing to market growth?
4.; Increasing demand from automobile industry4.; Increased focus on precision products.
6. What are the notable trends driving market growth?
3D Cockpit Expected to be the Future of the Automotive Digital Instrument Cluster Market.
7. Are there any restraints impacting market growth?
4.; The cost of production and transportation4.; Regulations and quality standards.
8. Can you provide examples of recent developments in the market?
In January 2022, Continental AG provided technology support to BMW for their iX electric vehicle. A driver camera integrated with the instrument cluster offers seamless interaction between the car and the driver.
9. What pricing options are available for accessing the report?
Pricing options include single-user, multi-user, and enterprise licenses priced at USD 4750, USD 5250, and USD 8750 respectively.
10. Is the market size provided in terms of value or volume?
The market size is provided in terms of value, measured in Million.
11. Are there any specific market keywords associated with the report?
Yes, the market keyword associated with the report is "Automotive Digital Instrument Cluster Industry," which aids in identifying and referencing the specific market segment covered.
12. How do I determine which pricing option suits my needs best?
The pricing options vary based on user requirements and access needs. Individual users may opt for single-user licenses, while businesses requiring broader access may choose multi-user or enterprise licenses for cost-effective access to the report.
13. Are there any additional resources or data provided in the Automotive Digital Instrument Cluster Industry report?
While the report offers comprehensive insights, it's advisable to review the specific contents or supplementary materials provided to ascertain if additional resources or data are available.
14. How can I stay updated on further developments or reports in the Automotive Digital Instrument Cluster Industry?
To stay informed about further developments, trends, and reports in the Automotive Digital Instrument Cluster Industry, consider subscribing to industry newsletters, following relevant companies and organizations, or regularly checking reputable industry news sources and publications.
Methodology
Step 1 - Identification of Relevant Samples Size from Population Database


Step 2 - Approaches for Defining Global Market Size (Value, Volume* & Price*)

Note*: In applicable scenarios
Step 3 - Data Sources
Primary Research
- Web Analytics
- Survey Reports
- Research Institute
- Latest Research Reports
- Opinion Leaders
Secondary Research
- Annual Reports
- White Paper
- Latest Press Release
- Industry Association
- Paid Database
- Investor Presentations

Step 4 - Data Triangulation
Involves using different sources of information in order to increase the validity of a study
These sources are likely to be stakeholders in a program - participants, other researchers, program staff, other community members, and so on.
Then we put all data in single framework & apply various statistical tools to find out the dynamic on the market.
During the analysis stage, feedback from the stakeholder groups would be compared to determine areas of agreement as well as areas of divergence


