
Key Insights
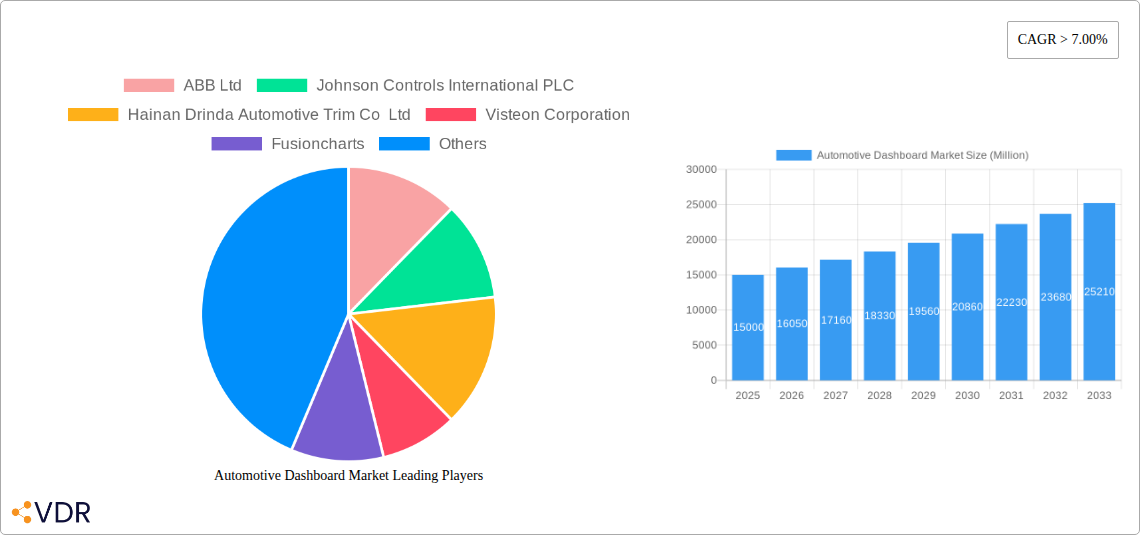
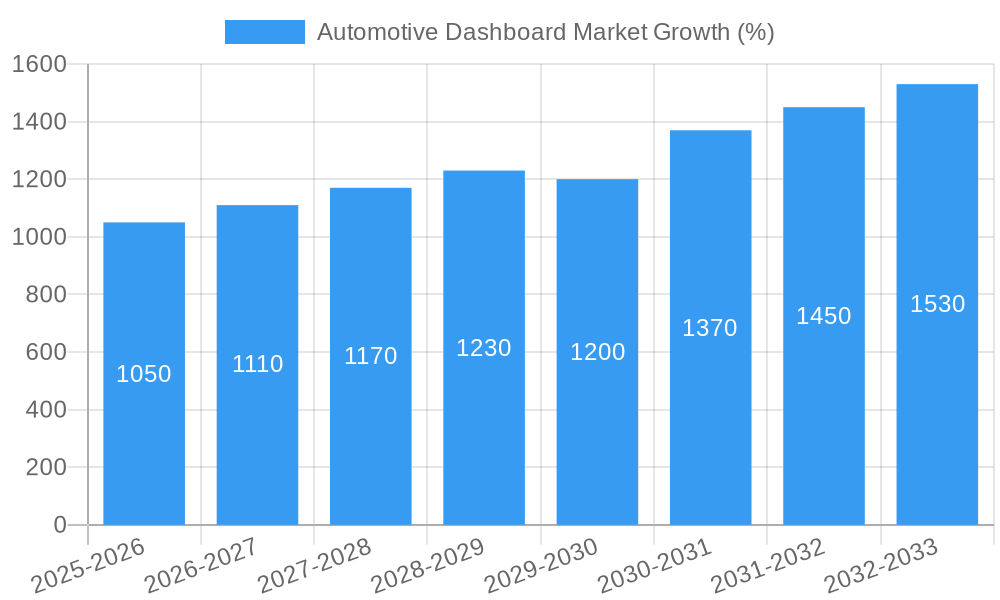
The global automotive dashboard market is experiencing robust growth, driven by increasing vehicle production, particularly in developing economies like China and India. The market's Compound Annual Growth Rate (CAGR) exceeding 7% from 2019 to 2024 indicates a significant upward trajectory. This expansion is fueled by several key factors. The rising adoption of advanced driver-assistance systems (ADAS) and infotainment features is pushing demand for sophisticated dashboards with larger displays and improved functionalities. The shift towards LCD and digital dashboards, replacing traditional analog designs, is another major contributor. Passenger cars currently dominate the market segment, but commercial vehicles are showing promising growth potential, driven by the increasing need for enhanced safety and driver convenience in fleet operations. The OEM (Original Equipment Manufacturer) sales channel holds a significant share, but the aftermarket segment is also expanding as consumers seek to upgrade their existing dashboards or replace damaged ones. Key players like ABB Ltd, Johnson Controls, and Visteon Corporation are constantly innovating to offer advanced features, creating competitive pressure and driving market expansion. The Asia-Pacific region is a key growth area, exhibiting high demand due to its booming automotive industry and increasing disposable incomes. While supply chain disruptions and raw material price fluctuations pose some challenges, the overall market outlook remains positive, with continued technological advancements expected to propel future growth through 2033.
The competitive landscape is characterized by both established international players and regional manufacturers. While established players benefit from extensive R&D capabilities and global distribution networks, regional manufacturers offer cost-competitive solutions catering to specific regional preferences. The market is witnessing increasing consolidation through mergers and acquisitions, as companies strive to expand their product portfolio and market reach. Future growth will likely depend on the successful integration of emerging technologies like artificial intelligence (AI), augmented reality (AR), and 5G connectivity into automotive dashboards. Furthermore, the development of sustainable and eco-friendly dashboards, focusing on material sourcing and energy efficiency, is gaining traction, aligning with global sustainability initiatives and consumer preferences. The focus on enhancing user experience and intuitive interface design will further influence market trends in the coming years. Strategic collaborations between dashboard manufacturers and automotive OEMs are also key to driving innovation and shaping the future of automotive dashboards.
Automotive Dashboard Market: A Comprehensive Report (2019-2033)
This comprehensive report provides an in-depth analysis of the Automotive Dashboard Market, encompassing market dynamics, growth trends, regional dominance, product landscape, key players, and future outlook. The study period covers 2019-2033, with 2025 as the base and estimated year. The forecast period spans 2025-2033, and the historical period encompasses 2019-2024. This report is invaluable for automotive manufacturers, component suppliers, technology providers, and investors seeking to understand this dynamic market. The market is segmented by Vehicle Type (Passenger Cars, Commercial Vehicles), Sales Channel (OEM, Aftermarket), and Type (LCD Dashboard, Conventional Dashboard).
Automotive Dashboard Market Market Dynamics & Structure
The automotive dashboard market is characterized by moderate concentration, with key players like ABB Ltd, Johnson Controls International PLC, Hainan Drinda Automotive Trim Co Ltd, Visteon Corporation, Dongfeng Electronic, Huayu Automotive Systems Co Ltd, Toyoda Gosei Co Ltd, Faurecia SE, and others competing for market share. The market is experiencing significant technological innovation, driven by the increasing demand for advanced driver-assistance systems (ADAS) and infotainment features. Stringent safety and emission regulations are shaping product development and adoption. The rise of LCD dashboards is displacing conventional dashboards, while the aftermarket segment presents opportunities for customization and upgrades. The market is witnessing several M&A activities, with an estimated xx million units of deals closed in the last five years, primarily focused on expanding product portfolios and technological capabilities.
- Market Concentration: Moderately concentrated, with top 5 players holding approximately xx% market share in 2024.
- Technological Innovation: Focus on ADAS integration, improved HMI, and lightweight materials.
- Regulatory Framework: Stringent safety and emission regulations drive innovation and standardization.
- Competitive Substitutes: Limited direct substitutes; competition is primarily based on features and pricing.
- End-User Demographics: Growing demand from luxury and premium vehicle segments.
- M&A Trends: Consolidation through strategic acquisitions to expand product offerings and technological expertise. Deal volume showed a xx% increase from 2020 to 2024.
Automotive Dashboard Market Growth Trends & Insights
The global automotive dashboard market witnessed significant growth during the historical period (2019-2024), expanding from xx million units to xx million units. This growth is primarily driven by increasing vehicle production, particularly in developing economies. The rising adoption of advanced driver-assistance systems (ADAS) and connected car technologies has fuelled demand for sophisticated dashboards with enhanced functionality. The shift towards LCD and digital dashboards is further accelerating market expansion. The market is expected to continue its growth trajectory, projected to reach xx million units by 2033, exhibiting a CAGR of xx% during the forecast period (2025-2033). The market penetration of LCD dashboards is expected to increase from xx% in 2024 to xx% by 2033. Consumer preference for advanced features and personalized experiences also contributes to the growth.
Dominant Regions, Countries, or Segments in Automotive Dashboard Market
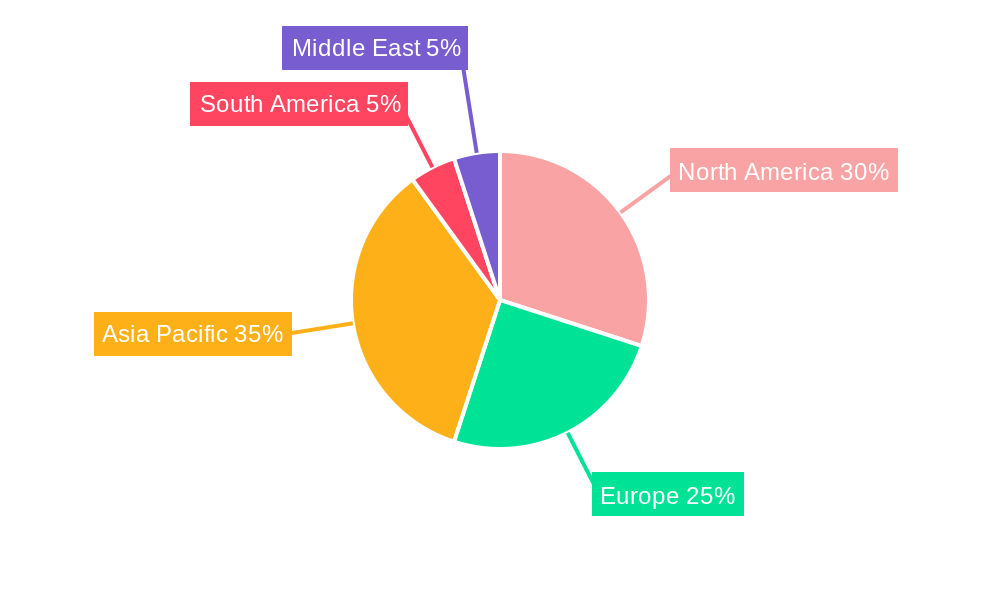
The Asia-Pacific region is currently the leading market for automotive dashboards, driven by robust vehicle production in countries like China and India. The region accounts for approximately xx% of the global market share in 2024 and is projected to maintain its dominance throughout the forecast period. Within the segments, Passenger Cars segment is the largest, with xx% of market share, followed by OEM sales channel, holding approximately xx% of the market.
- Key Drivers in Asia-Pacific: Rapid economic growth, increasing vehicle ownership, and supportive government policies.
- Passenger Cars Segment Dominance: High vehicle production and increasing adoption of advanced features.
- OEM Channel Prevalence: Majority of dashboards are supplied directly by manufacturers to original equipment manufacturers.
- Growth Potential: Significant opportunities in emerging markets like India and Southeast Asia.
Automotive Dashboard Market Product Landscape
The automotive dashboard market offers a range of products, from conventional analog dashboards to advanced LCD and digital displays. Innovation focuses on integrating larger displays, improved user interfaces (UI), advanced driver-assistance systems (ADAS) features, and enhanced connectivity options. Key selling propositions include intuitive designs, customizable displays, seamless integration with infotainment systems, and enhanced safety features. Technological advancements include the adoption of high-resolution displays, touch-sensitive interfaces, and haptic feedback.
Key Drivers, Barriers & Challenges in Automotive Dashboard Market
Key Drivers: Increasing vehicle production, rising demand for advanced features (ADAS and infotainment), technological advancements in display technology, and stringent safety regulations.
Challenges and Restraints: High initial investment costs for advanced dashboards, supply chain disruptions impacting component availability, and intense competition among manufacturers. The impact of component shortages is estimated to have reduced market growth by approximately xx% in 2022.
Emerging Opportunities in Automotive Dashboard Market
The market presents several emerging opportunities, including the expansion into electric vehicles (EVs), the integration of augmented reality (AR) and virtual reality (VR) technologies, and the development of personalized dashboards with customizable settings. Untapped markets in developing countries also offer substantial growth potential. Increased focus on sustainable and eco-friendly materials is another emerging trend.
Growth Accelerators in the Automotive Dashboard Market Industry
Long-term growth will be driven by technological breakthroughs such as the introduction of holographic displays, advancements in artificial intelligence (AI) for driver assistance, and the development of lightweight and energy-efficient materials. Strategic partnerships between dashboard manufacturers and technology companies will play a crucial role in accelerating innovation and market penetration. Expansion into new markets and the development of customized solutions for specific vehicle segments will also contribute to market growth.
Key Players Shaping the Automotive Dashboard Market Market
- ABB Ltd
- Johnson Controls International PLC
- Hainan Drinda Automotive Trim Co Ltd
- Visteon Corporation
- Fusioncharts
- Dongfeng Electronic
- Huayu Automotive Systems Co Ltd
- Toyoda Gosei Co Ltd
- IA
- Faurecia SE
Notable Milestones in Automotive Dashboard Market Sector
- 2020: Introduction of several new LCD dashboards with enhanced functionalities by key players.
- 2021: Significant increase in the adoption of ADAS-integrated dashboards.
- 2022: Several mergers and acquisitions within the automotive dashboard component supplier segment.
- 2023: Launch of a new generation of dashboards with AI-powered features.
- 2024: Increased focus on sustainability and the development of eco-friendly dashboard materials.
In-Depth Automotive Dashboard Market Market Outlook
The automotive dashboard market is poised for continued growth in the coming years, driven by several factors, including the rising popularity of electric vehicles, the increasing adoption of advanced driver-assistance systems (ADAS), and the growing demand for personalized in-car experiences. Strategic partnerships and technological advancements, including the integration of augmented reality (AR) and virtual reality (VR) technologies, will further propel market expansion. The market presents significant opportunities for companies that can innovate and meet the evolving needs of consumers and automakers.
Automotive Dashboard Market Segmentation
-
1. Type
- 1.1. LCD Dashboard
- 1.2. Conventional Dashboard
-
2. Vehicle Type
- 2.1. Passenger Cars
- 2.2. Commercial Vehicles
-
3. Sales Channel
- 3.1. OEM
- 3.2. Aftermarket
Automotive Dashboard Market Segmentation By Geography
-
1. North America
- 1.1. United Sates
- 1.2. Canada
- 1.3. Rest of North America
-
2. Europe
- 2.1. Germany
- 2.2. United Kingdom
- 2.3. France
- 2.4. Russia
- 2.5. Rest of Europe
-
3. Asia Pacific
- 3.1. India
- 3.2. China
- 3.3. Japan
- 3.4. Rest of Asia Pacific
-
4. South America
- 4.1. Brazil
- 4.2. Argentina
- 4.3. Rest of South America
- 5. Middle East
-
6. United Arab Emirates
- 6.1. Saudi Arabia
- 6.2. Rest of Middle East
Automotive Dashboard Market REPORT HIGHLIGHTS
| Aspects | Details |
|---|---|
| Study Period | 2019-2033 |
| Base Year | 2024 |
| Estimated Year | 2025 |
| Forecast Period | 2025-2033 |
| Historical Period | 2019-2024 |
| Growth Rate | CAGR of > 7.00% from 2019-2033 |
| Segmentation |
|
Table of Contents
- 1. Introduction
- 1.1. Research Scope
- 1.2. Market Segmentation
- 1.3. Research Methodology
- 1.4. Definitions and Assumptions
- 2. Executive Summary
- 2.1. Introduction
- 3. Market Dynamics
- 3.1. Introduction
- 3.2. Market Drivers
- 3.2.1. Ease of Steering
- 3.3. Market Restrains
- 3.3.1. Cost and Price Sensitivity
- 3.4. Market Trends
- 3.4.1. Technological Developments Creating Demand for LCD Dashboards
- 4. Market Factor Analysis
- 4.1. Porters Five Forces
- 4.2. Supply/Value Chain
- 4.3. PESTEL analysis
- 4.4. Market Entropy
- 4.5. Patent/Trademark Analysis
- 5. Global Automotive Dashboard Market Analysis, Insights and Forecast, 2019-2031
- 5.1. Market Analysis, Insights and Forecast - by Type
- 5.1.1. LCD Dashboard
- 5.1.2. Conventional Dashboard
- 5.2. Market Analysis, Insights and Forecast - by Vehicle Type
- 5.2.1. Passenger Cars
- 5.2.2. Commercial Vehicles
- 5.3. Market Analysis, Insights and Forecast - by Sales Channel
- 5.3.1. OEM
- 5.3.2. Aftermarket
- 5.4. Market Analysis, Insights and Forecast - by Region
- 5.4.1. North America
- 5.4.2. Europe
- 5.4.3. Asia Pacific
- 5.4.4. South America
- 5.4.5. Middle East
- 5.4.6. United Arab Emirates
- 5.1. Market Analysis, Insights and Forecast - by Type
- 6. North America Automotive Dashboard Market Analysis, Insights and Forecast, 2019-2031
- 6.1. Market Analysis, Insights and Forecast - by Type
- 6.1.1. LCD Dashboard
- 6.1.2. Conventional Dashboard
- 6.2. Market Analysis, Insights and Forecast - by Vehicle Type
- 6.2.1. Passenger Cars
- 6.2.2. Commercial Vehicles
- 6.3. Market Analysis, Insights and Forecast - by Sales Channel
- 6.3.1. OEM
- 6.3.2. Aftermarket
- 6.1. Market Analysis, Insights and Forecast - by Type
- 7. Europe Automotive Dashboard Market Analysis, Insights and Forecast, 2019-2031
- 7.1. Market Analysis, Insights and Forecast - by Type
- 7.1.1. LCD Dashboard
- 7.1.2. Conventional Dashboard
- 7.2. Market Analysis, Insights and Forecast - by Vehicle Type
- 7.2.1. Passenger Cars
- 7.2.2. Commercial Vehicles
- 7.3. Market Analysis, Insights and Forecast - by Sales Channel
- 7.3.1. OEM
- 7.3.2. Aftermarket
- 7.1. Market Analysis, Insights and Forecast - by Type
- 8. Asia Pacific Automotive Dashboard Market Analysis, Insights and Forecast, 2019-2031
- 8.1. Market Analysis, Insights and Forecast - by Type
- 8.1.1. LCD Dashboard
- 8.1.2. Conventional Dashboard
- 8.2. Market Analysis, Insights and Forecast - by Vehicle Type
- 8.2.1. Passenger Cars
- 8.2.2. Commercial Vehicles
- 8.3. Market Analysis, Insights and Forecast - by Sales Channel
- 8.3.1. OEM
- 8.3.2. Aftermarket
- 8.1. Market Analysis, Insights and Forecast - by Type
- 9. South America Automotive Dashboard Market Analysis, Insights and Forecast, 2019-2031
- 9.1. Market Analysis, Insights and Forecast - by Type
- 9.1.1. LCD Dashboard
- 9.1.2. Conventional Dashboard
- 9.2. Market Analysis, Insights and Forecast - by Vehicle Type
- 9.2.1. Passenger Cars
- 9.2.2. Commercial Vehicles
- 9.3. Market Analysis, Insights and Forecast - by Sales Channel
- 9.3.1. OEM
- 9.3.2. Aftermarket
- 9.1. Market Analysis, Insights and Forecast - by Type
- 10. Middle East Automotive Dashboard Market Analysis, Insights and Forecast, 2019-2031
- 10.1. Market Analysis, Insights and Forecast - by Type
- 10.1.1. LCD Dashboard
- 10.1.2. Conventional Dashboard
- 10.2. Market Analysis, Insights and Forecast - by Vehicle Type
- 10.2.1. Passenger Cars
- 10.2.2. Commercial Vehicles
- 10.3. Market Analysis, Insights and Forecast - by Sales Channel
- 10.3.1. OEM
- 10.3.2. Aftermarket
- 10.1. Market Analysis, Insights and Forecast - by Type
- 11. United Arab Emirates Automotive Dashboard Market Analysis, Insights and Forecast, 2019-2031
- 11.1. Market Analysis, Insights and Forecast - by Type
- 11.1.1. LCD Dashboard
- 11.1.2. Conventional Dashboard
- 11.2. Market Analysis, Insights and Forecast - by Vehicle Type
- 11.2.1. Passenger Cars
- 11.2.2. Commercial Vehicles
- 11.3. Market Analysis, Insights and Forecast - by Sales Channel
- 11.3.1. OEM
- 11.3.2. Aftermarket
- 11.1. Market Analysis, Insights and Forecast - by Type
- 12. North America Automotive Dashboard Market Analysis, Insights and Forecast, 2019-2031
- 12.1. Market Analysis, Insights and Forecast - By Country/Sub-region
- 12.1.1 United Sates
- 12.1.2 Canada
- 12.1.3 Rest of North America
- 13. Europe Automotive Dashboard Market Analysis, Insights and Forecast, 2019-2031
- 13.1. Market Analysis, Insights and Forecast - By Country/Sub-region
- 13.1.1 Germany
- 13.1.2 United Kingdom
- 13.1.3 France
- 13.1.4 Russia
- 13.1.5 Rest of Europe
- 14. Asia Pacific Automotive Dashboard Market Analysis, Insights and Forecast, 2019-2031
- 14.1. Market Analysis, Insights and Forecast - By Country/Sub-region
- 14.1.1 India
- 14.1.2 China
- 14.1.3 Japan
- 14.1.4 Rest of Asia Pacific
- 15. South America Automotive Dashboard Market Analysis, Insights and Forecast, 2019-2031
- 15.1. Market Analysis, Insights and Forecast - By Country/Sub-region
- 15.1.1 Brazil
- 15.1.2 Argentina
- 15.1.3 Rest of South America
- 16. Middle East Automotive Dashboard Market Analysis, Insights and Forecast, 2019-2031
- 16.1. Market Analysis, Insights and Forecast - By Country/Sub-region
- 16.1.1.
- 17. United Arab Emirates Automotive Dashboard Market Analysis, Insights and Forecast, 2019-2031
- 17.1. Market Analysis, Insights and Forecast - By Country/Sub-region
- 17.1.1 Saudi Arabia
- 17.1.2 Rest of Middle East
- 18. Competitive Analysis
- 18.1. Global Market Share Analysis 2024
- 18.2. Company Profiles
- 18.2.1 ABB Ltd
- 18.2.1.1. Overview
- 18.2.1.2. Products
- 18.2.1.3. SWOT Analysis
- 18.2.1.4. Recent Developments
- 18.2.1.5. Financials (Based on Availability)
- 18.2.2 Johnson Controls International PLC
- 18.2.2.1. Overview
- 18.2.2.2. Products
- 18.2.2.3. SWOT Analysis
- 18.2.2.4. Recent Developments
- 18.2.2.5. Financials (Based on Availability)
- 18.2.3 Hainan Drinda Automotive Trim Co Ltd
- 18.2.3.1. Overview
- 18.2.3.2. Products
- 18.2.3.3. SWOT Analysis
- 18.2.3.4. Recent Developments
- 18.2.3.5. Financials (Based on Availability)
- 18.2.4 Visteon Corporation
- 18.2.4.1. Overview
- 18.2.4.2. Products
- 18.2.4.3. SWOT Analysis
- 18.2.4.4. Recent Developments
- 18.2.4.5. Financials (Based on Availability)
- 18.2.5 Fusioncharts
- 18.2.5.1. Overview
- 18.2.5.2. Products
- 18.2.5.3. SWOT Analysis
- 18.2.5.4. Recent Developments
- 18.2.5.5. Financials (Based on Availability)
- 18.2.6 Dongfeng Electronic
- 18.2.6.1. Overview
- 18.2.6.2. Products
- 18.2.6.3. SWOT Analysis
- 18.2.6.4. Recent Developments
- 18.2.6.5. Financials (Based on Availability)
- 18.2.7 Huayu Automotive Systems Co Ltd
- 18.2.7.1. Overview
- 18.2.7.2. Products
- 18.2.7.3. SWOT Analysis
- 18.2.7.4. Recent Developments
- 18.2.7.5. Financials (Based on Availability)
- 18.2.8 Toyoda Gosei Co Ltd
- 18.2.8.1. Overview
- 18.2.8.2. Products
- 18.2.8.3. SWOT Analysis
- 18.2.8.4. Recent Developments
- 18.2.8.5. Financials (Based on Availability)
- 18.2.9 IA
- 18.2.9.1. Overview
- 18.2.9.2. Products
- 18.2.9.3. SWOT Analysis
- 18.2.9.4. Recent Developments
- 18.2.9.5. Financials (Based on Availability)
- 18.2.10 Faurecia SE
- 18.2.10.1. Overview
- 18.2.10.2. Products
- 18.2.10.3. SWOT Analysis
- 18.2.10.4. Recent Developments
- 18.2.10.5. Financials (Based on Availability)
- 18.2.1 ABB Ltd
List of Figures
- Figure 1: Global Automotive Dashboard Market Revenue Breakdown (Million, %) by Region 2024 & 2032
- Figure 2: North America Automotive Dashboard Market Revenue (Million), by Country 2024 & 2032
- Figure 3: North America Automotive Dashboard Market Revenue Share (%), by Country 2024 & 2032
- Figure 4: Europe Automotive Dashboard Market Revenue (Million), by Country 2024 & 2032
- Figure 5: Europe Automotive Dashboard Market Revenue Share (%), by Country 2024 & 2032
- Figure 6: Asia Pacific Automotive Dashboard Market Revenue (Million), by Country 2024 & 2032
- Figure 7: Asia Pacific Automotive Dashboard Market Revenue Share (%), by Country 2024 & 2032
- Figure 8: South America Automotive Dashboard Market Revenue (Million), by Country 2024 & 2032
- Figure 9: South America Automotive Dashboard Market Revenue Share (%), by Country 2024 & 2032
- Figure 10: Middle East Automotive Dashboard Market Revenue (Million), by Country 2024 & 2032
- Figure 11: Middle East Automotive Dashboard Market Revenue Share (%), by Country 2024 & 2032
- Figure 12: United Arab Emirates Automotive Dashboard Market Revenue (Million), by Country 2024 & 2032
- Figure 13: United Arab Emirates Automotive Dashboard Market Revenue Share (%), by Country 2024 & 2032
- Figure 14: North America Automotive Dashboard Market Revenue (Million), by Type 2024 & 2032
- Figure 15: North America Automotive Dashboard Market Revenue Share (%), by Type 2024 & 2032
- Figure 16: North America Automotive Dashboard Market Revenue (Million), by Vehicle Type 2024 & 2032
- Figure 17: North America Automotive Dashboard Market Revenue Share (%), by Vehicle Type 2024 & 2032
- Figure 18: North America Automotive Dashboard Market Revenue (Million), by Sales Channel 2024 & 2032
- Figure 19: North America Automotive Dashboard Market Revenue Share (%), by Sales Channel 2024 & 2032
- Figure 20: North America Automotive Dashboard Market Revenue (Million), by Country 2024 & 2032
- Figure 21: North America Automotive Dashboard Market Revenue Share (%), by Country 2024 & 2032
- Figure 22: Europe Automotive Dashboard Market Revenue (Million), by Type 2024 & 2032
- Figure 23: Europe Automotive Dashboard Market Revenue Share (%), by Type 2024 & 2032
- Figure 24: Europe Automotive Dashboard Market Revenue (Million), by Vehicle Type 2024 & 2032
- Figure 25: Europe Automotive Dashboard Market Revenue Share (%), by Vehicle Type 2024 & 2032
- Figure 26: Europe Automotive Dashboard Market Revenue (Million), by Sales Channel 2024 & 2032
- Figure 27: Europe Automotive Dashboard Market Revenue Share (%), by Sales Channel 2024 & 2032
- Figure 28: Europe Automotive Dashboard Market Revenue (Million), by Country 2024 & 2032
- Figure 29: Europe Automotive Dashboard Market Revenue Share (%), by Country 2024 & 2032
- Figure 30: Asia Pacific Automotive Dashboard Market Revenue (Million), by Type 2024 & 2032
- Figure 31: Asia Pacific Automotive Dashboard Market Revenue Share (%), by Type 2024 & 2032
- Figure 32: Asia Pacific Automotive Dashboard Market Revenue (Million), by Vehicle Type 2024 & 2032
- Figure 33: Asia Pacific Automotive Dashboard Market Revenue Share (%), by Vehicle Type 2024 & 2032
- Figure 34: Asia Pacific Automotive Dashboard Market Revenue (Million), by Sales Channel 2024 & 2032
- Figure 35: Asia Pacific Automotive Dashboard Market Revenue Share (%), by Sales Channel 2024 & 2032
- Figure 36: Asia Pacific Automotive Dashboard Market Revenue (Million), by Country 2024 & 2032
- Figure 37: Asia Pacific Automotive Dashboard Market Revenue Share (%), by Country 2024 & 2032
- Figure 38: South America Automotive Dashboard Market Revenue (Million), by Type 2024 & 2032
- Figure 39: South America Automotive Dashboard Market Revenue Share (%), by Type 2024 & 2032
- Figure 40: South America Automotive Dashboard Market Revenue (Million), by Vehicle Type 2024 & 2032
- Figure 41: South America Automotive Dashboard Market Revenue Share (%), by Vehicle Type 2024 & 2032
- Figure 42: South America Automotive Dashboard Market Revenue (Million), by Sales Channel 2024 & 2032
- Figure 43: South America Automotive Dashboard Market Revenue Share (%), by Sales Channel 2024 & 2032
- Figure 44: South America Automotive Dashboard Market Revenue (Million), by Country 2024 & 2032
- Figure 45: South America Automotive Dashboard Market Revenue Share (%), by Country 2024 & 2032
- Figure 46: Middle East Automotive Dashboard Market Revenue (Million), by Type 2024 & 2032
- Figure 47: Middle East Automotive Dashboard Market Revenue Share (%), by Type 2024 & 2032
- Figure 48: Middle East Automotive Dashboard Market Revenue (Million), by Vehicle Type 2024 & 2032
- Figure 49: Middle East Automotive Dashboard Market Revenue Share (%), by Vehicle Type 2024 & 2032
- Figure 50: Middle East Automotive Dashboard Market Revenue (Million), by Sales Channel 2024 & 2032
- Figure 51: Middle East Automotive Dashboard Market Revenue Share (%), by Sales Channel 2024 & 2032
- Figure 52: Middle East Automotive Dashboard Market Revenue (Million), by Country 2024 & 2032
- Figure 53: Middle East Automotive Dashboard Market Revenue Share (%), by Country 2024 & 2032
- Figure 54: United Arab Emirates Automotive Dashboard Market Revenue (Million), by Type 2024 & 2032
- Figure 55: United Arab Emirates Automotive Dashboard Market Revenue Share (%), by Type 2024 & 2032
- Figure 56: United Arab Emirates Automotive Dashboard Market Revenue (Million), by Vehicle Type 2024 & 2032
- Figure 57: United Arab Emirates Automotive Dashboard Market Revenue Share (%), by Vehicle Type 2024 & 2032
- Figure 58: United Arab Emirates Automotive Dashboard Market Revenue (Million), by Sales Channel 2024 & 2032
- Figure 59: United Arab Emirates Automotive Dashboard Market Revenue Share (%), by Sales Channel 2024 & 2032
- Figure 60: United Arab Emirates Automotive Dashboard Market Revenue (Million), by Country 2024 & 2032
- Figure 61: United Arab Emirates Automotive Dashboard Market Revenue Share (%), by Country 2024 & 2032
List of Tables
- Table 1: Global Automotive Dashboard Market Revenue Million Forecast, by Region 2019 & 2032
- Table 2: Global Automotive Dashboard Market Revenue Million Forecast, by Type 2019 & 2032
- Table 3: Global Automotive Dashboard Market Revenue Million Forecast, by Vehicle Type 2019 & 2032
- Table 4: Global Automotive Dashboard Market Revenue Million Forecast, by Sales Channel 2019 & 2032
- Table 5: Global Automotive Dashboard Market Revenue Million Forecast, by Region 2019 & 2032
- Table 6: Global Automotive Dashboard Market Revenue Million Forecast, by Country 2019 & 2032
- Table 7: United Sates Automotive Dashboard Market Revenue (Million) Forecast, by Application 2019 & 2032
- Table 8: Canada Automotive Dashboard Market Revenue (Million) Forecast, by Application 2019 & 2032
- Table 9: Rest of North America Automotive Dashboard Market Revenue (Million) Forecast, by Application 2019 & 2032
- Table 10: Global Automotive Dashboard Market Revenue Million Forecast, by Country 2019 & 2032
- Table 11: Germany Automotive Dashboard Market Revenue (Million) Forecast, by Application 2019 & 2032
- Table 12: United Kingdom Automotive Dashboard Market Revenue (Million) Forecast, by Application 2019 & 2032
- Table 13: France Automotive Dashboard Market Revenue (Million) Forecast, by Application 2019 & 2032
- Table 14: Russia Automotive Dashboard Market Revenue (Million) Forecast, by Application 2019 & 2032
- Table 15: Rest of Europe Automotive Dashboard Market Revenue (Million) Forecast, by Application 2019 & 2032
- Table 16: Global Automotive Dashboard Market Revenue Million Forecast, by Country 2019 & 2032
- Table 17: India Automotive Dashboard Market Revenue (Million) Forecast, by Application 2019 & 2032
- Table 18: China Automotive Dashboard Market Revenue (Million) Forecast, by Application 2019 & 2032
- Table 19: Japan Automotive Dashboard Market Revenue (Million) Forecast, by Application 2019 & 2032
- Table 20: Rest of Asia Pacific Automotive Dashboard Market Revenue (Million) Forecast, by Application 2019 & 2032
- Table 21: Global Automotive Dashboard Market Revenue Million Forecast, by Country 2019 & 2032
- Table 22: Brazil Automotive Dashboard Market Revenue (Million) Forecast, by Application 2019 & 2032
- Table 23: Argentina Automotive Dashboard Market Revenue (Million) Forecast, by Application 2019 & 2032
- Table 24: Rest of South America Automotive Dashboard Market Revenue (Million) Forecast, by Application 2019 & 2032
- Table 25: Global Automotive Dashboard Market Revenue Million Forecast, by Country 2019 & 2032
- Table 26: Automotive Dashboard Market Revenue (Million) Forecast, by Application 2019 & 2032
- Table 27: Global Automotive Dashboard Market Revenue Million Forecast, by Country 2019 & 2032
- Table 28: Saudi Arabia Automotive Dashboard Market Revenue (Million) Forecast, by Application 2019 & 2032
- Table 29: Rest of Middle East Automotive Dashboard Market Revenue (Million) Forecast, by Application 2019 & 2032
- Table 30: Global Automotive Dashboard Market Revenue Million Forecast, by Type 2019 & 2032
- Table 31: Global Automotive Dashboard Market Revenue Million Forecast, by Vehicle Type 2019 & 2032
- Table 32: Global Automotive Dashboard Market Revenue Million Forecast, by Sales Channel 2019 & 2032
- Table 33: Global Automotive Dashboard Market Revenue Million Forecast, by Country 2019 & 2032
- Table 34: United Sates Automotive Dashboard Market Revenue (Million) Forecast, by Application 2019 & 2032
- Table 35: Canada Automotive Dashboard Market Revenue (Million) Forecast, by Application 2019 & 2032
- Table 36: Rest of North America Automotive Dashboard Market Revenue (Million) Forecast, by Application 2019 & 2032
- Table 37: Global Automotive Dashboard Market Revenue Million Forecast, by Type 2019 & 2032
- Table 38: Global Automotive Dashboard Market Revenue Million Forecast, by Vehicle Type 2019 & 2032
- Table 39: Global Automotive Dashboard Market Revenue Million Forecast, by Sales Channel 2019 & 2032
- Table 40: Global Automotive Dashboard Market Revenue Million Forecast, by Country 2019 & 2032
- Table 41: Germany Automotive Dashboard Market Revenue (Million) Forecast, by Application 2019 & 2032
- Table 42: United Kingdom Automotive Dashboard Market Revenue (Million) Forecast, by Application 2019 & 2032
- Table 43: France Automotive Dashboard Market Revenue (Million) Forecast, by Application 2019 & 2032
- Table 44: Russia Automotive Dashboard Market Revenue (Million) Forecast, by Application 2019 & 2032
- Table 45: Rest of Europe Automotive Dashboard Market Revenue (Million) Forecast, by Application 2019 & 2032
- Table 46: Global Automotive Dashboard Market Revenue Million Forecast, by Type 2019 & 2032
- Table 47: Global Automotive Dashboard Market Revenue Million Forecast, by Vehicle Type 2019 & 2032
- Table 48: Global Automotive Dashboard Market Revenue Million Forecast, by Sales Channel 2019 & 2032
- Table 49: Global Automotive Dashboard Market Revenue Million Forecast, by Country 2019 & 2032
- Table 50: India Automotive Dashboard Market Revenue (Million) Forecast, by Application 2019 & 2032
- Table 51: China Automotive Dashboard Market Revenue (Million) Forecast, by Application 2019 & 2032
- Table 52: Japan Automotive Dashboard Market Revenue (Million) Forecast, by Application 2019 & 2032
- Table 53: Rest of Asia Pacific Automotive Dashboard Market Revenue (Million) Forecast, by Application 2019 & 2032
- Table 54: Global Automotive Dashboard Market Revenue Million Forecast, by Type 2019 & 2032
- Table 55: Global Automotive Dashboard Market Revenue Million Forecast, by Vehicle Type 2019 & 2032
- Table 56: Global Automotive Dashboard Market Revenue Million Forecast, by Sales Channel 2019 & 2032
- Table 57: Global Automotive Dashboard Market Revenue Million Forecast, by Country 2019 & 2032
- Table 58: Brazil Automotive Dashboard Market Revenue (Million) Forecast, by Application 2019 & 2032
- Table 59: Argentina Automotive Dashboard Market Revenue (Million) Forecast, by Application 2019 & 2032
- Table 60: Rest of South America Automotive Dashboard Market Revenue (Million) Forecast, by Application 2019 & 2032
- Table 61: Global Automotive Dashboard Market Revenue Million Forecast, by Type 2019 & 2032
- Table 62: Global Automotive Dashboard Market Revenue Million Forecast, by Vehicle Type 2019 & 2032
- Table 63: Global Automotive Dashboard Market Revenue Million Forecast, by Sales Channel 2019 & 2032
- Table 64: Global Automotive Dashboard Market Revenue Million Forecast, by Country 2019 & 2032
- Table 65: Global Automotive Dashboard Market Revenue Million Forecast, by Type 2019 & 2032
- Table 66: Global Automotive Dashboard Market Revenue Million Forecast, by Vehicle Type 2019 & 2032
- Table 67: Global Automotive Dashboard Market Revenue Million Forecast, by Sales Channel 2019 & 2032
- Table 68: Global Automotive Dashboard Market Revenue Million Forecast, by Country 2019 & 2032
- Table 69: Saudi Arabia Automotive Dashboard Market Revenue (Million) Forecast, by Application 2019 & 2032
- Table 70: Rest of Middle East Automotive Dashboard Market Revenue (Million) Forecast, by Application 2019 & 2032
Frequently Asked Questions
1. What is the projected Compound Annual Growth Rate (CAGR) of the Automotive Dashboard Market?
The projected CAGR is approximately > 7.00%.
2. Which companies are prominent players in the Automotive Dashboard Market?
Key companies in the market include ABB Ltd, Johnson Controls International PLC, Hainan Drinda Automotive Trim Co Ltd, Visteon Corporation, Fusioncharts, Dongfeng Electronic, Huayu Automotive Systems Co Ltd, Toyoda Gosei Co Ltd, IA, Faurecia SE.
3. What are the main segments of the Automotive Dashboard Market?
The market segments include Type, Vehicle Type, Sales Channel.
4. Can you provide details about the market size?
The market size is estimated to be USD XX Million as of 2022.
5. What are some drivers contributing to market growth?
Ease of Steering.
6. What are the notable trends driving market growth?
Technological Developments Creating Demand for LCD Dashboards.
7. Are there any restraints impacting market growth?
Cost and Price Sensitivity.
8. Can you provide examples of recent developments in the market?
N/A
9. What pricing options are available for accessing the report?
Pricing options include single-user, multi-user, and enterprise licenses priced at USD 4750, USD 5250, and USD 8750 respectively.
10. Is the market size provided in terms of value or volume?
The market size is provided in terms of value, measured in Million.
11. Are there any specific market keywords associated with the report?
Yes, the market keyword associated with the report is "Automotive Dashboard Market," which aids in identifying and referencing the specific market segment covered.
12. How do I determine which pricing option suits my needs best?
The pricing options vary based on user requirements and access needs. Individual users may opt for single-user licenses, while businesses requiring broader access may choose multi-user or enterprise licenses for cost-effective access to the report.
13. Are there any additional resources or data provided in the Automotive Dashboard Market report?
While the report offers comprehensive insights, it's advisable to review the specific contents or supplementary materials provided to ascertain if additional resources or data are available.
14. How can I stay updated on further developments or reports in the Automotive Dashboard Market?
To stay informed about further developments, trends, and reports in the Automotive Dashboard Market, consider subscribing to industry newsletters, following relevant companies and organizations, or regularly checking reputable industry news sources and publications.
Methodology
Step 1 - Identification of Relevant Samples Size from Population Database


Step 2 - Approaches for Defining Global Market Size (Value, Volume* & Price*)

Note*: In applicable scenarios
Step 3 - Data Sources
Primary Research
- Web Analytics
- Survey Reports
- Research Institute
- Latest Research Reports
- Opinion Leaders
Secondary Research
- Annual Reports
- White Paper
- Latest Press Release
- Industry Association
- Paid Database
- Investor Presentations

Step 4 - Data Triangulation
Involves using different sources of information in order to increase the validity of a study
These sources are likely to be stakeholders in a program - participants, other researchers, program staff, other community members, and so on.
Then we put all data in single framework & apply various statistical tools to find out the dynamic on the market.
During the analysis stage, feedback from the stakeholder groups would be compared to determine areas of agreement as well as areas of divergence


