
Key Insights
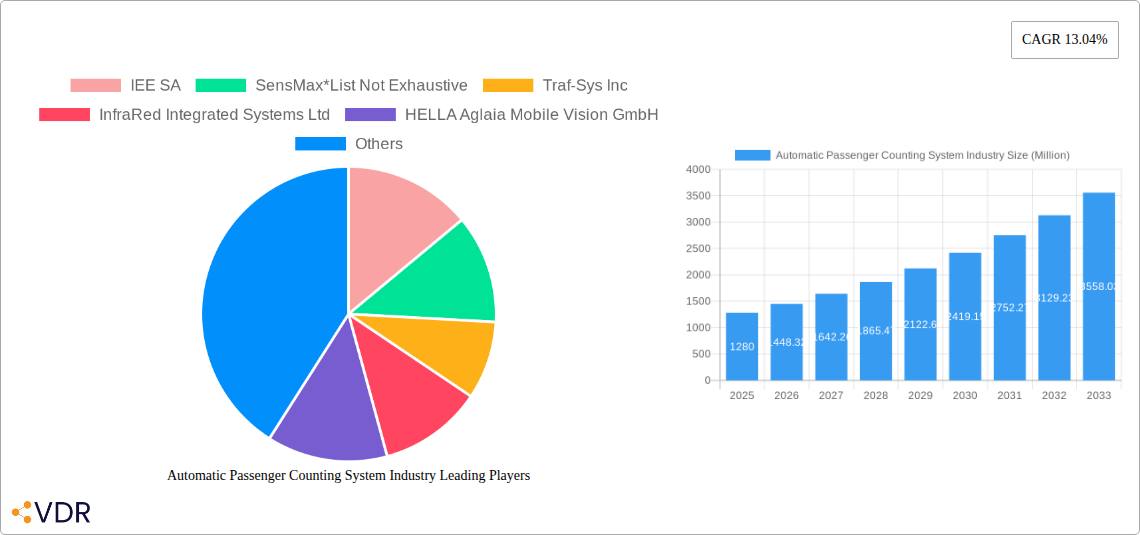
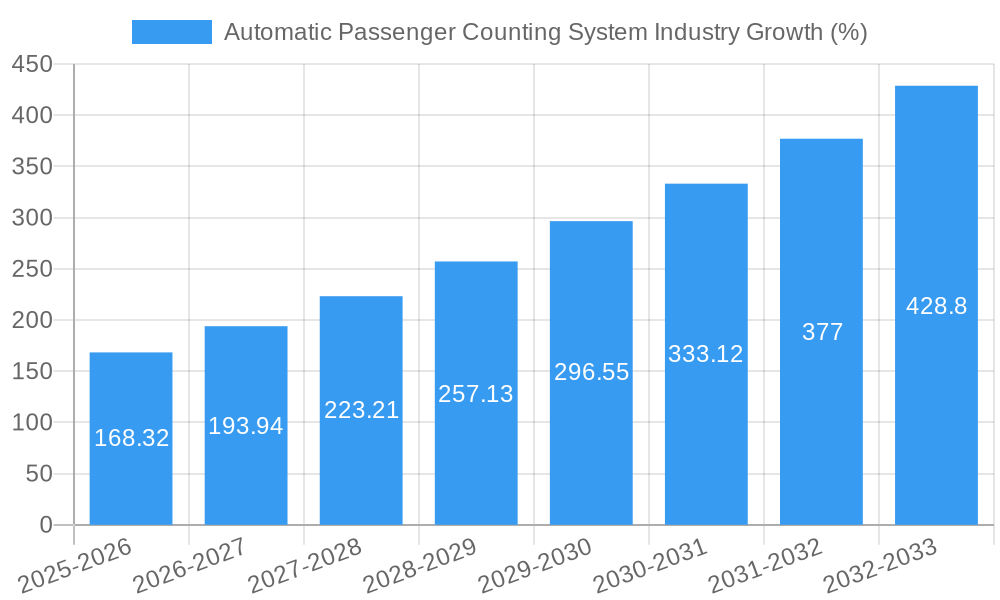
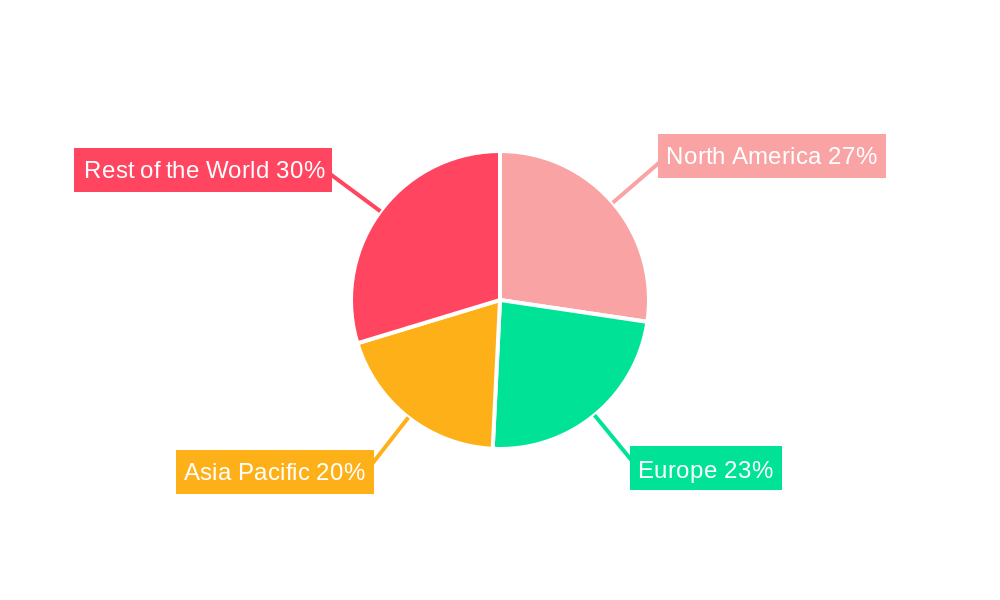
The Automatic Passenger Counting System (APCS) market is experiencing robust growth, projected to reach \$1.28 billion in 2025 and maintain a Compound Annual Growth Rate (CAGR) of 13.04% from 2025 to 2033. This expansion is driven by several key factors. Increasing urbanization and the consequent rise in public transportation ridership necessitate accurate and efficient passenger counting for optimized resource allocation and improved service planning. Furthermore, the growing adoption of smart city initiatives and the integration of APCS into broader transportation management systems are fueling market growth. The demand for real-time data analytics for improved decision-making and enhanced passenger experience is also a significant driver. Technological advancements, such as the incorporation of AI and machine learning for improved accuracy and data processing, are further propelling market expansion. Segment-wise, the software and services segment is expected to witness significant growth due to the increasing demand for sophisticated data analytics and integration capabilities. Geographically, North America and Europe currently hold a substantial market share, driven by advanced infrastructure and early adoption of smart city technologies; however, the Asia-Pacific region is poised for significant growth due to rapid urbanization and substantial investments in public transportation infrastructure. While initial investment costs and concerns about data privacy might pose some restraints, the overall market outlook for APCS remains exceptionally positive.
The competitive landscape is characterized by a mix of established players and emerging technology providers. Companies like IEE SA, SensMax, Traf-Sys Inc, and others are actively involved in developing and deploying innovative APCS solutions. The market is likely to witness increased mergers and acquisitions, strategic partnerships, and technological innovations in the coming years. The focus will shift towards the development of more sophisticated, integrated systems that can provide comprehensive data analysis and insights for improved transportation management and enhanced passenger experiences. This includes the integration of APCS with other smart city technologies, such as intelligent transportation systems and real-time information displays. The market is expected to see increasing demand for cloud-based solutions and advanced analytics capabilities, enabling more efficient data management and analysis for better decision-making.
Automatic Passenger Counting System Industry Market Report: 2019-2033
This comprehensive report provides an in-depth analysis of the Automatic Passenger Counting System (APCS) industry, encompassing market dynamics, growth trends, regional dominance, product landscape, key players, and future outlook. With a focus on both parent (Passenger Counting Systems) and child (specific applications within various sectors) markets, this report offers actionable insights for industry professionals, investors, and strategic decision-makers. The study period spans 2019-2033, with a base year of 2025 and a forecast period of 2025-2033. Market values are presented in million units.
Automatic Passenger Counting System Industry Market Dynamics & Structure
This section analyzes the competitive landscape of the APCS market, evaluating market concentration, technological advancements, regulatory influences, and the impact of substitute products. We delve into end-user demographics, exploring shifts in passenger behavior and their effect on demand. Furthermore, the report examines mergers and acquisitions (M&A) activity within the industry, providing quantitative data on deal volumes and qualitative insights into the drivers and challenges of such transactions.
- Market Concentration: The APCS market exhibits a moderately concentrated structure, with xx% market share held by the top 5 players in 2025.
- Technological Innovation: Continuous advancements in sensor technology (e.g., LiDAR, 3D imaging) are driving market growth, alongside improvements in data analytics and cloud-based solutions. However, integration complexities and high initial investment costs present barriers to innovation.
- Regulatory Frameworks: Government regulations mandating passenger counting in public transport and building safety codes are impacting market growth positively, particularly in developed regions.
- Competitive Substitutes: Manual counting methods still exist, but the accuracy, efficiency, and data-driven insights provided by APCS are gradually rendering them obsolete.
- M&A Trends: The number of M&A deals in the APCS industry reached xx in 2024, driven by consolidation efforts among key players and a desire to expand into new markets/segments.
Automatic Passenger Counting System Industry Growth Trends & Insights
This section provides a detailed analysis of the APCS market's growth trajectory, utilizing extensive market research data to project future trends. We examine market size evolution, penetration rates across various end-user segments, and the disruptive influence of technological advancements. The report also explores shifts in consumer behavior and their implications for the industry. Key metrics, including the Compound Annual Growth Rate (CAGR) and market penetration, are presented to provide a clear understanding of the market's dynamic nature. The APCS market is projected to reach xx million units by 2033, demonstrating a CAGR of xx% during the forecast period (2025-2033). This growth is fueled by increasing adoption in various sectors and technological enhancements leading to higher accuracy and efficiency.
Dominant Regions, Countries, or Segments in Automatic Passenger Counting System Industry
This section identifies the leading geographical regions and market segments within the APCS industry, highlighting the key factors driving their growth. We examine the market share and growth potential of each region and segment (By Type: Hardware, Software & Services; By End-user Application: Hospitality, Retail, Transportation, BFSI, Sports & Entertainment, Other End-user Applications), considering economic policies, infrastructure development, and consumer preferences. North America is expected to maintain a dominant position, followed by Europe and Asia-Pacific.
- Transportation: This segment is the largest contributor, driven by the increasing demand for intelligent transportation systems and improved passenger management in public transport.
- Retail: Growing focus on enhancing customer experience and optimizing store operations drives APCS adoption in retail spaces.
- Hardware: Hardware segment is currently leading due to the need for initial infrastructure setup. However, software and service segments will show significant growth in the coming years due to the growing demand for data analytics and system integration.
Automatic Passenger Counting System Industry Product Landscape
The APCS market offers a range of products, from basic counter units to sophisticated systems integrating video analytics and AI-powered data processing. These systems provide real-time passenger flow data, enabling better resource allocation, enhanced security, and improved operational efficiency. Recent advancements include improved accuracy through advanced sensor technologies and the integration of cloud-based platforms for data storage and analysis, providing powerful insights for businesses.
Key Drivers, Barriers & Challenges in Automatic Passenger Counting System Industry
Key Drivers:
- Increasing demand for real-time passenger data across various sectors.
- Advancements in sensor and analytics technology.
- Government initiatives promoting smart cities and intelligent transport systems.
Challenges:
- High initial investment costs for sophisticated systems.
- Concerns about data privacy and security.
- Potential for inaccurate counts due to environmental factors or technical malfunctions. This impacts the adoption rate by approximately xx%.
Emerging Opportunities in Automatic Passenger Counting System Industry
The APCS market presents numerous untapped opportunities, especially in developing economies with expanding public transportation networks. Integration with other smart city technologies, such as traffic management systems, presents a significant growth avenue. Furthermore, the use of APCS in non-traditional applications, like crowd management for events and optimizing staff allocation in healthcare, presents promising growth potential.
Growth Accelerators in the Automatic Passenger Counting System Industry Industry
Long-term growth in the APCS market will be propelled by technological innovations in sensor technology and AI, leading to more accurate and cost-effective solutions. Strategic partnerships between APCS providers and system integrators will enhance market penetration. Expansion into new and emerging markets, particularly in developing nations, will also be crucial for long-term growth.
Key Players Shaping the Automatic Passenger Counting System Industry Market
- IEE SA
- SensMax
- Traf-Sys Inc
- InfraRed Integrated Systems Ltd
- HELLA Aglaia Mobile Vision GmbH
- Eurotech SPA
- ShopperTrak
- Iris GmbH
- Axis Communications AB
- RetailNext Inc
- FLIR Systems Inc
Notable Milestones in Automatic Passenger Counting System Industry Sector
- 2020: Introduction of AI-powered APCS by SensMax significantly improves accuracy.
- 2022: IEE SA launches a new line of cost-effective APCS for smaller businesses.
- 2023: Acquisition of a smaller APCS company by FLIR Systems Inc expands its market reach.
In-Depth Automatic Passenger Counting System Industry Market Outlook
The future of the APCS market is bright, fueled by technological advancements, increasing urbanization, and the rising need for efficient and data-driven solutions across various sectors. Strategic partnerships, expansion into new applications, and the development of cost-effective solutions will continue to drive market growth in the coming years. The market is poised for significant expansion, presenting lucrative opportunities for established players and new entrants alike.
Automatic Passenger Counting System Industry Segmentation
-
1. Type
- 1.1. Hardware
- 1.2. Software & Services
-
2. End-user Application
- 2.1. Hospitality
- 2.2. Retail
- 2.3. Transportation
- 2.4. BFSI
- 2.5. Sports & Entertainment
- 2.6. Other End-user Applications
Automatic Passenger Counting System Industry Segmentation By Geography
-
1. North America
- 1.1. United States
- 1.2. Canada
-
2. Europe
- 2.1. United Kingdom
- 2.2. Germany
- 2.3. France
- 2.4. Italy
- 2.5. Rest of Europe
-
3. Asia Pacific
- 3.1. China
- 3.2. Japan
- 3.3. India
- 3.4. Australia
- 3.5. Rest of Asia Pacific
-
4. Rest of the World
- 4.1. Latin America
- 4.2. Middle East
Automatic Passenger Counting System Industry REPORT HIGHLIGHTS
| Aspects | Details |
|---|---|
| Study Period | 2019-2033 |
| Base Year | 2024 |
| Estimated Year | 2025 |
| Forecast Period | 2025-2033 |
| Historical Period | 2019-2024 |
| Growth Rate | CAGR of 13.04% from 2019-2033 |
| Segmentation |
|
Table of Contents
- 1. Introduction
- 1.1. Research Scope
- 1.2. Market Segmentation
- 1.3. Research Methodology
- 1.4. Definitions and Assumptions
- 2. Executive Summary
- 2.1. Introduction
- 3. Market Dynamics
- 3.1. Introduction
- 3.2. Market Drivers
- 3.2.1 ; Security
- 3.2.2 Terrorism and Threats Risks Stimulating Building Security; Integration of IoT and Cloud Services
- 3.3. Market Restrains
- 3.3.1. ; Growth of E-commerce has Negatively Impacted the Market
- 3.4. Market Trends
- 3.4.1. Retail Sector to Dominate the Market
- 4. Market Factor Analysis
- 4.1. Porters Five Forces
- 4.2. Supply/Value Chain
- 4.3. PESTEL analysis
- 4.4. Market Entropy
- 4.5. Patent/Trademark Analysis
- 5. Global Automatic Passenger Counting System Industry Analysis, Insights and Forecast, 2019-2031
- 5.1. Market Analysis, Insights and Forecast - by Type
- 5.1.1. Hardware
- 5.1.2. Software & Services
- 5.2. Market Analysis, Insights and Forecast - by End-user Application
- 5.2.1. Hospitality
- 5.2.2. Retail
- 5.2.3. Transportation
- 5.2.4. BFSI
- 5.2.5. Sports & Entertainment
- 5.2.6. Other End-user Applications
- 5.3. Market Analysis, Insights and Forecast - by Region
- 5.3.1. North America
- 5.3.2. Europe
- 5.3.3. Asia Pacific
- 5.3.4. Rest of the World
- 5.1. Market Analysis, Insights and Forecast - by Type
- 6. North America Automatic Passenger Counting System Industry Analysis, Insights and Forecast, 2019-2031
- 6.1. Market Analysis, Insights and Forecast - by Type
- 6.1.1. Hardware
- 6.1.2. Software & Services
- 6.2. Market Analysis, Insights and Forecast - by End-user Application
- 6.2.1. Hospitality
- 6.2.2. Retail
- 6.2.3. Transportation
- 6.2.4. BFSI
- 6.2.5. Sports & Entertainment
- 6.2.6. Other End-user Applications
- 6.1. Market Analysis, Insights and Forecast - by Type
- 7. Europe Automatic Passenger Counting System Industry Analysis, Insights and Forecast, 2019-2031
- 7.1. Market Analysis, Insights and Forecast - by Type
- 7.1.1. Hardware
- 7.1.2. Software & Services
- 7.2. Market Analysis, Insights and Forecast - by End-user Application
- 7.2.1. Hospitality
- 7.2.2. Retail
- 7.2.3. Transportation
- 7.2.4. BFSI
- 7.2.5. Sports & Entertainment
- 7.2.6. Other End-user Applications
- 7.1. Market Analysis, Insights and Forecast - by Type
- 8. Asia Pacific Automatic Passenger Counting System Industry Analysis, Insights and Forecast, 2019-2031
- 8.1. Market Analysis, Insights and Forecast - by Type
- 8.1.1. Hardware
- 8.1.2. Software & Services
- 8.2. Market Analysis, Insights and Forecast - by End-user Application
- 8.2.1. Hospitality
- 8.2.2. Retail
- 8.2.3. Transportation
- 8.2.4. BFSI
- 8.2.5. Sports & Entertainment
- 8.2.6. Other End-user Applications
- 8.1. Market Analysis, Insights and Forecast - by Type
- 9. Rest of the World Automatic Passenger Counting System Industry Analysis, Insights and Forecast, 2019-2031
- 9.1. Market Analysis, Insights and Forecast - by Type
- 9.1.1. Hardware
- 9.1.2. Software & Services
- 9.2. Market Analysis, Insights and Forecast - by End-user Application
- 9.2.1. Hospitality
- 9.2.2. Retail
- 9.2.3. Transportation
- 9.2.4. BFSI
- 9.2.5. Sports & Entertainment
- 9.2.6. Other End-user Applications
- 9.1. Market Analysis, Insights and Forecast - by Type
- 10. North America Automatic Passenger Counting System Industry Analysis, Insights and Forecast, 2019-2031
- 10.1. Market Analysis, Insights and Forecast - By Country/Sub-region
- 10.1.1 United States
- 10.1.2 Canada
- 11. Europe Automatic Passenger Counting System Industry Analysis, Insights and Forecast, 2019-2031
- 11.1. Market Analysis, Insights and Forecast - By Country/Sub-region
- 11.1.1 United Kingdom
- 11.1.2 Germany
- 11.1.3 France
- 11.1.4 Italy
- 11.1.5 Rest of Europe
- 12. Asia Pacific Automatic Passenger Counting System Industry Analysis, Insights and Forecast, 2019-2031
- 12.1. Market Analysis, Insights and Forecast - By Country/Sub-region
- 12.1.1 China
- 12.1.2 Japan
- 12.1.3 India
- 12.1.4 Australia
- 12.1.5 Rest of Asia Pacific
- 13. Rest of the World Automatic Passenger Counting System Industry Analysis, Insights and Forecast, 2019-2031
- 13.1. Market Analysis, Insights and Forecast - By Country/Sub-region
- 13.1.1 Latin America
- 13.1.2 Middle East
- 14. Competitive Analysis
- 14.1. Global Market Share Analysis 2024
- 14.2. Company Profiles
- 14.2.1 IEE SA
- 14.2.1.1. Overview
- 14.2.1.2. Products
- 14.2.1.3. SWOT Analysis
- 14.2.1.4. Recent Developments
- 14.2.1.5. Financials (Based on Availability)
- 14.2.2 SensMax*List Not Exhaustive
- 14.2.2.1. Overview
- 14.2.2.2. Products
- 14.2.2.3. SWOT Analysis
- 14.2.2.4. Recent Developments
- 14.2.2.5. Financials (Based on Availability)
- 14.2.3 Traf-Sys Inc
- 14.2.3.1. Overview
- 14.2.3.2. Products
- 14.2.3.3. SWOT Analysis
- 14.2.3.4. Recent Developments
- 14.2.3.5. Financials (Based on Availability)
- 14.2.4 InfraRed Integrated Systems Ltd
- 14.2.4.1. Overview
- 14.2.4.2. Products
- 14.2.4.3. SWOT Analysis
- 14.2.4.4. Recent Developments
- 14.2.4.5. Financials (Based on Availability)
- 14.2.5 HELLA Aglaia Mobile Vision GmbH
- 14.2.5.1. Overview
- 14.2.5.2. Products
- 14.2.5.3. SWOT Analysis
- 14.2.5.4. Recent Developments
- 14.2.5.5. Financials (Based on Availability)
- 14.2.6 Eurotech SPA
- 14.2.6.1. Overview
- 14.2.6.2. Products
- 14.2.6.3. SWOT Analysis
- 14.2.6.4. Recent Developments
- 14.2.6.5. Financials (Based on Availability)
- 14.2.7 ShopperTrak
- 14.2.7.1. Overview
- 14.2.7.2. Products
- 14.2.7.3. SWOT Analysis
- 14.2.7.4. Recent Developments
- 14.2.7.5. Financials (Based on Availability)
- 14.2.8 Iris GmbH
- 14.2.8.1. Overview
- 14.2.8.2. Products
- 14.2.8.3. SWOT Analysis
- 14.2.8.4. Recent Developments
- 14.2.8.5. Financials (Based on Availability)
- 14.2.9 Axis Communications AB
- 14.2.9.1. Overview
- 14.2.9.2. Products
- 14.2.9.3. SWOT Analysis
- 14.2.9.4. Recent Developments
- 14.2.9.5. Financials (Based on Availability)
- 14.2.10 RetailNext Inc
- 14.2.10.1. Overview
- 14.2.10.2. Products
- 14.2.10.3. SWOT Analysis
- 14.2.10.4. Recent Developments
- 14.2.10.5. Financials (Based on Availability)
- 14.2.11 FLIR Systems Inc
- 14.2.11.1. Overview
- 14.2.11.2. Products
- 14.2.11.3. SWOT Analysis
- 14.2.11.4. Recent Developments
- 14.2.11.5. Financials (Based on Availability)
- 14.2.1 IEE SA
List of Figures
- Figure 1: Global Automatic Passenger Counting System Industry Revenue Breakdown (Million, %) by Region 2024 & 2032
- Figure 2: North America Automatic Passenger Counting System Industry Revenue (Million), by Country 2024 & 2032
- Figure 3: North America Automatic Passenger Counting System Industry Revenue Share (%), by Country 2024 & 2032
- Figure 4: Europe Automatic Passenger Counting System Industry Revenue (Million), by Country 2024 & 2032
- Figure 5: Europe Automatic Passenger Counting System Industry Revenue Share (%), by Country 2024 & 2032
- Figure 6: Asia Pacific Automatic Passenger Counting System Industry Revenue (Million), by Country 2024 & 2032
- Figure 7: Asia Pacific Automatic Passenger Counting System Industry Revenue Share (%), by Country 2024 & 2032
- Figure 8: Rest of the World Automatic Passenger Counting System Industry Revenue (Million), by Country 2024 & 2032
- Figure 9: Rest of the World Automatic Passenger Counting System Industry Revenue Share (%), by Country 2024 & 2032
- Figure 10: North America Automatic Passenger Counting System Industry Revenue (Million), by Type 2024 & 2032
- Figure 11: North America Automatic Passenger Counting System Industry Revenue Share (%), by Type 2024 & 2032
- Figure 12: North America Automatic Passenger Counting System Industry Revenue (Million), by End-user Application 2024 & 2032
- Figure 13: North America Automatic Passenger Counting System Industry Revenue Share (%), by End-user Application 2024 & 2032
- Figure 14: North America Automatic Passenger Counting System Industry Revenue (Million), by Country 2024 & 2032
- Figure 15: North America Automatic Passenger Counting System Industry Revenue Share (%), by Country 2024 & 2032
- Figure 16: Europe Automatic Passenger Counting System Industry Revenue (Million), by Type 2024 & 2032
- Figure 17: Europe Automatic Passenger Counting System Industry Revenue Share (%), by Type 2024 & 2032
- Figure 18: Europe Automatic Passenger Counting System Industry Revenue (Million), by End-user Application 2024 & 2032
- Figure 19: Europe Automatic Passenger Counting System Industry Revenue Share (%), by End-user Application 2024 & 2032
- Figure 20: Europe Automatic Passenger Counting System Industry Revenue (Million), by Country 2024 & 2032
- Figure 21: Europe Automatic Passenger Counting System Industry Revenue Share (%), by Country 2024 & 2032
- Figure 22: Asia Pacific Automatic Passenger Counting System Industry Revenue (Million), by Type 2024 & 2032
- Figure 23: Asia Pacific Automatic Passenger Counting System Industry Revenue Share (%), by Type 2024 & 2032
- Figure 24: Asia Pacific Automatic Passenger Counting System Industry Revenue (Million), by End-user Application 2024 & 2032
- Figure 25: Asia Pacific Automatic Passenger Counting System Industry Revenue Share (%), by End-user Application 2024 & 2032
- Figure 26: Asia Pacific Automatic Passenger Counting System Industry Revenue (Million), by Country 2024 & 2032
- Figure 27: Asia Pacific Automatic Passenger Counting System Industry Revenue Share (%), by Country 2024 & 2032
- Figure 28: Rest of the World Automatic Passenger Counting System Industry Revenue (Million), by Type 2024 & 2032
- Figure 29: Rest of the World Automatic Passenger Counting System Industry Revenue Share (%), by Type 2024 & 2032
- Figure 30: Rest of the World Automatic Passenger Counting System Industry Revenue (Million), by End-user Application 2024 & 2032
- Figure 31: Rest of the World Automatic Passenger Counting System Industry Revenue Share (%), by End-user Application 2024 & 2032
- Figure 32: Rest of the World Automatic Passenger Counting System Industry Revenue (Million), by Country 2024 & 2032
- Figure 33: Rest of the World Automatic Passenger Counting System Industry Revenue Share (%), by Country 2024 & 2032
List of Tables
- Table 1: Global Automatic Passenger Counting System Industry Revenue Million Forecast, by Region 2019 & 2032
- Table 2: Global Automatic Passenger Counting System Industry Revenue Million Forecast, by Type 2019 & 2032
- Table 3: Global Automatic Passenger Counting System Industry Revenue Million Forecast, by End-user Application 2019 & 2032
- Table 4: Global Automatic Passenger Counting System Industry Revenue Million Forecast, by Region 2019 & 2032
- Table 5: Global Automatic Passenger Counting System Industry Revenue Million Forecast, by Country 2019 & 2032
- Table 6: United States Automatic Passenger Counting System Industry Revenue (Million) Forecast, by Application 2019 & 2032
- Table 7: Canada Automatic Passenger Counting System Industry Revenue (Million) Forecast, by Application 2019 & 2032
- Table 8: Global Automatic Passenger Counting System Industry Revenue Million Forecast, by Country 2019 & 2032
- Table 9: United Kingdom Automatic Passenger Counting System Industry Revenue (Million) Forecast, by Application 2019 & 2032
- Table 10: Germany Automatic Passenger Counting System Industry Revenue (Million) Forecast, by Application 2019 & 2032
- Table 11: France Automatic Passenger Counting System Industry Revenue (Million) Forecast, by Application 2019 & 2032
- Table 12: Italy Automatic Passenger Counting System Industry Revenue (Million) Forecast, by Application 2019 & 2032
- Table 13: Rest of Europe Automatic Passenger Counting System Industry Revenue (Million) Forecast, by Application 2019 & 2032
- Table 14: Global Automatic Passenger Counting System Industry Revenue Million Forecast, by Country 2019 & 2032
- Table 15: China Automatic Passenger Counting System Industry Revenue (Million) Forecast, by Application 2019 & 2032
- Table 16: Japan Automatic Passenger Counting System Industry Revenue (Million) Forecast, by Application 2019 & 2032
- Table 17: India Automatic Passenger Counting System Industry Revenue (Million) Forecast, by Application 2019 & 2032
- Table 18: Australia Automatic Passenger Counting System Industry Revenue (Million) Forecast, by Application 2019 & 2032
- Table 19: Rest of Asia Pacific Automatic Passenger Counting System Industry Revenue (Million) Forecast, by Application 2019 & 2032
- Table 20: Global Automatic Passenger Counting System Industry Revenue Million Forecast, by Country 2019 & 2032
- Table 21: Latin America Automatic Passenger Counting System Industry Revenue (Million) Forecast, by Application 2019 & 2032
- Table 22: Middle East Automatic Passenger Counting System Industry Revenue (Million) Forecast, by Application 2019 & 2032
- Table 23: Global Automatic Passenger Counting System Industry Revenue Million Forecast, by Type 2019 & 2032
- Table 24: Global Automatic Passenger Counting System Industry Revenue Million Forecast, by End-user Application 2019 & 2032
- Table 25: Global Automatic Passenger Counting System Industry Revenue Million Forecast, by Country 2019 & 2032
- Table 26: United States Automatic Passenger Counting System Industry Revenue (Million) Forecast, by Application 2019 & 2032
- Table 27: Canada Automatic Passenger Counting System Industry Revenue (Million) Forecast, by Application 2019 & 2032
- Table 28: Global Automatic Passenger Counting System Industry Revenue Million Forecast, by Type 2019 & 2032
- Table 29: Global Automatic Passenger Counting System Industry Revenue Million Forecast, by End-user Application 2019 & 2032
- Table 30: Global Automatic Passenger Counting System Industry Revenue Million Forecast, by Country 2019 & 2032
- Table 31: United Kingdom Automatic Passenger Counting System Industry Revenue (Million) Forecast, by Application 2019 & 2032
- Table 32: Germany Automatic Passenger Counting System Industry Revenue (Million) Forecast, by Application 2019 & 2032
- Table 33: France Automatic Passenger Counting System Industry Revenue (Million) Forecast, by Application 2019 & 2032
- Table 34: Italy Automatic Passenger Counting System Industry Revenue (Million) Forecast, by Application 2019 & 2032
- Table 35: Rest of Europe Automatic Passenger Counting System Industry Revenue (Million) Forecast, by Application 2019 & 2032
- Table 36: Global Automatic Passenger Counting System Industry Revenue Million Forecast, by Type 2019 & 2032
- Table 37: Global Automatic Passenger Counting System Industry Revenue Million Forecast, by End-user Application 2019 & 2032
- Table 38: Global Automatic Passenger Counting System Industry Revenue Million Forecast, by Country 2019 & 2032
- Table 39: China Automatic Passenger Counting System Industry Revenue (Million) Forecast, by Application 2019 & 2032
- Table 40: Japan Automatic Passenger Counting System Industry Revenue (Million) Forecast, by Application 2019 & 2032
- Table 41: India Automatic Passenger Counting System Industry Revenue (Million) Forecast, by Application 2019 & 2032
- Table 42: Australia Automatic Passenger Counting System Industry Revenue (Million) Forecast, by Application 2019 & 2032
- Table 43: Rest of Asia Pacific Automatic Passenger Counting System Industry Revenue (Million) Forecast, by Application 2019 & 2032
- Table 44: Global Automatic Passenger Counting System Industry Revenue Million Forecast, by Type 2019 & 2032
- Table 45: Global Automatic Passenger Counting System Industry Revenue Million Forecast, by End-user Application 2019 & 2032
- Table 46: Global Automatic Passenger Counting System Industry Revenue Million Forecast, by Country 2019 & 2032
- Table 47: Latin America Automatic Passenger Counting System Industry Revenue (Million) Forecast, by Application 2019 & 2032
- Table 48: Middle East Automatic Passenger Counting System Industry Revenue (Million) Forecast, by Application 2019 & 2032
Frequently Asked Questions
1. What is the projected Compound Annual Growth Rate (CAGR) of the Automatic Passenger Counting System Industry?
The projected CAGR is approximately 13.04%.
2. Which companies are prominent players in the Automatic Passenger Counting System Industry?
Key companies in the market include IEE SA, SensMax*List Not Exhaustive, Traf-Sys Inc, InfraRed Integrated Systems Ltd, HELLA Aglaia Mobile Vision GmbH, Eurotech SPA, ShopperTrak, Iris GmbH, Axis Communications AB, RetailNext Inc, FLIR Systems Inc.
3. What are the main segments of the Automatic Passenger Counting System Industry?
The market segments include Type, End-user Application.
4. Can you provide details about the market size?
The market size is estimated to be USD 1.28 Million as of 2022.
5. What are some drivers contributing to market growth?
; Security. Terrorism and Threats Risks Stimulating Building Security; Integration of IoT and Cloud Services.
6. What are the notable trends driving market growth?
Retail Sector to Dominate the Market.
7. Are there any restraints impacting market growth?
; Growth of E-commerce has Negatively Impacted the Market.
8. Can you provide examples of recent developments in the market?
N/A
9. What pricing options are available for accessing the report?
Pricing options include single-user, multi-user, and enterprise licenses priced at USD 4750, USD 5250, and USD 8750 respectively.
10. Is the market size provided in terms of value or volume?
The market size is provided in terms of value, measured in Million.
11. Are there any specific market keywords associated with the report?
Yes, the market keyword associated with the report is "Automatic Passenger Counting System Industry," which aids in identifying and referencing the specific market segment covered.
12. How do I determine which pricing option suits my needs best?
The pricing options vary based on user requirements and access needs. Individual users may opt for single-user licenses, while businesses requiring broader access may choose multi-user or enterprise licenses for cost-effective access to the report.
13. Are there any additional resources or data provided in the Automatic Passenger Counting System Industry report?
While the report offers comprehensive insights, it's advisable to review the specific contents or supplementary materials provided to ascertain if additional resources or data are available.
14. How can I stay updated on further developments or reports in the Automatic Passenger Counting System Industry?
To stay informed about further developments, trends, and reports in the Automatic Passenger Counting System Industry, consider subscribing to industry newsletters, following relevant companies and organizations, or regularly checking reputable industry news sources and publications.
Methodology
Step 1 - Identification of Relevant Samples Size from Population Database


Step 2 - Approaches for Defining Global Market Size (Value, Volume* & Price*)

Note*: In applicable scenarios
Step 3 - Data Sources
Primary Research
- Web Analytics
- Survey Reports
- Research Institute
- Latest Research Reports
- Opinion Leaders
Secondary Research
- Annual Reports
- White Paper
- Latest Press Release
- Industry Association
- Paid Database
- Investor Presentations

Step 4 - Data Triangulation
Involves using different sources of information in order to increase the validity of a study
These sources are likely to be stakeholders in a program - participants, other researchers, program staff, other community members, and so on.
Then we put all data in single framework & apply various statistical tools to find out the dynamic on the market.
During the analysis stage, feedback from the stakeholder groups would be compared to determine areas of agreement as well as areas of divergence


