
Key Insights
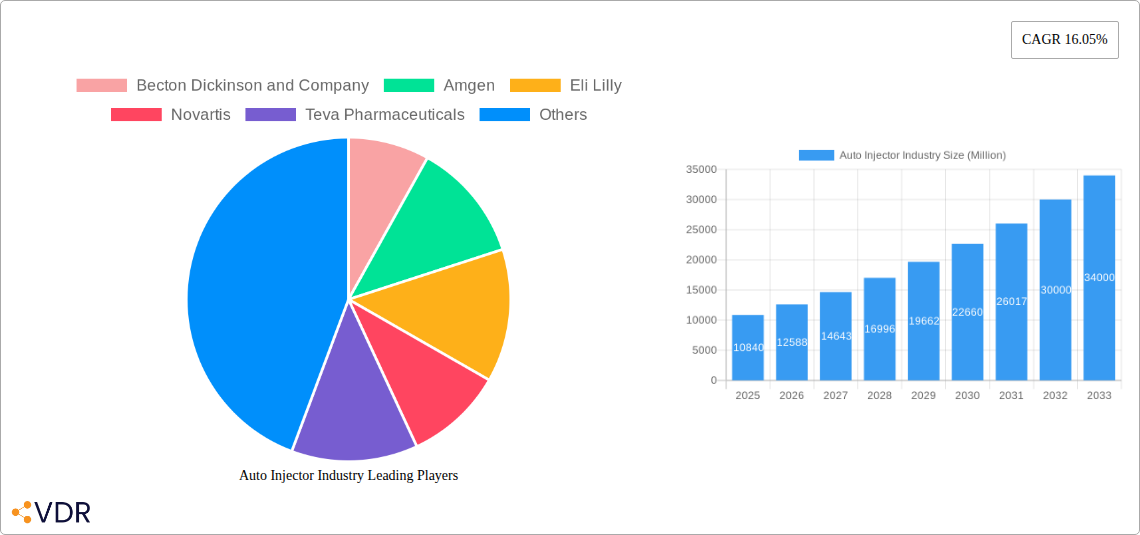
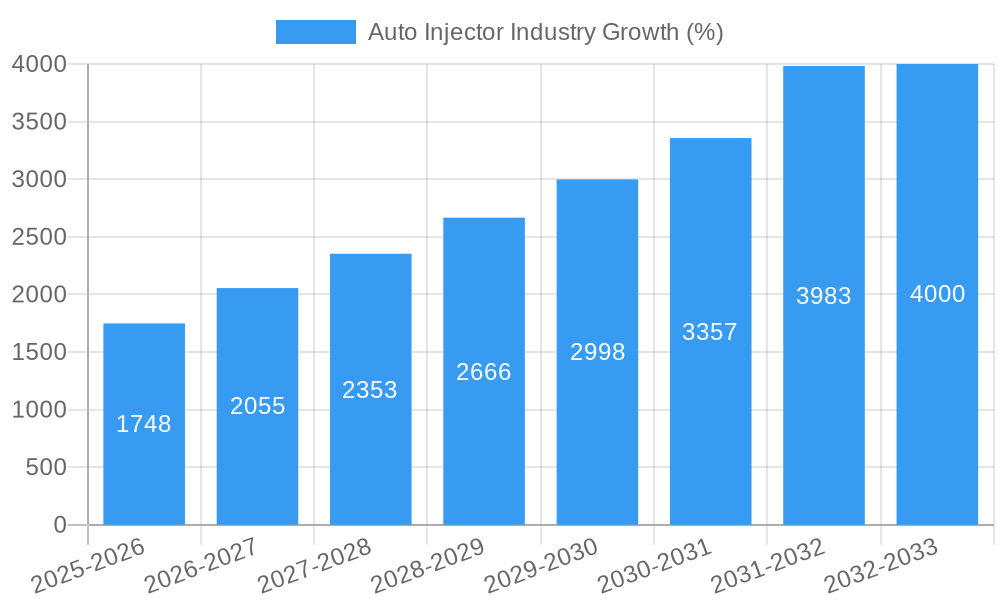
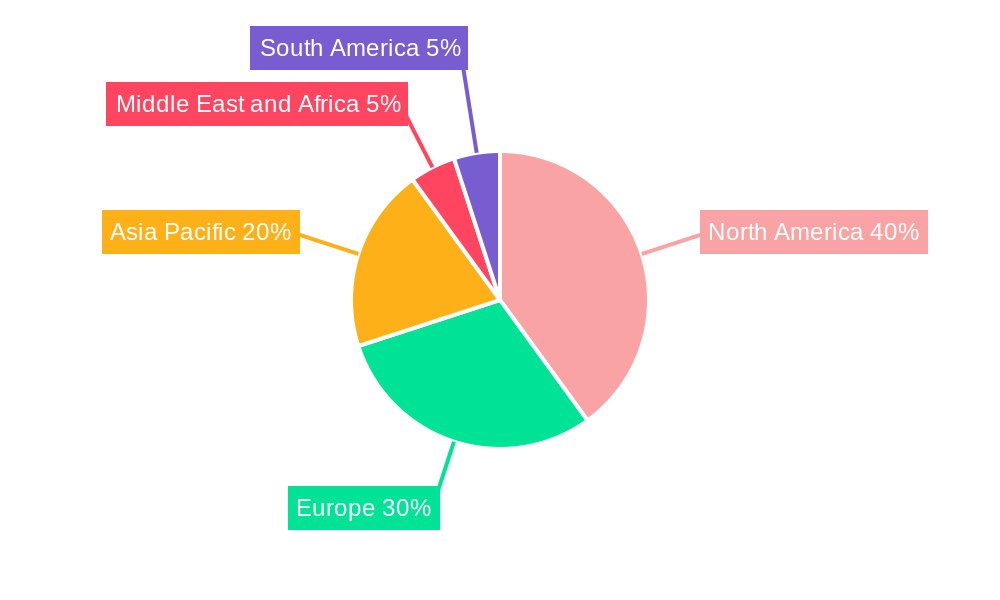
The global auto injector market is experiencing robust growth, projected to reach \$10.84 billion in 2025 and maintain a Compound Annual Growth Rate (CAGR) of 16.05% from 2025 to 2033. This expansion is driven by several key factors. The increasing prevalence of chronic diseases requiring injectable therapies, such as rheumatoid arthritis, multiple sclerosis, and various cardiovascular conditions, fuels demand for convenient and safe self-injection devices. Furthermore, technological advancements leading to the development of more user-friendly and disposable autoinjectors are contributing to market growth. The preference for home-based healthcare settings also positively impacts the market, as patients increasingly opt for self-administration of medication under the guidance of healthcare professionals. The market is segmented by end-user (home care, hospitals & clinics, others), application (various diseases), and type (disposable and reusable autoinjectors). North America currently holds a significant market share due to high healthcare expenditure and technological advancements, but the Asia-Pacific region is expected to witness substantial growth driven by rising disposable incomes and increasing awareness of chronic diseases. Competitive landscape is marked by major pharmaceutical and medical device companies actively engaged in research, development, and marketing of advanced autoinjector technologies.
The market's future trajectory is influenced by several factors. Stringent regulatory approvals and increasing costs associated with research and development might pose challenges. However, ongoing innovation focused on improving device safety, reducing injection pain, and enhancing ease of use will continue to drive adoption. Furthermore, growing partnerships and collaborations between pharmaceutical companies and auto injector manufacturers will facilitate the development and distribution of innovative products catering to a diverse range of therapeutic areas. The expansion into emerging markets with growing healthcare infrastructure and increasing patient awareness will further contribute to the market's sustained growth. The increasing focus on personalized medicine and the development of targeted therapies may also create new opportunities for specialized autoinjectors in the coming years.
Auto Injector Industry Market Report: 2019-2033
This comprehensive report provides an in-depth analysis of the global auto injector market, encompassing historical data (2019-2024), current estimations (2025), and future projections (2025-2033). We examine market dynamics, growth trends, regional performance, product landscapes, key players, and emerging opportunities across various segments including home care, hospitals, and specific applications like rheumatoid arthritis and multiple sclerosis. The report is invaluable for industry professionals, investors, and strategic decision-makers seeking a complete understanding of this dynamic market. The global auto-injector market is projected to reach xx million units by 2033.
Auto Injector Industry Market Dynamics & Structure
The auto injector market exhibits a moderately consolidated structure, with key players holding significant market share. Market concentration is influenced by factors such as technological innovation, stringent regulatory frameworks, and the availability of competitive substitutes. The industry is characterized by continuous technological advancements aimed at improving device usability, safety, and efficacy. Mergers and acquisitions (M&A) play a significant role in shaping the competitive landscape, with larger companies acquiring smaller innovative firms to expand their product portfolios and market reach.
- Market Concentration: Top 5 players hold approximately xx% of the market share in 2025.
- Technological Innovation: Focus on miniaturization, smart features, and improved drug delivery mechanisms.
- Regulatory Landscape: Stringent regulatory approvals and compliance requirements influence market entry and product development.
- Competitive Substitutes: Oral medications and other drug delivery systems pose competitive threats.
- End-User Demographics: Aging populations and increasing prevalence of chronic diseases drive market growth.
- M&A Activity: Annual M&A deal volume in the auto injector sector averaged xx deals between 2019-2024.
Auto Injector Industry Growth Trends & Insights
The global auto injector market experienced significant growth between 2019 and 2024, driven by factors such as the rising prevalence of chronic diseases, technological advancements, and increasing patient preference for self-administered therapies. The market is projected to continue its upward trajectory, exhibiting a Compound Annual Growth Rate (CAGR) of xx% during the forecast period (2025-2033). This growth is fueled by the expanding adoption of auto injectors across various therapeutic areas, including rheumatoid arthritis, multiple sclerosis, and anaphylaxis. Technological advancements such as smart auto injectors with enhanced features are driving market penetration and improving patient compliance. Consumer preference for convenient and user-friendly drug delivery systems is further contributing to market expansion. Market penetration in key regions is expected to increase significantly by 2033, particularly in developed nations.
Dominant Regions, Countries, or Segments in Auto Injector Industry
North America currently holds the largest market share in the auto injector industry, driven by high healthcare expenditure, advanced medical infrastructure, and a significant number of patients suffering from chronic diseases requiring injectable therapies. Within North America, the United States dominates due to high adoption rates and well-established healthcare systems. Europe follows as a significant market, while the Asia-Pacific region is experiencing rapid growth fueled by increasing healthcare awareness and expanding healthcare infrastructure.
- By End User: Hospital & Clinics segment dominates due to high volume of injections administered.
- By Application: Rheumatoid Arthritis and Multiple Sclerosis represent the largest application segments.
- By Type: Disposable auto injectors hold a larger market share due to ease of use and reduced risk of contamination.
- Key Drivers: Increasing prevalence of chronic diseases, rising healthcare expenditure, technological advancements, and favorable regulatory policies.
Auto Injector Industry Product Landscape
The auto injector market offers a diverse range of products, including disposable and reusable devices, each catering to specific needs and preferences. Recent innovations focus on enhancing usability, safety, and patient compliance. Features such as needle-free injection technology, pre-filled cartridges, and integrated safety mechanisms are becoming increasingly prevalent. The industry is witnessing a shift towards smart auto injectors, which incorporate technology to monitor and track drug administration. This improves patient adherence and allows healthcare professionals to closely monitor treatment progress.
Key Drivers, Barriers & Challenges in Auto Injector Industry
Key Drivers: Rising prevalence of chronic diseases requiring injectable medications is the primary driver. Technological innovations, increasing demand for convenient self-administration solutions, and supportive regulatory policies are also significant drivers.
Challenges & Restraints: High manufacturing costs and stringent regulatory approvals can hinder market expansion. Competition from alternative drug delivery systems and supply chain disruptions pose challenges to market growth.
Emerging Opportunities in Auto Injector Industry
Emerging opportunities lie in the development of innovative auto injector designs, expansion into untapped markets, and development of specialized auto injectors for niche therapeutic areas. The integration of smart technology and digital health solutions presents significant opportunities for enhancing patient engagement and improving treatment outcomes. Furthermore, the rising demand for personalized medicine is creating opportunities for customized auto injector solutions tailored to individual patient needs.
Growth Accelerators in the Auto Injector Industry
Technological advancements like the development of needle-free injection systems and smart auto injectors are key growth accelerators. Strategic collaborations and partnerships between pharmaceutical companies and device manufacturers further accelerate market growth. Expansion into emerging economies and the increasing focus on improving patient outcomes are also significant drivers of future market growth.
Key Players Shaping the Auto Injector Industry Market
- Becton Dickinson and Company
- Amgen
- Eli Lilly
- Novartis
- Teva Pharmaceuticals
- Biogen
- AstraZeneca
- Abbvie
- Ypsomed
- Bayer
Notable Milestones in Auto Injector Industry Sector
- May 2022: Jabil Healthcare launched the Qfinity autoinjector platform, a cost-effective, reusable solution.
- May 2022: Stevanato Group signed an exclusive agreement with Owen Mumford for its Aidaptus auto-injector.
In-Depth Auto Injector Industry Market Outlook
The auto injector market is poised for continued growth, driven by technological advancements, increasing prevalence of chronic diseases, and the rising demand for convenient and effective drug delivery systems. Strategic partnerships, expansion into emerging markets, and the development of next-generation auto injectors with enhanced features will shape the future of the market. The focus on improving patient outcomes and simplifying drug administration will be key drivers of long-term growth.
Auto Injector Industry Segmentation
-
1. Application
- 1.1. Rheumatoid Arthritis
- 1.2. Multiple Sclerosis
- 1.3. Anaphylaxis
- 1.4. Other Ap
-
2. Type
- 2.1. Disposable Autoinjectors
- 2.2. Reusable Autoinjectors
-
3. End User
- 3.1. Home Care Settings
- 3.2. Hospital & Clinics
- 3.3. Other End Users
Auto Injector Industry Segmentation By Geography
-
1. North America
- 1.1. United States
- 1.2. Canada
- 1.3. Mexico
-
2. Europe
- 2.1. Germany
- 2.2. United Kingdom
- 2.3. France
- 2.4. Italy
- 2.5. Spain
- 2.6. Rest of Europe
-
3. Asia Pacific
- 3.1. China
- 3.2. Japan
- 3.3. India
- 3.4. Australia
- 3.5. South Korea
- 3.6. Rest of Asia Pacific
-
4. Middle East and Africa
- 4.1. GCC
- 4.2. South Africa
- 4.3. Rest of Middle East and Africa
-
5. South America
- 5.1. Brazil
- 5.2. Argentina
- 5.3. Rest of South America
Auto Injector Industry REPORT HIGHLIGHTS
| Aspects | Details |
|---|---|
| Study Period | 2019-2033 |
| Base Year | 2024 |
| Estimated Year | 2025 |
| Forecast Period | 2025-2033 |
| Historical Period | 2019-2024 |
| Growth Rate | CAGR of 16.05% from 2019-2033 |
| Segmentation |
|
Table of Contents
- 1. Introduction
- 1.1. Research Scope
- 1.2. Market Segmentation
- 1.3. Research Methodology
- 1.4. Definitions and Assumptions
- 2. Executive Summary
- 2.1. Introduction
- 3. Market Dynamics
- 3.1. Introduction
- 3.2. Market Drivers
- 3.2.1. Increasing Demand for Convenience of Patients; Rising Incidence of Chronic and Lifestyle Diseases; Technological Advancements
- 3.3. Market Restrains
- 3.3.1. Preference for Alternative Drug Delivery Modes; Regulatory Hurdles
- 3.4. Market Trends
- 3.4.1. Rheumatoid Arthritis Expected to Hold Significant Market Share Over the Forecast Period
- 4. Market Factor Analysis
- 4.1. Porters Five Forces
- 4.2. Supply/Value Chain
- 4.3. PESTEL analysis
- 4.4. Market Entropy
- 4.5. Patent/Trademark Analysis
- 5. Global Auto Injector Industry Analysis, Insights and Forecast, 2019-2031
- 5.1. Market Analysis, Insights and Forecast - by Application
- 5.1.1. Rheumatoid Arthritis
- 5.1.2. Multiple Sclerosis
- 5.1.3. Anaphylaxis
- 5.1.4. Other Ap
- 5.2. Market Analysis, Insights and Forecast - by Type
- 5.2.1. Disposable Autoinjectors
- 5.2.2. Reusable Autoinjectors
- 5.3. Market Analysis, Insights and Forecast - by End User
- 5.3.1. Home Care Settings
- 5.3.2. Hospital & Clinics
- 5.3.3. Other End Users
- 5.4. Market Analysis, Insights and Forecast - by Region
- 5.4.1. North America
- 5.4.2. Europe
- 5.4.3. Asia Pacific
- 5.4.4. Middle East and Africa
- 5.4.5. South America
- 5.1. Market Analysis, Insights and Forecast - by Application
- 6. North America Auto Injector Industry Analysis, Insights and Forecast, 2019-2031
- 6.1. Market Analysis, Insights and Forecast - by Application
- 6.1.1. Rheumatoid Arthritis
- 6.1.2. Multiple Sclerosis
- 6.1.3. Anaphylaxis
- 6.1.4. Other Ap
- 6.2. Market Analysis, Insights and Forecast - by Type
- 6.2.1. Disposable Autoinjectors
- 6.2.2. Reusable Autoinjectors
- 6.3. Market Analysis, Insights and Forecast - by End User
- 6.3.1. Home Care Settings
- 6.3.2. Hospital & Clinics
- 6.3.3. Other End Users
- 6.1. Market Analysis, Insights and Forecast - by Application
- 7. Europe Auto Injector Industry Analysis, Insights and Forecast, 2019-2031
- 7.1. Market Analysis, Insights and Forecast - by Application
- 7.1.1. Rheumatoid Arthritis
- 7.1.2. Multiple Sclerosis
- 7.1.3. Anaphylaxis
- 7.1.4. Other Ap
- 7.2. Market Analysis, Insights and Forecast - by Type
- 7.2.1. Disposable Autoinjectors
- 7.2.2. Reusable Autoinjectors
- 7.3. Market Analysis, Insights and Forecast - by End User
- 7.3.1. Home Care Settings
- 7.3.2. Hospital & Clinics
- 7.3.3. Other End Users
- 7.1. Market Analysis, Insights and Forecast - by Application
- 8. Asia Pacific Auto Injector Industry Analysis, Insights and Forecast, 2019-2031
- 8.1. Market Analysis, Insights and Forecast - by Application
- 8.1.1. Rheumatoid Arthritis
- 8.1.2. Multiple Sclerosis
- 8.1.3. Anaphylaxis
- 8.1.4. Other Ap
- 8.2. Market Analysis, Insights and Forecast - by Type
- 8.2.1. Disposable Autoinjectors
- 8.2.2. Reusable Autoinjectors
- 8.3. Market Analysis, Insights and Forecast - by End User
- 8.3.1. Home Care Settings
- 8.3.2. Hospital & Clinics
- 8.3.3. Other End Users
- 8.1. Market Analysis, Insights and Forecast - by Application
- 9. Middle East and Africa Auto Injector Industry Analysis, Insights and Forecast, 2019-2031
- 9.1. Market Analysis, Insights and Forecast - by Application
- 9.1.1. Rheumatoid Arthritis
- 9.1.2. Multiple Sclerosis
- 9.1.3. Anaphylaxis
- 9.1.4. Other Ap
- 9.2. Market Analysis, Insights and Forecast - by Type
- 9.2.1. Disposable Autoinjectors
- 9.2.2. Reusable Autoinjectors
- 9.3. Market Analysis, Insights and Forecast - by End User
- 9.3.1. Home Care Settings
- 9.3.2. Hospital & Clinics
- 9.3.3. Other End Users
- 9.1. Market Analysis, Insights and Forecast - by Application
- 10. South America Auto Injector Industry Analysis, Insights and Forecast, 2019-2031
- 10.1. Market Analysis, Insights and Forecast - by Application
- 10.1.1. Rheumatoid Arthritis
- 10.1.2. Multiple Sclerosis
- 10.1.3. Anaphylaxis
- 10.1.4. Other Ap
- 10.2. Market Analysis, Insights and Forecast - by Type
- 10.2.1. Disposable Autoinjectors
- 10.2.2. Reusable Autoinjectors
- 10.3. Market Analysis, Insights and Forecast - by End User
- 10.3.1. Home Care Settings
- 10.3.2. Hospital & Clinics
- 10.3.3. Other End Users
- 10.1. Market Analysis, Insights and Forecast - by Application
- 11. North America Auto Injector Industry Analysis, Insights and Forecast, 2019-2031
- 11.1. Market Analysis, Insights and Forecast - By Country/Sub-region
- 11.1.1 United States
- 11.1.2 Canada
- 11.1.3 Mexico
- 12. Europe Auto Injector Industry Analysis, Insights and Forecast, 2019-2031
- 12.1. Market Analysis, Insights and Forecast - By Country/Sub-region
- 12.1.1 Germany
- 12.1.2 United Kingdom
- 12.1.3 France
- 12.1.4 Italy
- 12.1.5 Spain
- 12.1.6 Rest of Europe
- 13. Asia Pacific Auto Injector Industry Analysis, Insights and Forecast, 2019-2031
- 13.1. Market Analysis, Insights and Forecast - By Country/Sub-region
- 13.1.1 China
- 13.1.2 Japan
- 13.1.3 India
- 13.1.4 Australia
- 13.1.5 South Korea
- 13.1.6 Rest of Asia Pacific
- 14. Middle East and Africa Auto Injector Industry Analysis, Insights and Forecast, 2019-2031
- 14.1. Market Analysis, Insights and Forecast - By Country/Sub-region
- 14.1.1 GCC
- 14.1.2 South Africa
- 14.1.3 Rest of Middle East and Africa
- 15. South America Auto Injector Industry Analysis, Insights and Forecast, 2019-2031
- 15.1. Market Analysis, Insights and Forecast - By Country/Sub-region
- 15.1.1 Brazil
- 15.1.2 Argentina
- 15.1.3 Rest of South America
- 16. Competitive Analysis
- 16.1. Global Market Share Analysis 2024
- 16.2. Company Profiles
- 16.2.1 Becton Dickinson and Company
- 16.2.1.1. Overview
- 16.2.1.2. Products
- 16.2.1.3. SWOT Analysis
- 16.2.1.4. Recent Developments
- 16.2.1.5. Financials (Based on Availability)
- 16.2.2 Amgen
- 16.2.2.1. Overview
- 16.2.2.2. Products
- 16.2.2.3. SWOT Analysis
- 16.2.2.4. Recent Developments
- 16.2.2.5. Financials (Based on Availability)
- 16.2.3 Eli Lilly
- 16.2.3.1. Overview
- 16.2.3.2. Products
- 16.2.3.3. SWOT Analysis
- 16.2.3.4. Recent Developments
- 16.2.3.5. Financials (Based on Availability)
- 16.2.4 Novartis
- 16.2.4.1. Overview
- 16.2.4.2. Products
- 16.2.4.3. SWOT Analysis
- 16.2.4.4. Recent Developments
- 16.2.4.5. Financials (Based on Availability)
- 16.2.5 Teva Pharmaceuticals
- 16.2.5.1. Overview
- 16.2.5.2. Products
- 16.2.5.3. SWOT Analysis
- 16.2.5.4. Recent Developments
- 16.2.5.5. Financials (Based on Availability)
- 16.2.6 Biogen
- 16.2.6.1. Overview
- 16.2.6.2. Products
- 16.2.6.3. SWOT Analysis
- 16.2.6.4. Recent Developments
- 16.2.6.5. Financials (Based on Availability)
- 16.2.7 AstraZeneca
- 16.2.7.1. Overview
- 16.2.7.2. Products
- 16.2.7.3. SWOT Analysis
- 16.2.7.4. Recent Developments
- 16.2.7.5. Financials (Based on Availability)
- 16.2.8 Abbvie
- 16.2.8.1. Overview
- 16.2.8.2. Products
- 16.2.8.3. SWOT Analysis
- 16.2.8.4. Recent Developments
- 16.2.8.5. Financials (Based on Availability)
- 16.2.9 Ypsomed*List Not Exhaustive
- 16.2.9.1. Overview
- 16.2.9.2. Products
- 16.2.9.3. SWOT Analysis
- 16.2.9.4. Recent Developments
- 16.2.9.5. Financials (Based on Availability)
- 16.2.10 Bayer
- 16.2.10.1. Overview
- 16.2.10.2. Products
- 16.2.10.3. SWOT Analysis
- 16.2.10.4. Recent Developments
- 16.2.10.5. Financials (Based on Availability)
- 16.2.1 Becton Dickinson and Company
List of Figures
- Figure 1: Global Auto Injector Industry Revenue Breakdown (Million, %) by Region 2024 & 2032
- Figure 2: North America Auto Injector Industry Revenue (Million), by Country 2024 & 2032
- Figure 3: North America Auto Injector Industry Revenue Share (%), by Country 2024 & 2032
- Figure 4: Europe Auto Injector Industry Revenue (Million), by Country 2024 & 2032
- Figure 5: Europe Auto Injector Industry Revenue Share (%), by Country 2024 & 2032
- Figure 6: Asia Pacific Auto Injector Industry Revenue (Million), by Country 2024 & 2032
- Figure 7: Asia Pacific Auto Injector Industry Revenue Share (%), by Country 2024 & 2032
- Figure 8: Middle East and Africa Auto Injector Industry Revenue (Million), by Country 2024 & 2032
- Figure 9: Middle East and Africa Auto Injector Industry Revenue Share (%), by Country 2024 & 2032
- Figure 10: South America Auto Injector Industry Revenue (Million), by Country 2024 & 2032
- Figure 11: South America Auto Injector Industry Revenue Share (%), by Country 2024 & 2032
- Figure 12: North America Auto Injector Industry Revenue (Million), by Application 2024 & 2032
- Figure 13: North America Auto Injector Industry Revenue Share (%), by Application 2024 & 2032
- Figure 14: North America Auto Injector Industry Revenue (Million), by Type 2024 & 2032
- Figure 15: North America Auto Injector Industry Revenue Share (%), by Type 2024 & 2032
- Figure 16: North America Auto Injector Industry Revenue (Million), by End User 2024 & 2032
- Figure 17: North America Auto Injector Industry Revenue Share (%), by End User 2024 & 2032
- Figure 18: North America Auto Injector Industry Revenue (Million), by Country 2024 & 2032
- Figure 19: North America Auto Injector Industry Revenue Share (%), by Country 2024 & 2032
- Figure 20: Europe Auto Injector Industry Revenue (Million), by Application 2024 & 2032
- Figure 21: Europe Auto Injector Industry Revenue Share (%), by Application 2024 & 2032
- Figure 22: Europe Auto Injector Industry Revenue (Million), by Type 2024 & 2032
- Figure 23: Europe Auto Injector Industry Revenue Share (%), by Type 2024 & 2032
- Figure 24: Europe Auto Injector Industry Revenue (Million), by End User 2024 & 2032
- Figure 25: Europe Auto Injector Industry Revenue Share (%), by End User 2024 & 2032
- Figure 26: Europe Auto Injector Industry Revenue (Million), by Country 2024 & 2032
- Figure 27: Europe Auto Injector Industry Revenue Share (%), by Country 2024 & 2032
- Figure 28: Asia Pacific Auto Injector Industry Revenue (Million), by Application 2024 & 2032
- Figure 29: Asia Pacific Auto Injector Industry Revenue Share (%), by Application 2024 & 2032
- Figure 30: Asia Pacific Auto Injector Industry Revenue (Million), by Type 2024 & 2032
- Figure 31: Asia Pacific Auto Injector Industry Revenue Share (%), by Type 2024 & 2032
- Figure 32: Asia Pacific Auto Injector Industry Revenue (Million), by End User 2024 & 2032
- Figure 33: Asia Pacific Auto Injector Industry Revenue Share (%), by End User 2024 & 2032
- Figure 34: Asia Pacific Auto Injector Industry Revenue (Million), by Country 2024 & 2032
- Figure 35: Asia Pacific Auto Injector Industry Revenue Share (%), by Country 2024 & 2032
- Figure 36: Middle East and Africa Auto Injector Industry Revenue (Million), by Application 2024 & 2032
- Figure 37: Middle East and Africa Auto Injector Industry Revenue Share (%), by Application 2024 & 2032
- Figure 38: Middle East and Africa Auto Injector Industry Revenue (Million), by Type 2024 & 2032
- Figure 39: Middle East and Africa Auto Injector Industry Revenue Share (%), by Type 2024 & 2032
- Figure 40: Middle East and Africa Auto Injector Industry Revenue (Million), by End User 2024 & 2032
- Figure 41: Middle East and Africa Auto Injector Industry Revenue Share (%), by End User 2024 & 2032
- Figure 42: Middle East and Africa Auto Injector Industry Revenue (Million), by Country 2024 & 2032
- Figure 43: Middle East and Africa Auto Injector Industry Revenue Share (%), by Country 2024 & 2032
- Figure 44: South America Auto Injector Industry Revenue (Million), by Application 2024 & 2032
- Figure 45: South America Auto Injector Industry Revenue Share (%), by Application 2024 & 2032
- Figure 46: South America Auto Injector Industry Revenue (Million), by Type 2024 & 2032
- Figure 47: South America Auto Injector Industry Revenue Share (%), by Type 2024 & 2032
- Figure 48: South America Auto Injector Industry Revenue (Million), by End User 2024 & 2032
- Figure 49: South America Auto Injector Industry Revenue Share (%), by End User 2024 & 2032
- Figure 50: South America Auto Injector Industry Revenue (Million), by Country 2024 & 2032
- Figure 51: South America Auto Injector Industry Revenue Share (%), by Country 2024 & 2032
List of Tables
- Table 1: Global Auto Injector Industry Revenue Million Forecast, by Region 2019 & 2032
- Table 2: Global Auto Injector Industry Revenue Million Forecast, by Application 2019 & 2032
- Table 3: Global Auto Injector Industry Revenue Million Forecast, by Type 2019 & 2032
- Table 4: Global Auto Injector Industry Revenue Million Forecast, by End User 2019 & 2032
- Table 5: Global Auto Injector Industry Revenue Million Forecast, by Region 2019 & 2032
- Table 6: Global Auto Injector Industry Revenue Million Forecast, by Country 2019 & 2032
- Table 7: United States Auto Injector Industry Revenue (Million) Forecast, by Application 2019 & 2032
- Table 8: Canada Auto Injector Industry Revenue (Million) Forecast, by Application 2019 & 2032
- Table 9: Mexico Auto Injector Industry Revenue (Million) Forecast, by Application 2019 & 2032
- Table 10: Global Auto Injector Industry Revenue Million Forecast, by Country 2019 & 2032
- Table 11: Germany Auto Injector Industry Revenue (Million) Forecast, by Application 2019 & 2032
- Table 12: United Kingdom Auto Injector Industry Revenue (Million) Forecast, by Application 2019 & 2032
- Table 13: France Auto Injector Industry Revenue (Million) Forecast, by Application 2019 & 2032
- Table 14: Italy Auto Injector Industry Revenue (Million) Forecast, by Application 2019 & 2032
- Table 15: Spain Auto Injector Industry Revenue (Million) Forecast, by Application 2019 & 2032
- Table 16: Rest of Europe Auto Injector Industry Revenue (Million) Forecast, by Application 2019 & 2032
- Table 17: Global Auto Injector Industry Revenue Million Forecast, by Country 2019 & 2032
- Table 18: China Auto Injector Industry Revenue (Million) Forecast, by Application 2019 & 2032
- Table 19: Japan Auto Injector Industry Revenue (Million) Forecast, by Application 2019 & 2032
- Table 20: India Auto Injector Industry Revenue (Million) Forecast, by Application 2019 & 2032
- Table 21: Australia Auto Injector Industry Revenue (Million) Forecast, by Application 2019 & 2032
- Table 22: South Korea Auto Injector Industry Revenue (Million) Forecast, by Application 2019 & 2032
- Table 23: Rest of Asia Pacific Auto Injector Industry Revenue (Million) Forecast, by Application 2019 & 2032
- Table 24: Global Auto Injector Industry Revenue Million Forecast, by Country 2019 & 2032
- Table 25: GCC Auto Injector Industry Revenue (Million) Forecast, by Application 2019 & 2032
- Table 26: South Africa Auto Injector Industry Revenue (Million) Forecast, by Application 2019 & 2032
- Table 27: Rest of Middle East and Africa Auto Injector Industry Revenue (Million) Forecast, by Application 2019 & 2032
- Table 28: Global Auto Injector Industry Revenue Million Forecast, by Country 2019 & 2032
- Table 29: Brazil Auto Injector Industry Revenue (Million) Forecast, by Application 2019 & 2032
- Table 30: Argentina Auto Injector Industry Revenue (Million) Forecast, by Application 2019 & 2032
- Table 31: Rest of South America Auto Injector Industry Revenue (Million) Forecast, by Application 2019 & 2032
- Table 32: Global Auto Injector Industry Revenue Million Forecast, by Application 2019 & 2032
- Table 33: Global Auto Injector Industry Revenue Million Forecast, by Type 2019 & 2032
- Table 34: Global Auto Injector Industry Revenue Million Forecast, by End User 2019 & 2032
- Table 35: Global Auto Injector Industry Revenue Million Forecast, by Country 2019 & 2032
- Table 36: United States Auto Injector Industry Revenue (Million) Forecast, by Application 2019 & 2032
- Table 37: Canada Auto Injector Industry Revenue (Million) Forecast, by Application 2019 & 2032
- Table 38: Mexico Auto Injector Industry Revenue (Million) Forecast, by Application 2019 & 2032
- Table 39: Global Auto Injector Industry Revenue Million Forecast, by Application 2019 & 2032
- Table 40: Global Auto Injector Industry Revenue Million Forecast, by Type 2019 & 2032
- Table 41: Global Auto Injector Industry Revenue Million Forecast, by End User 2019 & 2032
- Table 42: Global Auto Injector Industry Revenue Million Forecast, by Country 2019 & 2032
- Table 43: Germany Auto Injector Industry Revenue (Million) Forecast, by Application 2019 & 2032
- Table 44: United Kingdom Auto Injector Industry Revenue (Million) Forecast, by Application 2019 & 2032
- Table 45: France Auto Injector Industry Revenue (Million) Forecast, by Application 2019 & 2032
- Table 46: Italy Auto Injector Industry Revenue (Million) Forecast, by Application 2019 & 2032
- Table 47: Spain Auto Injector Industry Revenue (Million) Forecast, by Application 2019 & 2032
- Table 48: Rest of Europe Auto Injector Industry Revenue (Million) Forecast, by Application 2019 & 2032
- Table 49: Global Auto Injector Industry Revenue Million Forecast, by Application 2019 & 2032
- Table 50: Global Auto Injector Industry Revenue Million Forecast, by Type 2019 & 2032
- Table 51: Global Auto Injector Industry Revenue Million Forecast, by End User 2019 & 2032
- Table 52: Global Auto Injector Industry Revenue Million Forecast, by Country 2019 & 2032
- Table 53: China Auto Injector Industry Revenue (Million) Forecast, by Application 2019 & 2032
- Table 54: Japan Auto Injector Industry Revenue (Million) Forecast, by Application 2019 & 2032
- Table 55: India Auto Injector Industry Revenue (Million) Forecast, by Application 2019 & 2032
- Table 56: Australia Auto Injector Industry Revenue (Million) Forecast, by Application 2019 & 2032
- Table 57: South Korea Auto Injector Industry Revenue (Million) Forecast, by Application 2019 & 2032
- Table 58: Rest of Asia Pacific Auto Injector Industry Revenue (Million) Forecast, by Application 2019 & 2032
- Table 59: Global Auto Injector Industry Revenue Million Forecast, by Application 2019 & 2032
- Table 60: Global Auto Injector Industry Revenue Million Forecast, by Type 2019 & 2032
- Table 61: Global Auto Injector Industry Revenue Million Forecast, by End User 2019 & 2032
- Table 62: Global Auto Injector Industry Revenue Million Forecast, by Country 2019 & 2032
- Table 63: GCC Auto Injector Industry Revenue (Million) Forecast, by Application 2019 & 2032
- Table 64: South Africa Auto Injector Industry Revenue (Million) Forecast, by Application 2019 & 2032
- Table 65: Rest of Middle East and Africa Auto Injector Industry Revenue (Million) Forecast, by Application 2019 & 2032
- Table 66: Global Auto Injector Industry Revenue Million Forecast, by Application 2019 & 2032
- Table 67: Global Auto Injector Industry Revenue Million Forecast, by Type 2019 & 2032
- Table 68: Global Auto Injector Industry Revenue Million Forecast, by End User 2019 & 2032
- Table 69: Global Auto Injector Industry Revenue Million Forecast, by Country 2019 & 2032
- Table 70: Brazil Auto Injector Industry Revenue (Million) Forecast, by Application 2019 & 2032
- Table 71: Argentina Auto Injector Industry Revenue (Million) Forecast, by Application 2019 & 2032
- Table 72: Rest of South America Auto Injector Industry Revenue (Million) Forecast, by Application 2019 & 2032
Frequently Asked Questions
1. What is the projected Compound Annual Growth Rate (CAGR) of the Auto Injector Industry?
The projected CAGR is approximately 16.05%.
2. Which companies are prominent players in the Auto Injector Industry?
Key companies in the market include Becton Dickinson and Company, Amgen, Eli Lilly, Novartis, Teva Pharmaceuticals, Biogen, AstraZeneca, Abbvie, Ypsomed*List Not Exhaustive, Bayer.
3. What are the main segments of the Auto Injector Industry?
The market segments include Application, Type, End User.
4. Can you provide details about the market size?
The market size is estimated to be USD 10.84 Million as of 2022.
5. What are some drivers contributing to market growth?
Increasing Demand for Convenience of Patients; Rising Incidence of Chronic and Lifestyle Diseases; Technological Advancements.
6. What are the notable trends driving market growth?
Rheumatoid Arthritis Expected to Hold Significant Market Share Over the Forecast Period.
7. Are there any restraints impacting market growth?
Preference for Alternative Drug Delivery Modes; Regulatory Hurdles.
8. Can you provide examples of recent developments in the market?
In May 2022, Jabil Healthcare, a division of Jabil Inc. launched the Qfinity autoinjector platform, a simple, reusable, and modular solution for subcutaneous (SC) drug self-administration, at a lower cost than market alternatives.
9. What pricing options are available for accessing the report?
Pricing options include single-user, multi-user, and enterprise licenses priced at USD 4750, USD 5250, and USD 8750 respectively.
10. Is the market size provided in terms of value or volume?
The market size is provided in terms of value, measured in Million.
11. Are there any specific market keywords associated with the report?
Yes, the market keyword associated with the report is "Auto Injector Industry," which aids in identifying and referencing the specific market segment covered.
12. How do I determine which pricing option suits my needs best?
The pricing options vary based on user requirements and access needs. Individual users may opt for single-user licenses, while businesses requiring broader access may choose multi-user or enterprise licenses for cost-effective access to the report.
13. Are there any additional resources or data provided in the Auto Injector Industry report?
While the report offers comprehensive insights, it's advisable to review the specific contents or supplementary materials provided to ascertain if additional resources or data are available.
14. How can I stay updated on further developments or reports in the Auto Injector Industry?
To stay informed about further developments, trends, and reports in the Auto Injector Industry, consider subscribing to industry newsletters, following relevant companies and organizations, or regularly checking reputable industry news sources and publications.
Methodology
Step 1 - Identification of Relevant Samples Size from Population Database


Step 2 - Approaches for Defining Global Market Size (Value, Volume* & Price*)

Note*: In applicable scenarios
Step 3 - Data Sources
Primary Research
- Web Analytics
- Survey Reports
- Research Institute
- Latest Research Reports
- Opinion Leaders
Secondary Research
- Annual Reports
- White Paper
- Latest Press Release
- Industry Association
- Paid Database
- Investor Presentations

Step 4 - Data Triangulation
Involves using different sources of information in order to increase the validity of a study
These sources are likely to be stakeholders in a program - participants, other researchers, program staff, other community members, and so on.
Then we put all data in single framework & apply various statistical tools to find out the dynamic on the market.
During the analysis stage, feedback from the stakeholder groups would be compared to determine areas of agreement as well as areas of divergence


