
Key Insights
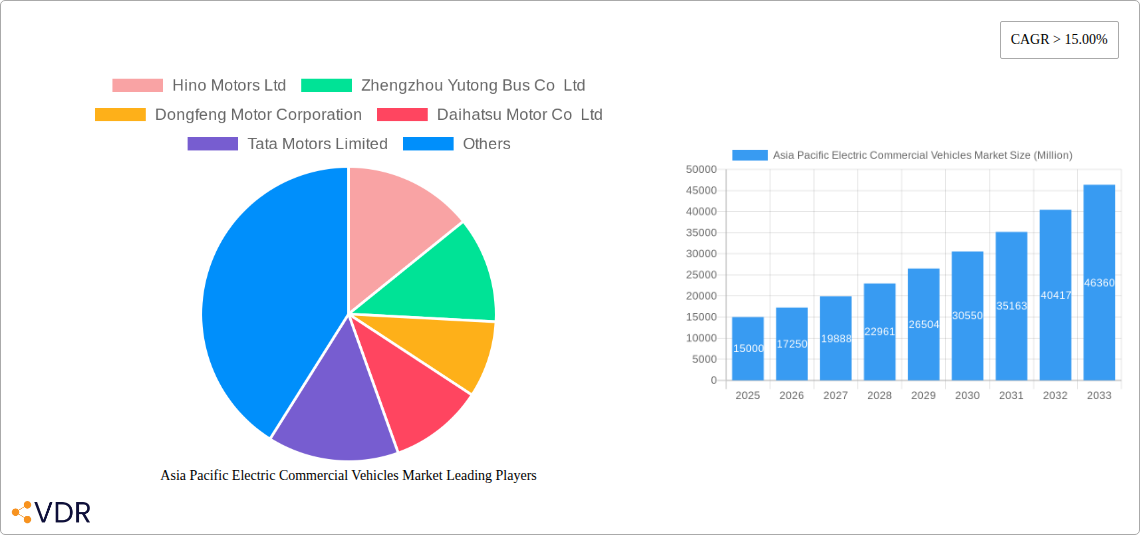
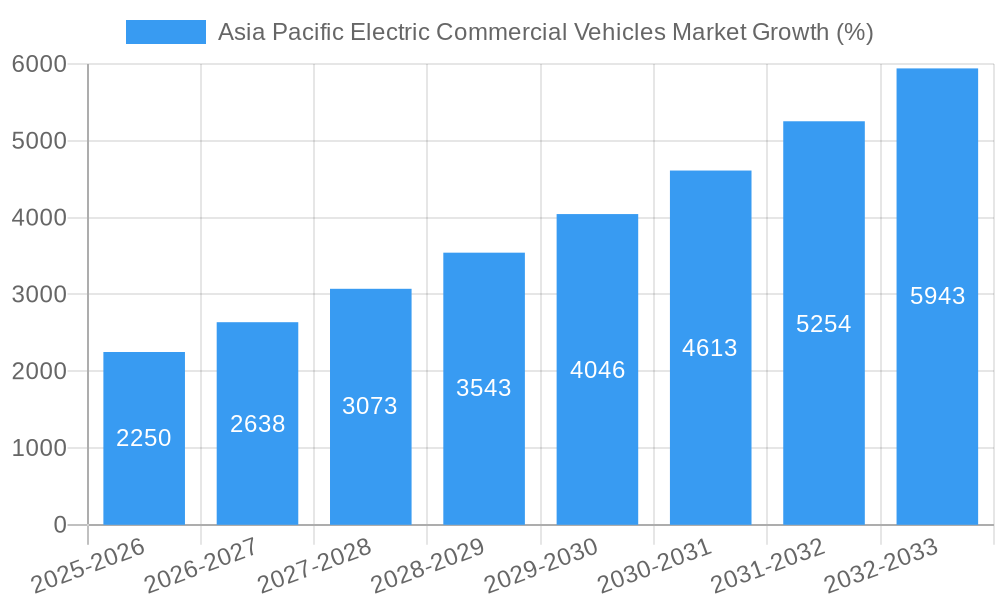
The Asia-Pacific Electric Commercial Vehicles market is experiencing robust growth, driven by stringent emission regulations, increasing fuel costs, and government incentives promoting sustainable transportation. The market, valued at approximately $15 billion in 2025, is projected to maintain a Compound Annual Growth Rate (CAGR) exceeding 15% through 2033, reaching an estimated market size of over $60 billion. This expansion is fueled by significant advancements in battery technology, leading to increased range and reduced charging times for electric commercial vehicles (ECVs). China, India, and Japan are key growth drivers, representing a significant share of the overall market due to their large commercial vehicle fleets and supportive government policies focused on electric vehicle adoption. The increasing adoption of BEVs (Battery Electric Vehicles) is the most significant trend, outpacing other electric vehicle types like PHEVs (Plug-in Hybrid Electric Vehicles) and FCEVs (Fuel Cell Electric Vehicles), although the latter are expected to witness growth in specific niche applications. However, challenges remain, including the high initial cost of ECVs, limited charging infrastructure in some regions, and concerns about battery lifespan and disposal. The market segmentation across vehicle body types (buses, trucks, vans) reveals varied growth trajectories, influenced by factors such as vehicle size, operational requirements, and charging infrastructure availability.
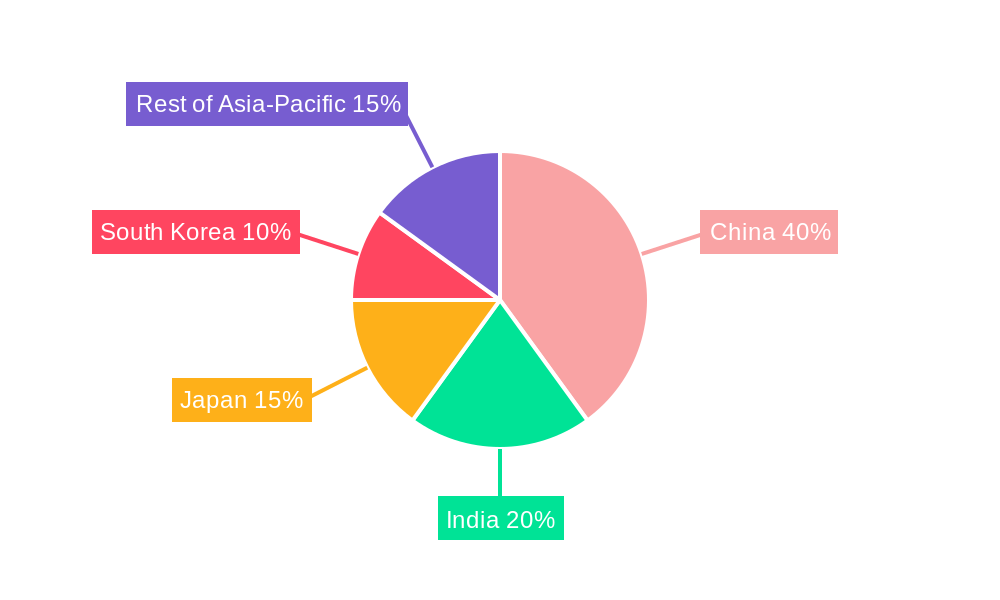
The competitive landscape is dynamic, with both established automotive manufacturers like Toyota, Hyundai, and Tata Motors, and emerging EV specialists such as BYD Auto, competing for market share. Strategic partnerships, mergers and acquisitions, and continuous innovation in battery technology and charging solutions are shaping the market's competitive dynamics. The regional breakdown shows a concentration of market share in China, followed by Japan, India, and South Korea, reflecting their advanced manufacturing capabilities, substantial investments in EV infrastructure, and supportive government policies. Continued government support, especially in the form of subsidies and tax incentives, will be crucial to overcoming the challenges and accelerating the market's growth trajectory in the coming years. Expansion of charging infrastructure is also a key factor determining the market's future growth potential.
Asia Pacific Electric Commercial Vehicles Market: 2019-2033 Forecast
This comprehensive report provides an in-depth analysis of the Asia Pacific electric commercial vehicles market, encompassing market dynamics, growth trends, dominant segments, and key players. The study period spans 2019-2033, with 2025 as the base year and a forecast period of 2025-2033. The report offers crucial insights for industry professionals, investors, and strategic decision-makers seeking to understand and capitalize on opportunities within this rapidly evolving sector. The report covers a total market size of xx Million units by 2033.
Asia Pacific Electric Commercial Vehicles Market Dynamics & Structure
The Asia Pacific electric commercial vehicle market is characterized by increasing market concentration among leading players, driven by significant technological innovations and supportive government regulations. The market is experiencing a shift towards electric powertrains, fuelled by environmental concerns and the decreasing cost of battery technology. However, challenges remain, including the high initial cost of electric vehicles, limited charging infrastructure, and range anxiety. Mergers and acquisitions (M&A) activity is expected to increase, furthering market consolidation.
- Market Concentration: The top 5 players hold approximately xx% of the market share in 2025.
- Technological Innovation: Significant advancements in battery technology, charging infrastructure, and vehicle efficiency are key drivers.
- Regulatory Framework: Government incentives, emission standards, and policies promoting electric vehicle adoption are shaping market growth. China and India are leading in policy support.
- Competitive Product Substitutes: Internal combustion engine (ICE) vehicles remain a significant competitor, although their market share is declining.
- End-User Demographics: The primary end-users are logistics companies, public transportation agencies, and delivery services. Growing e-commerce fuels demand for light commercial vehicles.
- M&A Trends: An estimated xx M&A deals related to electric commercial vehicles occurred in the APAC region between 2019 and 2024.
Asia Pacific Electric Commercial Vehicles Market Growth Trends & Insights
The Asia Pacific electric commercial vehicle market is experiencing robust growth, driven by factors such as rising environmental awareness, government support for electric mobility, and the decreasing cost of battery technology. The market size is projected to experience a Compound Annual Growth Rate (CAGR) of xx% during the forecast period (2025-2033), reaching xx million units by 2033. This growth is particularly pronounced in countries such as China and India, which are witnessing rapid urbanization and industrialization. Technological advancements, such as improved battery technology and faster charging times, are further accelerating market adoption. Consumer behavior is shifting towards eco-friendly transportation solutions, influencing purchasing decisions among businesses.
Dominant Regions, Countries, or Segments in Asia Pacific Electric Commercial Vehicles Market
China dominates the Asia Pacific electric commercial vehicle market, accounting for the largest market share in 2025 (xx%). This dominance is attributed to strong government support for electric mobility, a large and expanding commercial vehicle fleet, and a robust domestic manufacturing base. India is another key market exhibiting high growth potential due to increasing infrastructure development and government initiatives promoting electric vehicles. Within segments, the BEV (Battery Electric Vehicle) segment holds the largest market share, followed by the PHEV (Plug-in Hybrid Electric Vehicle) segment. Buses and light commercial vans are the leading vehicle body types driving market growth.
- Key Drivers for China: Strong government subsidies, extensive charging infrastructure, and a large manufacturing base.
- Key Drivers for India: Government initiatives focused on reducing air pollution and promoting domestic manufacturing.
- Key Drivers for BEV Segment: Decreasing battery costs and improving range capabilities.
- Key Drivers for Buses and Light Commercial Vans: High demand from public transportation and e-commerce sectors.
Asia Pacific Electric Commercial Vehicles Market Product Landscape
The Asia Pacific electric commercial vehicle market showcases a diverse range of products, encompassing various vehicle body types (buses, trucks, vans) and fuel categories (BEV, PHEV, HEV, FCEV). Recent innovations focus on improving battery range, charging speed, and overall vehicle efficiency. Key selling points include reduced operating costs compared to ICE vehicles, lower emissions, and government incentives. Technological advancements like advanced driver-assistance systems (ADAS) and connected vehicle technologies are becoming increasingly common.
Key Drivers, Barriers & Challenges in Asia Pacific Electric Commercial Vehicles Market
Key Drivers:
- Growing environmental concerns and stringent emission regulations.
- Government incentives and subsidies promoting electric vehicle adoption.
- Technological advancements leading to improved battery technology and lower costs.
- Increasing demand from e-commerce and logistics sectors.
Key Challenges:
- High initial purchase price of electric commercial vehicles.
- Limited charging infrastructure in certain regions.
- Range anxiety and concerns about charging time.
- Supply chain disruptions impacting battery production.
- xx% of commercial vehicle operators face financing challenges for EV adoption.
Emerging Opportunities in Asia Pacific Electric Commercial Vehicles Market
The Asia Pacific electric commercial vehicle market presents significant opportunities for growth. Untapped markets in Southeast Asia offer considerable potential. The increasing adoption of shared mobility services and the rise of last-mile delivery solutions create further demand for electric commercial vehicles. The development of innovative battery technologies and charging infrastructure will unlock new market opportunities.
Growth Accelerators in the Asia Pacific Electric Commercial Vehicles Market Industry
Technological breakthroughs in battery technology and charging infrastructure are key catalysts for long-term growth. Strategic partnerships between automakers and energy companies are enhancing the charging network and providing comprehensive solutions for fleet operators. Market expansion into less penetrated regions in Southeast Asia will further boost market growth.
Key Players Shaping the Asia Pacific Electric Commercial Vehicles Market Market
- Hino Motors Ltd
- Zhengzhou Yutong Bus Co Ltd
- Dongfeng Motor Corporation
- Daihatsu Motor Co Ltd
- Tata Motors Limited
- Hyundai Motor Company
- Mahindra & Mahindra Limited
- BYD Auto Co Ltd
- Higer Bus Company Ltd
- Mitsubishi Motors Corporation
Notable Milestones in Asia Pacific Electric Commercial Vehicles Market Sector
- July 2023: Yutong Group partners with Langfang Transportation to promote new energy logistics.
- June 2023: Yutong Bus unveils 10.5m and 12m hydrogen fuel cell buses.
- May 2023: Suzuki, Daihatsu, and Toyota develop an electric mini commercial vehicle with a 200km range.
In-Depth Asia Pacific Electric Commercial Vehicles Market Market Outlook
The Asia Pacific electric commercial vehicle market is poised for significant growth, driven by technological advancements, supportive government policies, and increasing demand from various sectors. Strategic investments in charging infrastructure and battery technology will be crucial for sustained growth. Companies focusing on innovation, strategic partnerships, and expansion into emerging markets will be well-positioned to capitalize on the market's immense potential.
Asia Pacific Electric Commercial Vehicles Market Segmentation
-
1. Vehicle Body Type
- 1.1. Buses
- 1.2. Heavy-duty Commercial Trucks
- 1.3. Light Commercial Pick-up Trucks
- 1.4. Light Commercial Vans
- 1.5. Medium-duty Commercial Trucks
-
2. Fuel Category
- 2.1. BEV
- 2.2. FCEV
- 2.3. HEV
- 2.4. PHEV
Asia Pacific Electric Commercial Vehicles Market Segmentation By Geography
-
1. Asia Pacific
- 1.1. China
- 1.2. Japan
- 1.3. South Korea
- 1.4. India
- 1.5. Australia
- 1.6. New Zealand
- 1.7. Indonesia
- 1.8. Malaysia
- 1.9. Singapore
- 1.10. Thailand
- 1.11. Vietnam
- 1.12. Philippines
Asia Pacific Electric Commercial Vehicles Market REPORT HIGHLIGHTS
| Aspects | Details |
|---|---|
| Study Period | 2019-2033 |
| Base Year | 2024 |
| Estimated Year | 2025 |
| Forecast Period | 2025-2033 |
| Historical Period | 2019-2024 |
| Growth Rate | CAGR of > 15.00% from 2019-2033 |
| Segmentation |
|
Table of Contents
- 1. Introduction
- 1.1. Research Scope
- 1.2. Market Segmentation
- 1.3. Research Methodology
- 1.4. Definitions and Assumptions
- 2. Executive Summary
- 2.1. Introduction
- 3. Market Dynamics
- 3.1. Introduction
- 3.2. Market Drivers
- 3.2.1. Rise in Vehicle Electrification
- 3.3. Market Restrains
- 3.3.1. The Cost of Raw Materials Used in the Manufacturing of Switches is High
- 3.4. Market Trends
- 3.4.1. OTHER KEY INDUSTRY TRENDS COVERED IN THE REPORT
- 4. Market Factor Analysis
- 4.1. Porters Five Forces
- 4.2. Supply/Value Chain
- 4.3. PESTEL analysis
- 4.4. Market Entropy
- 4.5. Patent/Trademark Analysis
- 5. Asia Pacific Electric Commercial Vehicles Market Analysis, Insights and Forecast, 2019-2031
- 5.1. Market Analysis, Insights and Forecast - by Vehicle Body Type
- 5.1.1. Buses
- 5.1.2. Heavy-duty Commercial Trucks
- 5.1.3. Light Commercial Pick-up Trucks
- 5.1.4. Light Commercial Vans
- 5.1.5. Medium-duty Commercial Trucks
- 5.2. Market Analysis, Insights and Forecast - by Fuel Category
- 5.2.1. BEV
- 5.2.2. FCEV
- 5.2.3. HEV
- 5.2.4. PHEV
- 5.3. Market Analysis, Insights and Forecast - by Region
- 5.3.1. Asia Pacific
- 5.1. Market Analysis, Insights and Forecast - by Vehicle Body Type
- 6. China Asia Pacific Electric Commercial Vehicles Market Analysis, Insights and Forecast, 2019-2031
- 7. Japan Asia Pacific Electric Commercial Vehicles Market Analysis, Insights and Forecast, 2019-2031
- 8. India Asia Pacific Electric Commercial Vehicles Market Analysis, Insights and Forecast, 2019-2031
- 9. South Korea Asia Pacific Electric Commercial Vehicles Market Analysis, Insights and Forecast, 2019-2031
- 10. Taiwan Asia Pacific Electric Commercial Vehicles Market Analysis, Insights and Forecast, 2019-2031
- 11. Australia Asia Pacific Electric Commercial Vehicles Market Analysis, Insights and Forecast, 2019-2031
- 12. Rest of Asia-Pacific Asia Pacific Electric Commercial Vehicles Market Analysis, Insights and Forecast, 2019-2031
- 13. Competitive Analysis
- 13.1. Market Share Analysis 2024
- 13.2. Company Profiles
- 13.2.1 Hino Motors Ltd
- 13.2.1.1. Overview
- 13.2.1.2. Products
- 13.2.1.3. SWOT Analysis
- 13.2.1.4. Recent Developments
- 13.2.1.5. Financials (Based on Availability)
- 13.2.2 Zhengzhou Yutong Bus Co Ltd
- 13.2.2.1. Overview
- 13.2.2.2. Products
- 13.2.2.3. SWOT Analysis
- 13.2.2.4. Recent Developments
- 13.2.2.5. Financials (Based on Availability)
- 13.2.3 Dongfeng Motor Corporation
- 13.2.3.1. Overview
- 13.2.3.2. Products
- 13.2.3.3. SWOT Analysis
- 13.2.3.4. Recent Developments
- 13.2.3.5. Financials (Based on Availability)
- 13.2.4 Daihatsu Motor Co Ltd
- 13.2.4.1. Overview
- 13.2.4.2. Products
- 13.2.4.3. SWOT Analysis
- 13.2.4.4. Recent Developments
- 13.2.4.5. Financials (Based on Availability)
- 13.2.5 Tata Motors Limited
- 13.2.5.1. Overview
- 13.2.5.2. Products
- 13.2.5.3. SWOT Analysis
- 13.2.5.4. Recent Developments
- 13.2.5.5. Financials (Based on Availability)
- 13.2.6 Hyundai Motor Company
- 13.2.6.1. Overview
- 13.2.6.2. Products
- 13.2.6.3. SWOT Analysis
- 13.2.6.4. Recent Developments
- 13.2.6.5. Financials (Based on Availability)
- 13.2.7 Mahindra & Mahindra Limited
- 13.2.7.1. Overview
- 13.2.7.2. Products
- 13.2.7.3. SWOT Analysis
- 13.2.7.4. Recent Developments
- 13.2.7.5. Financials (Based on Availability)
- 13.2.8 BYD Auto Co Ltd
- 13.2.8.1. Overview
- 13.2.8.2. Products
- 13.2.8.3. SWOT Analysis
- 13.2.8.4. Recent Developments
- 13.2.8.5. Financials (Based on Availability)
- 13.2.9 Higer Bus Company Ltd
- 13.2.9.1. Overview
- 13.2.9.2. Products
- 13.2.9.3. SWOT Analysis
- 13.2.9.4. Recent Developments
- 13.2.9.5. Financials (Based on Availability)
- 13.2.10 Mitsubishi Motors Corporation
- 13.2.10.1. Overview
- 13.2.10.2. Products
- 13.2.10.3. SWOT Analysis
- 13.2.10.4. Recent Developments
- 13.2.10.5. Financials (Based on Availability)
- 13.2.1 Hino Motors Ltd
List of Figures
- Figure 1: Asia Pacific Electric Commercial Vehicles Market Revenue Breakdown (Million, %) by Product 2024 & 2032
- Figure 2: Asia Pacific Electric Commercial Vehicles Market Share (%) by Company 2024
List of Tables
- Table 1: Asia Pacific Electric Commercial Vehicles Market Revenue Million Forecast, by Region 2019 & 2032
- Table 2: Asia Pacific Electric Commercial Vehicles Market Revenue Million Forecast, by Vehicle Body Type 2019 & 2032
- Table 3: Asia Pacific Electric Commercial Vehicles Market Revenue Million Forecast, by Fuel Category 2019 & 2032
- Table 4: Asia Pacific Electric Commercial Vehicles Market Revenue Million Forecast, by Region 2019 & 2032
- Table 5: Asia Pacific Electric Commercial Vehicles Market Revenue Million Forecast, by Country 2019 & 2032
- Table 6: China Asia Pacific Electric Commercial Vehicles Market Revenue (Million) Forecast, by Application 2019 & 2032
- Table 7: Japan Asia Pacific Electric Commercial Vehicles Market Revenue (Million) Forecast, by Application 2019 & 2032
- Table 8: India Asia Pacific Electric Commercial Vehicles Market Revenue (Million) Forecast, by Application 2019 & 2032
- Table 9: South Korea Asia Pacific Electric Commercial Vehicles Market Revenue (Million) Forecast, by Application 2019 & 2032
- Table 10: Taiwan Asia Pacific Electric Commercial Vehicles Market Revenue (Million) Forecast, by Application 2019 & 2032
- Table 11: Australia Asia Pacific Electric Commercial Vehicles Market Revenue (Million) Forecast, by Application 2019 & 2032
- Table 12: Rest of Asia-Pacific Asia Pacific Electric Commercial Vehicles Market Revenue (Million) Forecast, by Application 2019 & 2032
- Table 13: Asia Pacific Electric Commercial Vehicles Market Revenue Million Forecast, by Vehicle Body Type 2019 & 2032
- Table 14: Asia Pacific Electric Commercial Vehicles Market Revenue Million Forecast, by Fuel Category 2019 & 2032
- Table 15: Asia Pacific Electric Commercial Vehicles Market Revenue Million Forecast, by Country 2019 & 2032
- Table 16: China Asia Pacific Electric Commercial Vehicles Market Revenue (Million) Forecast, by Application 2019 & 2032
- Table 17: Japan Asia Pacific Electric Commercial Vehicles Market Revenue (Million) Forecast, by Application 2019 & 2032
- Table 18: South Korea Asia Pacific Electric Commercial Vehicles Market Revenue (Million) Forecast, by Application 2019 & 2032
- Table 19: India Asia Pacific Electric Commercial Vehicles Market Revenue (Million) Forecast, by Application 2019 & 2032
- Table 20: Australia Asia Pacific Electric Commercial Vehicles Market Revenue (Million) Forecast, by Application 2019 & 2032
- Table 21: New Zealand Asia Pacific Electric Commercial Vehicles Market Revenue (Million) Forecast, by Application 2019 & 2032
- Table 22: Indonesia Asia Pacific Electric Commercial Vehicles Market Revenue (Million) Forecast, by Application 2019 & 2032
- Table 23: Malaysia Asia Pacific Electric Commercial Vehicles Market Revenue (Million) Forecast, by Application 2019 & 2032
- Table 24: Singapore Asia Pacific Electric Commercial Vehicles Market Revenue (Million) Forecast, by Application 2019 & 2032
- Table 25: Thailand Asia Pacific Electric Commercial Vehicles Market Revenue (Million) Forecast, by Application 2019 & 2032
- Table 26: Vietnam Asia Pacific Electric Commercial Vehicles Market Revenue (Million) Forecast, by Application 2019 & 2032
- Table 27: Philippines Asia Pacific Electric Commercial Vehicles Market Revenue (Million) Forecast, by Application 2019 & 2032
Frequently Asked Questions
1. What is the projected Compound Annual Growth Rate (CAGR) of the Asia Pacific Electric Commercial Vehicles Market?
The projected CAGR is approximately > 15.00%.
2. Which companies are prominent players in the Asia Pacific Electric Commercial Vehicles Market?
Key companies in the market include Hino Motors Ltd, Zhengzhou Yutong Bus Co Ltd, Dongfeng Motor Corporation, Daihatsu Motor Co Ltd, Tata Motors Limited, Hyundai Motor Company, Mahindra & Mahindra Limited, BYD Auto Co Ltd, Higer Bus Company Ltd, Mitsubishi Motors Corporation.
3. What are the main segments of the Asia Pacific Electric Commercial Vehicles Market?
The market segments include Vehicle Body Type, Fuel Category.
4. Can you provide details about the market size?
The market size is estimated to be USD XX Million as of 2022.
5. What are some drivers contributing to market growth?
Rise in Vehicle Electrification.
6. What are the notable trends driving market growth?
OTHER KEY INDUSTRY TRENDS COVERED IN THE REPORT.
7. Are there any restraints impacting market growth?
The Cost of Raw Materials Used in the Manufacturing of Switches is High.
8. Can you provide examples of recent developments in the market?
July 2023: Yutong Group forms a partnership with Langfang Transportation to jointly promote the development of New Energy logistics transportation.June 2023: Yutong Bus officially unveils two hydrogen fuel cell buses such as 10.5m- and 12m-long hydrogen fuel cell buses at the 11th Zhengzhou International New Energy Vehicle Expo.May 2023: With 200 kilometers range,Suzuki, Daihatsu and Toyota have developed the Electric Mini Commercial Vehicle.
9. What pricing options are available for accessing the report?
Pricing options include single-user, multi-user, and enterprise licenses priced at USD 3800, USD 4500, and USD 5800 respectively.
10. Is the market size provided in terms of value or volume?
The market size is provided in terms of value, measured in Million.
11. Are there any specific market keywords associated with the report?
Yes, the market keyword associated with the report is "Asia Pacific Electric Commercial Vehicles Market," which aids in identifying and referencing the specific market segment covered.
12. How do I determine which pricing option suits my needs best?
The pricing options vary based on user requirements and access needs. Individual users may opt for single-user licenses, while businesses requiring broader access may choose multi-user or enterprise licenses for cost-effective access to the report.
13. Are there any additional resources or data provided in the Asia Pacific Electric Commercial Vehicles Market report?
While the report offers comprehensive insights, it's advisable to review the specific contents or supplementary materials provided to ascertain if additional resources or data are available.
14. How can I stay updated on further developments or reports in the Asia Pacific Electric Commercial Vehicles Market?
To stay informed about further developments, trends, and reports in the Asia Pacific Electric Commercial Vehicles Market, consider subscribing to industry newsletters, following relevant companies and organizations, or regularly checking reputable industry news sources and publications.
Methodology
Step 1 - Identification of Relevant Samples Size from Population Database


Step 2 - Approaches for Defining Global Market Size (Value, Volume* & Price*)

Note*: In applicable scenarios
Step 3 - Data Sources
Primary Research
- Web Analytics
- Survey Reports
- Research Institute
- Latest Research Reports
- Opinion Leaders
Secondary Research
- Annual Reports
- White Paper
- Latest Press Release
- Industry Association
- Paid Database
- Investor Presentations

Step 4 - Data Triangulation
Involves using different sources of information in order to increase the validity of a study
These sources are likely to be stakeholders in a program - participants, other researchers, program staff, other community members, and so on.
Then we put all data in single framework & apply various statistical tools to find out the dynamic on the market.
During the analysis stage, feedback from the stakeholder groups would be compared to determine areas of agreement as well as areas of divergence


