
Key Insights
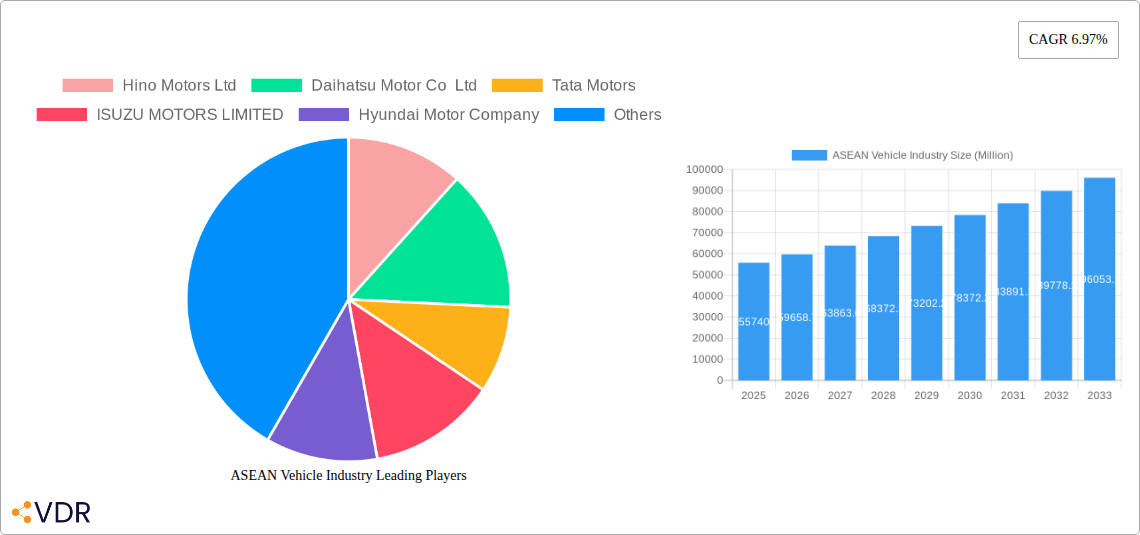
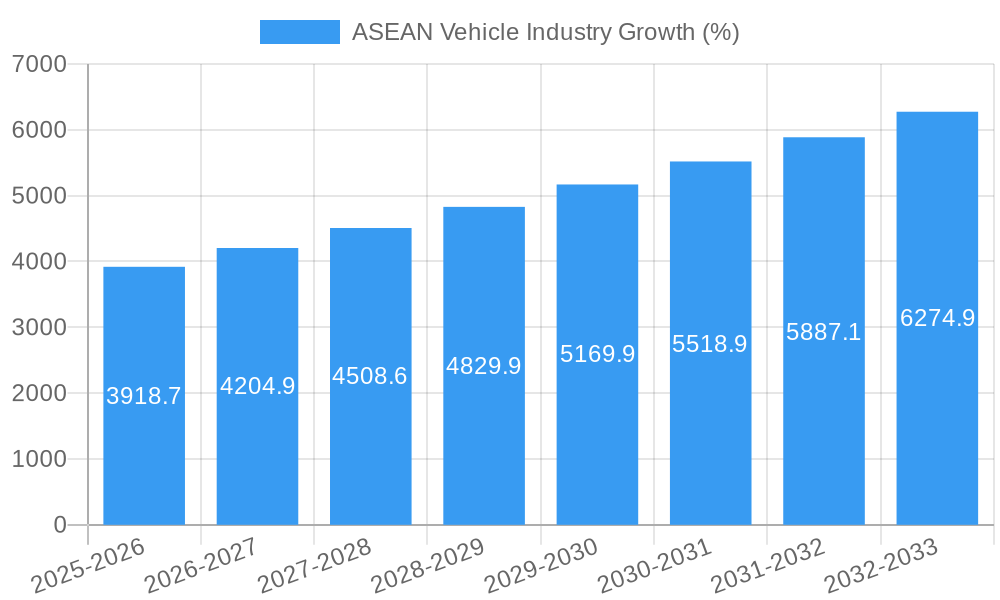
The ASEAN vehicle industry, valued at $55.74 billion in 2025, is projected to experience robust growth, exhibiting a Compound Annual Growth Rate (CAGR) of 6.97% from 2025 to 2033. This expansion is fueled by several key drivers. Rising disposable incomes across the region are boosting consumer demand for personal and commercial vehicles. Furthermore, government initiatives promoting infrastructure development, particularly road networks, are creating a favorable environment for vehicle sales. The burgeoning e-commerce sector is also significantly contributing to the demand for light commercial vehicles used in logistics and delivery services. However, challenges remain. Fluctuations in fuel prices and increasing concerns about environmental sustainability could impact growth. Furthermore, the ongoing global chip shortage, while easing, still poses a potential constraint on vehicle production.
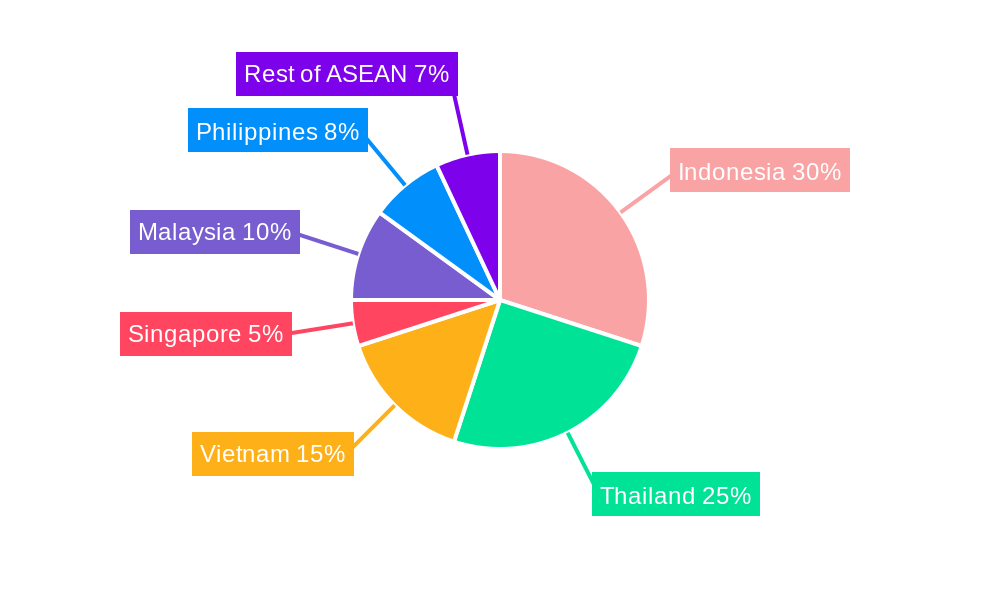
The ASEAN market is segmented by country, with Indonesia, Thailand, and Vietnam representing the largest markets. The vehicle type segment is divided between Light Commercial Vehicles (LCVs) and Medium- and Heavy-duty Commercial Vehicles (M&HCVs), with LCVs expected to dominate due to their affordability and suitability for various applications. Key players in the ASEAN vehicle market include established international brands like Hino Motors, Isuzu Motors, and Toyota (implicitly represented through Daihatsu), alongside local and regional players. The competitive landscape is dynamic, with companies continuously innovating to cater to evolving consumer preferences and regulatory requirements. The forecast period of 2025-2033 is expected to witness significant technological advancements, including the adoption of electric and hybrid vehicles, influencing market dynamics. Future growth will depend heavily on addressing the aforementioned challenges and capitalizing on the region's growing economic potential.
ASEAN Vehicle Industry Market Report: 2019-2033
This comprehensive report provides an in-depth analysis of the ASEAN vehicle industry, encompassing market dynamics, growth trends, key players, and future outlook. With a focus on both parent (ASEAN Vehicle Industry) and child markets (Light Commercial Vehicles, Medium- and Heavy-duty Commercial Vehicles, by country breakdowns), this report is an essential resource for industry professionals, investors, and strategists seeking to understand and capitalize on the region's dynamic automotive landscape. The report covers the historical period (2019-2024), base year (2025), and forecast period (2025-2033), providing a complete picture of the market's evolution and future trajectory. Market values are presented in million units.
ASEAN Vehicle Industry Market Dynamics & Structure
The ASEAN vehicle market is characterized by a complex interplay of factors influencing its structure and growth. Market concentration is moderate, with a few dominant players alongside numerous smaller, specialized companies. Technological innovation, particularly in electric vehicles (EVs) and connected car technologies, is a key driver, although high upfront investment and infrastructure limitations present significant barriers. Stringent emission regulations and safety standards are shaping the industry, creating both challenges and opportunities. The rise of ride-hailing services and the changing preferences of younger consumers impact demand for different vehicle types. Finally, M&A activity, while not exceptionally high in volume (xx deals annually on average in the historical period), has been strategically significant, particularly in the EV and commercial vehicle sectors.
- Market Concentration: Moderate, with a few large players holding significant market share (e.g., Toyota, Honda, etc.). Smaller players often specialize in specific segments.
- Technological Innovation: Driven by the shift toward EVs and the integration of advanced driver-assistance systems (ADAS).
- Regulatory Frameworks: Increasingly stringent emission standards are pushing for greener technologies. Safety regulations are also becoming more comprehensive.
- Competitive Product Substitutes: Ride-hailing services and public transportation pose competition, particularly in urban areas.
- End-User Demographics: The growing middle class and urbanization are major factors influencing demand, particularly for passenger vehicles.
- M&A Trends: Strategic acquisitions and joint ventures are reshaping the landscape, notably in the EV space (e.g., Foxconn's involvement).
ASEAN Vehicle Industry Growth Trends & Insights
The ASEAN vehicle market experienced a period of fluctuating growth during 2019-2024, influenced by economic conditions, government policies, and global supply chain disruptions. While specific CAGR figures for each segment and country will be available in the full report, the overall market shows a positive, albeit uneven, growth trajectory. The adoption rate of EVs is gradually increasing, although challenges like charging infrastructure limitations and consumer concerns about range and cost remain. Technological disruptions, such as the rise of autonomous driving technologies, present significant opportunities but also uncertainty. Consumer behavior is shifting towards a preference for fuel-efficient and eco-friendly vehicles, particularly in urban areas. The market is predicted to exhibit a CAGR of xx% from 2025-2033, with a market size of xx million units by 2033.
Dominant Regions, Countries, or Segments in ASEAN Vehicle Industry
Indonesia and Thailand are the dominant markets in terms of vehicle sales volume, consistently contributing to the majority of the market share across both vehicle types throughout the study period. Indonesia’s large population and growing middle class drive robust demand for Light Commercial Vehicles (LCVs). Thailand's automotive manufacturing base and export capabilities contribute significantly to the overall industry numbers. Within vehicle types, LCVs represent the largest segment, with steady growth fueled by strong demand from the logistics and transportation sectors.
- Key Drivers for Indonesia: Large population, growing middle class, robust infrastructure development.
- Key Drivers for Thailand: Established automotive manufacturing base, significant exports, supportive government policies.
- Key Drivers for LCV Segment: Growing e-commerce and logistics sectors, increasing urbanization.
- Market Share: Indonesia and Thailand hold approximately xx% and xx% of total ASEAN vehicle sales respectively. LCVs represent around xx% of the overall market.
- Growth Potential: Vietnam and the Philippines also show substantial growth potential, driven by economic expansion and infrastructure investments.
ASEAN Vehicle Industry Product Landscape
The ASEAN vehicle market offers a diverse range of products, from basic LCVs to sophisticated medium and heavy-duty commercial vehicles. Innovations focus on improving fuel efficiency, safety, and connectivity. Several manufacturers are introducing hybrid and electric vehicles to comply with stricter emission norms and cater to the growing demand for sustainable transportation. Unique selling propositions frequently include advanced driver-assistance systems, improved cargo capacity, and robust engine performance.
Key Drivers, Barriers & Challenges in ASEAN Vehicle Industry
Key Drivers:
- Growing economies and rising disposable incomes.
- Increasing urbanization and infrastructure development.
- Government incentives promoting vehicle ownership and manufacturing.
- Expansion of e-commerce and logistics sectors.
Challenges and Restraints:
- Supply chain disruptions and component shortages (estimated to impact xx million units annually on average in the historical period).
- High import duties and tariffs impacting vehicle pricing.
- Competition from regional and international manufacturers.
- Varying levels of infrastructure development and availability of charging stations (hindering EV adoption).
Emerging Opportunities in ASEAN Vehicle Industry
- Growing demand for electric and hybrid vehicles.
- Increasing adoption of connected car technologies.
- Expansion of ride-hailing and car-sharing services.
- Opportunities in rural markets with low vehicle penetration.
- Development of specialized vehicles for specific industries (e.g., agriculture, construction).
Growth Accelerators in the ASEAN Vehicle Industry Industry
Sustained economic growth in the ASEAN region, coupled with government initiatives promoting infrastructure development and sustainable transportation, are key growth accelerators. Technological advancements in EV technology and connected car capabilities will further stimulate market expansion. Strategic partnerships between local and international players, particularly in the production of EVs, will also contribute to accelerating industry growth.
Key Players Shaping the ASEAN Vehicle Industry Market
- Hino Motors Ltd
- Daihatsu Motor Co Ltd
- Tata Motors
- ISUZU MOTORS LIMITED
- Hyundai Motor Company
- FCA US LLC
- Scania
- UD Trucks Corp
- IVECO
- Honda Motor Co Ltd
- MITSUBISHI MOTORS CORPORATION
- Ford Motor Company
Notable Milestones in ASEAN Vehicle Industry Sector
- Oct 2022: Energy Absolute PCL announces plans to launch a 1-ton electric pickup truck.
- Sep 2022: PT Indika Energy Tbk. establishes a joint venture to manufacture commercial EVs and batteries.
- Jun 2022: MAN Truck & Bus (M) Sdn Bhd delivers its first batch of new MAN Truck Generation vehicles.
In-Depth ASEAN Vehicle Industry Market Outlook
The ASEAN vehicle market is poised for continued growth, driven by strong economic fundamentals, evolving consumer preferences, and technological advancements. Strategic investments in infrastructure, particularly charging infrastructure for EVs, and supportive government policies will shape the industry's future trajectory. The market presents lucrative opportunities for both established players and new entrants, particularly in the rapidly expanding EV segment and connected car technologies. Companies that can adapt to the changing market dynamics and effectively leverage technological innovation will be best positioned to succeed in this dynamic and promising industry.
ASEAN Vehicle Industry Segmentation
-
1. Vehicle Type
- 1.1. Light Commercial Vehicles
- 1.2. Medium- and Heavy-duty Commercial Vehicles
ASEAN Vehicle Industry Segmentation By Geography
-
1. North America
- 1.1. United States
- 1.2. Canada
- 1.3. Mexico
-
2. South America
- 2.1. Brazil
- 2.2. Argentina
- 2.3. Rest of South America
-
3. Europe
- 3.1. United Kingdom
- 3.2. Germany
- 3.3. France
- 3.4. Italy
- 3.5. Spain
- 3.6. Russia
- 3.7. Benelux
- 3.8. Nordics
- 3.9. Rest of Europe
-
4. Middle East & Africa
- 4.1. Turkey
- 4.2. Israel
- 4.3. GCC
- 4.4. North Africa
- 4.5. South Africa
- 4.6. Rest of Middle East & Africa
-
5. Asia Pacific
- 5.1. China
- 5.2. India
- 5.3. Japan
- 5.4. South Korea
- 5.5. ASEAN
- 5.6. Oceania
- 5.7. Rest of Asia Pacific
ASEAN Vehicle Industry REPORT HIGHLIGHTS
| Aspects | Details |
|---|---|
| Study Period | 2019-2033 |
| Base Year | 2024 |
| Estimated Year | 2025 |
| Forecast Period | 2025-2033 |
| Historical Period | 2019-2024 |
| Growth Rate | CAGR of 6.97% from 2019-2033 |
| Segmentation |
|
Table of Contents
- 1. Introduction
- 1.1. Research Scope
- 1.2. Market Segmentation
- 1.3. Research Methodology
- 1.4. Definitions and Assumptions
- 2. Executive Summary
- 2.1. Introduction
- 3. Market Dynamics
- 3.1. Introduction
- 3.2. Market Drivers
- 3.2.1. Technological Advancements In Vehicles Driving Demand; Others
- 3.3. Market Restrains
- 3.3.1. High Scan Tool Costs to Limit Growth; Others
- 3.4. Market Trends
- 3.4.1. The Light Commercial Vehicle Segment Dominates the Market
- 4. Market Factor Analysis
- 4.1. Porters Five Forces
- 4.2. Supply/Value Chain
- 4.3. PESTEL analysis
- 4.4. Market Entropy
- 4.5. Patent/Trademark Analysis
- 5. Global ASEAN Vehicle Industry Analysis, Insights and Forecast, 2019-2031
- 5.1. Market Analysis, Insights and Forecast - by Vehicle Type
- 5.1.1. Light Commercial Vehicles
- 5.1.2. Medium- and Heavy-duty Commercial Vehicles
- 5.2. Market Analysis, Insights and Forecast - by Region
- 5.2.1. North America
- 5.2.2. South America
- 5.2.3. Europe
- 5.2.4. Middle East & Africa
- 5.2.5. Asia Pacific
- 5.1. Market Analysis, Insights and Forecast - by Vehicle Type
- 6. North America ASEAN Vehicle Industry Analysis, Insights and Forecast, 2019-2031
- 6.1. Market Analysis, Insights and Forecast - by Vehicle Type
- 6.1.1. Light Commercial Vehicles
- 6.1.2. Medium- and Heavy-duty Commercial Vehicles
- 6.1. Market Analysis, Insights and Forecast - by Vehicle Type
- 7. South America ASEAN Vehicle Industry Analysis, Insights and Forecast, 2019-2031
- 7.1. Market Analysis, Insights and Forecast - by Vehicle Type
- 7.1.1. Light Commercial Vehicles
- 7.1.2. Medium- and Heavy-duty Commercial Vehicles
- 7.1. Market Analysis, Insights and Forecast - by Vehicle Type
- 8. Europe ASEAN Vehicle Industry Analysis, Insights and Forecast, 2019-2031
- 8.1. Market Analysis, Insights and Forecast - by Vehicle Type
- 8.1.1. Light Commercial Vehicles
- 8.1.2. Medium- and Heavy-duty Commercial Vehicles
- 8.1. Market Analysis, Insights and Forecast - by Vehicle Type
- 9. Middle East & Africa ASEAN Vehicle Industry Analysis, Insights and Forecast, 2019-2031
- 9.1. Market Analysis, Insights and Forecast - by Vehicle Type
- 9.1.1. Light Commercial Vehicles
- 9.1.2. Medium- and Heavy-duty Commercial Vehicles
- 9.1. Market Analysis, Insights and Forecast - by Vehicle Type
- 10. Asia Pacific ASEAN Vehicle Industry Analysis, Insights and Forecast, 2019-2031
- 10.1. Market Analysis, Insights and Forecast - by Vehicle Type
- 10.1.1. Light Commercial Vehicles
- 10.1.2. Medium- and Heavy-duty Commercial Vehicles
- 10.1. Market Analysis, Insights and Forecast - by Vehicle Type
- 11. Germany ASEAN Vehicle Industry Analysis, Insights and Forecast, 2019-2031
- 11.1. Market Analysis, Insights and Forecast - By Country/Sub-region
- 11.1.1.
- 12. United Kingdom ASEAN Vehicle Industry Analysis, Insights and Forecast, 2019-2031
- 12.1. Market Analysis, Insights and Forecast - By Country/Sub-region
- 12.1.1.
- 13. France ASEAN Vehicle Industry Analysis, Insights and Forecast, 2019-2031
- 13.1. Market Analysis, Insights and Forecast - By Country/Sub-region
- 13.1.1.
- 14. Spain ASEAN Vehicle Industry Analysis, Insights and Forecast, 2019-2031
- 14.1. Market Analysis, Insights and Forecast - By Country/Sub-region
- 14.1.1.
- 15. Rest of Europe ASEAN Vehicle Industry Analysis, Insights and Forecast, 2019-2031
- 15.1. Market Analysis, Insights and Forecast - By Country/Sub-region
- 15.1.1.
- 16. Competitive Analysis
- 16.1. Global Market Share Analysis 2024
- 16.2. Company Profiles
- 16.2.1 Hino Motors Ltd
- 16.2.1.1. Overview
- 16.2.1.2. Products
- 16.2.1.3. SWOT Analysis
- 16.2.1.4. Recent Developments
- 16.2.1.5. Financials (Based on Availability)
- 16.2.2 Daihatsu Motor Co Ltd
- 16.2.2.1. Overview
- 16.2.2.2. Products
- 16.2.2.3. SWOT Analysis
- 16.2.2.4. Recent Developments
- 16.2.2.5. Financials (Based on Availability)
- 16.2.3 Tata Motors
- 16.2.3.1. Overview
- 16.2.3.2. Products
- 16.2.3.3. SWOT Analysis
- 16.2.3.4. Recent Developments
- 16.2.3.5. Financials (Based on Availability)
- 16.2.4 ISUZU MOTORS LIMITED
- 16.2.4.1. Overview
- 16.2.4.2. Products
- 16.2.4.3. SWOT Analysis
- 16.2.4.4. Recent Developments
- 16.2.4.5. Financials (Based on Availability)
- 16.2.5 Hyundai Motor Company
- 16.2.5.1. Overview
- 16.2.5.2. Products
- 16.2.5.3. SWOT Analysis
- 16.2.5.4. Recent Developments
- 16.2.5.5. Financials (Based on Availability)
- 16.2.6 FCA US LLC
- 16.2.6.1. Overview
- 16.2.6.2. Products
- 16.2.6.3. SWOT Analysis
- 16.2.6.4. Recent Developments
- 16.2.6.5. Financials (Based on Availability)
- 16.2.7 Scania
- 16.2.7.1. Overview
- 16.2.7.2. Products
- 16.2.7.3. SWOT Analysis
- 16.2.7.4. Recent Developments
- 16.2.7.5. Financials (Based on Availability)
- 16.2.8 UD Trucks Corp
- 16.2.8.1. Overview
- 16.2.8.2. Products
- 16.2.8.3. SWOT Analysis
- 16.2.8.4. Recent Developments
- 16.2.8.5. Financials (Based on Availability)
- 16.2.9 IVECO
- 16.2.9.1. Overview
- 16.2.9.2. Products
- 16.2.9.3. SWOT Analysis
- 16.2.9.4. Recent Developments
- 16.2.9.5. Financials (Based on Availability)
- 16.2.10 Honda Motor Co Ltd
- 16.2.10.1. Overview
- 16.2.10.2. Products
- 16.2.10.3. SWOT Analysis
- 16.2.10.4. Recent Developments
- 16.2.10.5. Financials (Based on Availability)
- 16.2.11 MITSUBISHI MOTORS CORPORATION
- 16.2.11.1. Overview
- 16.2.11.2. Products
- 16.2.11.3. SWOT Analysis
- 16.2.11.4. Recent Developments
- 16.2.11.5. Financials (Based on Availability)
- 16.2.12 Ford Motor Company
- 16.2.12.1. Overview
- 16.2.12.2. Products
- 16.2.12.3. SWOT Analysis
- 16.2.12.4. Recent Developments
- 16.2.12.5. Financials (Based on Availability)
- 16.2.1 Hino Motors Ltd
List of Figures
- Figure 1: Global ASEAN Vehicle Industry Revenue Breakdown (Million, %) by Region 2024 & 2032
- Figure 2: Germany ASEAN Vehicle Industry Revenue (Million), by Country 2024 & 2032
- Figure 3: Germany ASEAN Vehicle Industry Revenue Share (%), by Country 2024 & 2032
- Figure 4: United Kingdom ASEAN Vehicle Industry Revenue (Million), by Country 2024 & 2032
- Figure 5: United Kingdom ASEAN Vehicle Industry Revenue Share (%), by Country 2024 & 2032
- Figure 6: France ASEAN Vehicle Industry Revenue (Million), by Country 2024 & 2032
- Figure 7: France ASEAN Vehicle Industry Revenue Share (%), by Country 2024 & 2032
- Figure 8: Spain ASEAN Vehicle Industry Revenue (Million), by Country 2024 & 2032
- Figure 9: Spain ASEAN Vehicle Industry Revenue Share (%), by Country 2024 & 2032
- Figure 10: Rest of Europe ASEAN Vehicle Industry Revenue (Million), by Country 2024 & 2032
- Figure 11: Rest of Europe ASEAN Vehicle Industry Revenue Share (%), by Country 2024 & 2032
- Figure 12: North America ASEAN Vehicle Industry Revenue (Million), by Vehicle Type 2024 & 2032
- Figure 13: North America ASEAN Vehicle Industry Revenue Share (%), by Vehicle Type 2024 & 2032
- Figure 14: North America ASEAN Vehicle Industry Revenue (Million), by Country 2024 & 2032
- Figure 15: North America ASEAN Vehicle Industry Revenue Share (%), by Country 2024 & 2032
- Figure 16: South America ASEAN Vehicle Industry Revenue (Million), by Vehicle Type 2024 & 2032
- Figure 17: South America ASEAN Vehicle Industry Revenue Share (%), by Vehicle Type 2024 & 2032
- Figure 18: South America ASEAN Vehicle Industry Revenue (Million), by Country 2024 & 2032
- Figure 19: South America ASEAN Vehicle Industry Revenue Share (%), by Country 2024 & 2032
- Figure 20: Europe ASEAN Vehicle Industry Revenue (Million), by Vehicle Type 2024 & 2032
- Figure 21: Europe ASEAN Vehicle Industry Revenue Share (%), by Vehicle Type 2024 & 2032
- Figure 22: Europe ASEAN Vehicle Industry Revenue (Million), by Country 2024 & 2032
- Figure 23: Europe ASEAN Vehicle Industry Revenue Share (%), by Country 2024 & 2032
- Figure 24: Middle East & Africa ASEAN Vehicle Industry Revenue (Million), by Vehicle Type 2024 & 2032
- Figure 25: Middle East & Africa ASEAN Vehicle Industry Revenue Share (%), by Vehicle Type 2024 & 2032
- Figure 26: Middle East & Africa ASEAN Vehicle Industry Revenue (Million), by Country 2024 & 2032
- Figure 27: Middle East & Africa ASEAN Vehicle Industry Revenue Share (%), by Country 2024 & 2032
- Figure 28: Asia Pacific ASEAN Vehicle Industry Revenue (Million), by Vehicle Type 2024 & 2032
- Figure 29: Asia Pacific ASEAN Vehicle Industry Revenue Share (%), by Vehicle Type 2024 & 2032
- Figure 30: Asia Pacific ASEAN Vehicle Industry Revenue (Million), by Country 2024 & 2032
- Figure 31: Asia Pacific ASEAN Vehicle Industry Revenue Share (%), by Country 2024 & 2032
List of Tables
- Table 1: Global ASEAN Vehicle Industry Revenue Million Forecast, by Region 2019 & 2032
- Table 2: Global ASEAN Vehicle Industry Revenue Million Forecast, by Vehicle Type 2019 & 2032
- Table 3: Global ASEAN Vehicle Industry Revenue Million Forecast, by Region 2019 & 2032
- Table 4: Global ASEAN Vehicle Industry Revenue Million Forecast, by Country 2019 & 2032
- Table 5: ASEAN Vehicle Industry Revenue (Million) Forecast, by Application 2019 & 2032
- Table 6: Global ASEAN Vehicle Industry Revenue Million Forecast, by Country 2019 & 2032
- Table 7: ASEAN Vehicle Industry Revenue (Million) Forecast, by Application 2019 & 2032
- Table 8: Global ASEAN Vehicle Industry Revenue Million Forecast, by Country 2019 & 2032
- Table 9: ASEAN Vehicle Industry Revenue (Million) Forecast, by Application 2019 & 2032
- Table 10: Global ASEAN Vehicle Industry Revenue Million Forecast, by Country 2019 & 2032
- Table 11: ASEAN Vehicle Industry Revenue (Million) Forecast, by Application 2019 & 2032
- Table 12: Global ASEAN Vehicle Industry Revenue Million Forecast, by Country 2019 & 2032
- Table 13: ASEAN Vehicle Industry Revenue (Million) Forecast, by Application 2019 & 2032
- Table 14: Global ASEAN Vehicle Industry Revenue Million Forecast, by Vehicle Type 2019 & 2032
- Table 15: Global ASEAN Vehicle Industry Revenue Million Forecast, by Country 2019 & 2032
- Table 16: United States ASEAN Vehicle Industry Revenue (Million) Forecast, by Application 2019 & 2032
- Table 17: Canada ASEAN Vehicle Industry Revenue (Million) Forecast, by Application 2019 & 2032
- Table 18: Mexico ASEAN Vehicle Industry Revenue (Million) Forecast, by Application 2019 & 2032
- Table 19: Global ASEAN Vehicle Industry Revenue Million Forecast, by Vehicle Type 2019 & 2032
- Table 20: Global ASEAN Vehicle Industry Revenue Million Forecast, by Country 2019 & 2032
- Table 21: Brazil ASEAN Vehicle Industry Revenue (Million) Forecast, by Application 2019 & 2032
- Table 22: Argentina ASEAN Vehicle Industry Revenue (Million) Forecast, by Application 2019 & 2032
- Table 23: Rest of South America ASEAN Vehicle Industry Revenue (Million) Forecast, by Application 2019 & 2032
- Table 24: Global ASEAN Vehicle Industry Revenue Million Forecast, by Vehicle Type 2019 & 2032
- Table 25: Global ASEAN Vehicle Industry Revenue Million Forecast, by Country 2019 & 2032
- Table 26: United Kingdom ASEAN Vehicle Industry Revenue (Million) Forecast, by Application 2019 & 2032
- Table 27: Germany ASEAN Vehicle Industry Revenue (Million) Forecast, by Application 2019 & 2032
- Table 28: France ASEAN Vehicle Industry Revenue (Million) Forecast, by Application 2019 & 2032
- Table 29: Italy ASEAN Vehicle Industry Revenue (Million) Forecast, by Application 2019 & 2032
- Table 30: Spain ASEAN Vehicle Industry Revenue (Million) Forecast, by Application 2019 & 2032
- Table 31: Russia ASEAN Vehicle Industry Revenue (Million) Forecast, by Application 2019 & 2032
- Table 32: Benelux ASEAN Vehicle Industry Revenue (Million) Forecast, by Application 2019 & 2032
- Table 33: Nordics ASEAN Vehicle Industry Revenue (Million) Forecast, by Application 2019 & 2032
- Table 34: Rest of Europe ASEAN Vehicle Industry Revenue (Million) Forecast, by Application 2019 & 2032
- Table 35: Global ASEAN Vehicle Industry Revenue Million Forecast, by Vehicle Type 2019 & 2032
- Table 36: Global ASEAN Vehicle Industry Revenue Million Forecast, by Country 2019 & 2032
- Table 37: Turkey ASEAN Vehicle Industry Revenue (Million) Forecast, by Application 2019 & 2032
- Table 38: Israel ASEAN Vehicle Industry Revenue (Million) Forecast, by Application 2019 & 2032
- Table 39: GCC ASEAN Vehicle Industry Revenue (Million) Forecast, by Application 2019 & 2032
- Table 40: North Africa ASEAN Vehicle Industry Revenue (Million) Forecast, by Application 2019 & 2032
- Table 41: South Africa ASEAN Vehicle Industry Revenue (Million) Forecast, by Application 2019 & 2032
- Table 42: Rest of Middle East & Africa ASEAN Vehicle Industry Revenue (Million) Forecast, by Application 2019 & 2032
- Table 43: Global ASEAN Vehicle Industry Revenue Million Forecast, by Vehicle Type 2019 & 2032
- Table 44: Global ASEAN Vehicle Industry Revenue Million Forecast, by Country 2019 & 2032
- Table 45: China ASEAN Vehicle Industry Revenue (Million) Forecast, by Application 2019 & 2032
- Table 46: India ASEAN Vehicle Industry Revenue (Million) Forecast, by Application 2019 & 2032
- Table 47: Japan ASEAN Vehicle Industry Revenue (Million) Forecast, by Application 2019 & 2032
- Table 48: South Korea ASEAN Vehicle Industry Revenue (Million) Forecast, by Application 2019 & 2032
- Table 49: ASEAN ASEAN Vehicle Industry Revenue (Million) Forecast, by Application 2019 & 2032
- Table 50: Oceania ASEAN Vehicle Industry Revenue (Million) Forecast, by Application 2019 & 2032
- Table 51: Rest of Asia Pacific ASEAN Vehicle Industry Revenue (Million) Forecast, by Application 2019 & 2032
Frequently Asked Questions
1. What is the projected Compound Annual Growth Rate (CAGR) of the ASEAN Vehicle Industry?
The projected CAGR is approximately 6.97%.
2. Which companies are prominent players in the ASEAN Vehicle Industry?
Key companies in the market include Hino Motors Ltd, Daihatsu Motor Co Ltd, Tata Motors, ISUZU MOTORS LIMITED, Hyundai Motor Company, FCA US LLC, Scania, UD Trucks Corp, IVECO, Honda Motor Co Ltd, MITSUBISHI MOTORS CORPORATION, Ford Motor Company.
3. What are the main segments of the ASEAN Vehicle Industry?
The market segments include Vehicle Type.
4. Can you provide details about the market size?
The market size is estimated to be USD 55.74 Million as of 2022.
5. What are some drivers contributing to market growth?
Technological Advancements In Vehicles Driving Demand; Others.
6. What are the notable trends driving market growth?
The Light Commercial Vehicle Segment Dominates the Market.
7. Are there any restraints impacting market growth?
High Scan Tool Costs to Limit Growth; Others.
8. Can you provide examples of recent developments in the market?
Oct 2022- Energy Absolute PCL revealed that the development of its 100% electric passenger car MINE SPA1 under MINE Mobility was still one of EA's major business plans. The current focus of EA would be on commercial vehicles first, while the MINE SPA1 electric car project would be continued. EA also revealed that it plans to launch a 1-ton electric pickup truck under the brand MINE in Q4/2022.
9. What pricing options are available for accessing the report?
Pricing options include single-user, multi-user, and enterprise licenses priced at USD 3800, USD 4500, and USD 5800 respectively.
10. Is the market size provided in terms of value or volume?
The market size is provided in terms of value, measured in Million.
11. Are there any specific market keywords associated with the report?
Yes, the market keyword associated with the report is "ASEAN Vehicle Industry," which aids in identifying and referencing the specific market segment covered.
12. How do I determine which pricing option suits my needs best?
The pricing options vary based on user requirements and access needs. Individual users may opt for single-user licenses, while businesses requiring broader access may choose multi-user or enterprise licenses for cost-effective access to the report.
13. Are there any additional resources or data provided in the ASEAN Vehicle Industry report?
While the report offers comprehensive insights, it's advisable to review the specific contents or supplementary materials provided to ascertain if additional resources or data are available.
14. How can I stay updated on further developments or reports in the ASEAN Vehicle Industry?
To stay informed about further developments, trends, and reports in the ASEAN Vehicle Industry, consider subscribing to industry newsletters, following relevant companies and organizations, or regularly checking reputable industry news sources and publications.
Methodology
Step 1 - Identification of Relevant Samples Size from Population Database


Step 2 - Approaches for Defining Global Market Size (Value, Volume* & Price*)

Note*: In applicable scenarios
Step 3 - Data Sources
Primary Research
- Web Analytics
- Survey Reports
- Research Institute
- Latest Research Reports
- Opinion Leaders
Secondary Research
- Annual Reports
- White Paper
- Latest Press Release
- Industry Association
- Paid Database
- Investor Presentations

Step 4 - Data Triangulation
Involves using different sources of information in order to increase the validity of a study
These sources are likely to be stakeholders in a program - participants, other researchers, program staff, other community members, and so on.
Then we put all data in single framework & apply various statistical tools to find out the dynamic on the market.
During the analysis stage, feedback from the stakeholder groups would be compared to determine areas of agreement as well as areas of divergence


