

Key Insights
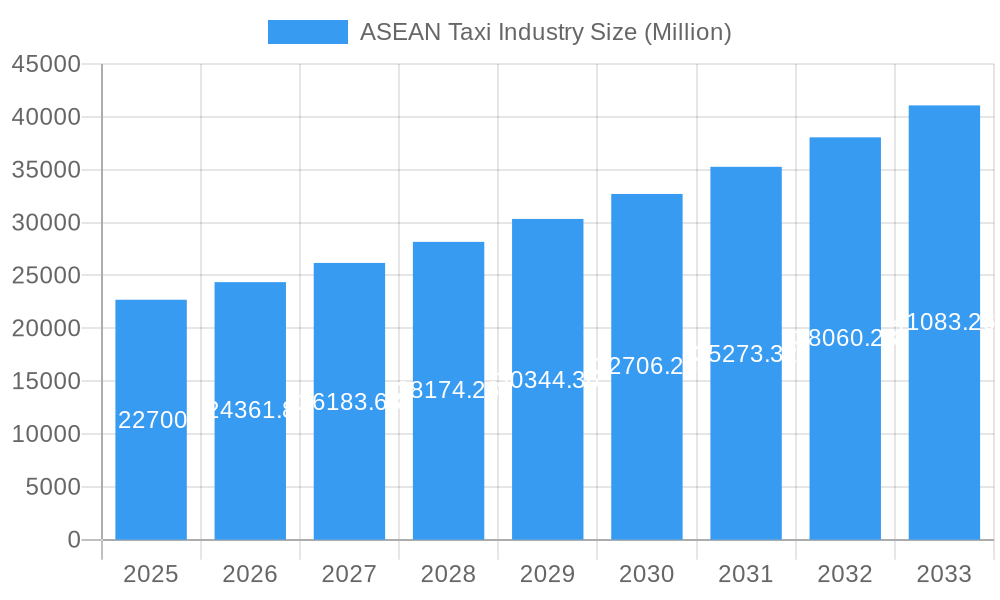
The ASEAN taxi industry, valued at $22.70 billion in 2025, is experiencing robust growth, projected to expand at a Compound Annual Growth Rate (CAGR) of 7.40% from 2025 to 2033. This expansion is fueled by several key drivers. The region's burgeoning middle class, increasing urbanization, and rising smartphone penetration are significantly boosting demand for convenient and affordable transportation options. Furthermore, the increasing adoption of ride-hailing apps like Grab, Gojek, and others, offers users greater accessibility and transparency compared to traditional taxi services. Technological advancements, such as improved GPS navigation and integrated payment systems, further enhance the user experience and drive market growth. However, challenges remain. Regulatory hurdles in some ASEAN countries, fluctuating fuel prices, and intense competition among established players and new entrants pose potential restraints on market expansion. The market is segmented geographically (Philippines, Malaysia, Thailand, Singapore, Rest of ASEAN) and by service type (ride-hailing, ride-sharing), booking type (online, offline), and vehicle type (motorcycles, cars, others). The dominance of ride-hailing services is clear, driven by consumer preference for app-based booking and cashless transactions. While the offline segment continues to exist, its share is likely shrinking due to the convenience and features offered by online platforms. The diverse vehicle types reflect varied consumer needs and preferences across the region, with motorcycles particularly prevalent in some ASEAN countries due to traffic congestion and affordability. The continued growth of the industry hinges on addressing regulatory challenges, technological innovation, and strategic adaptation to evolving consumer demands.
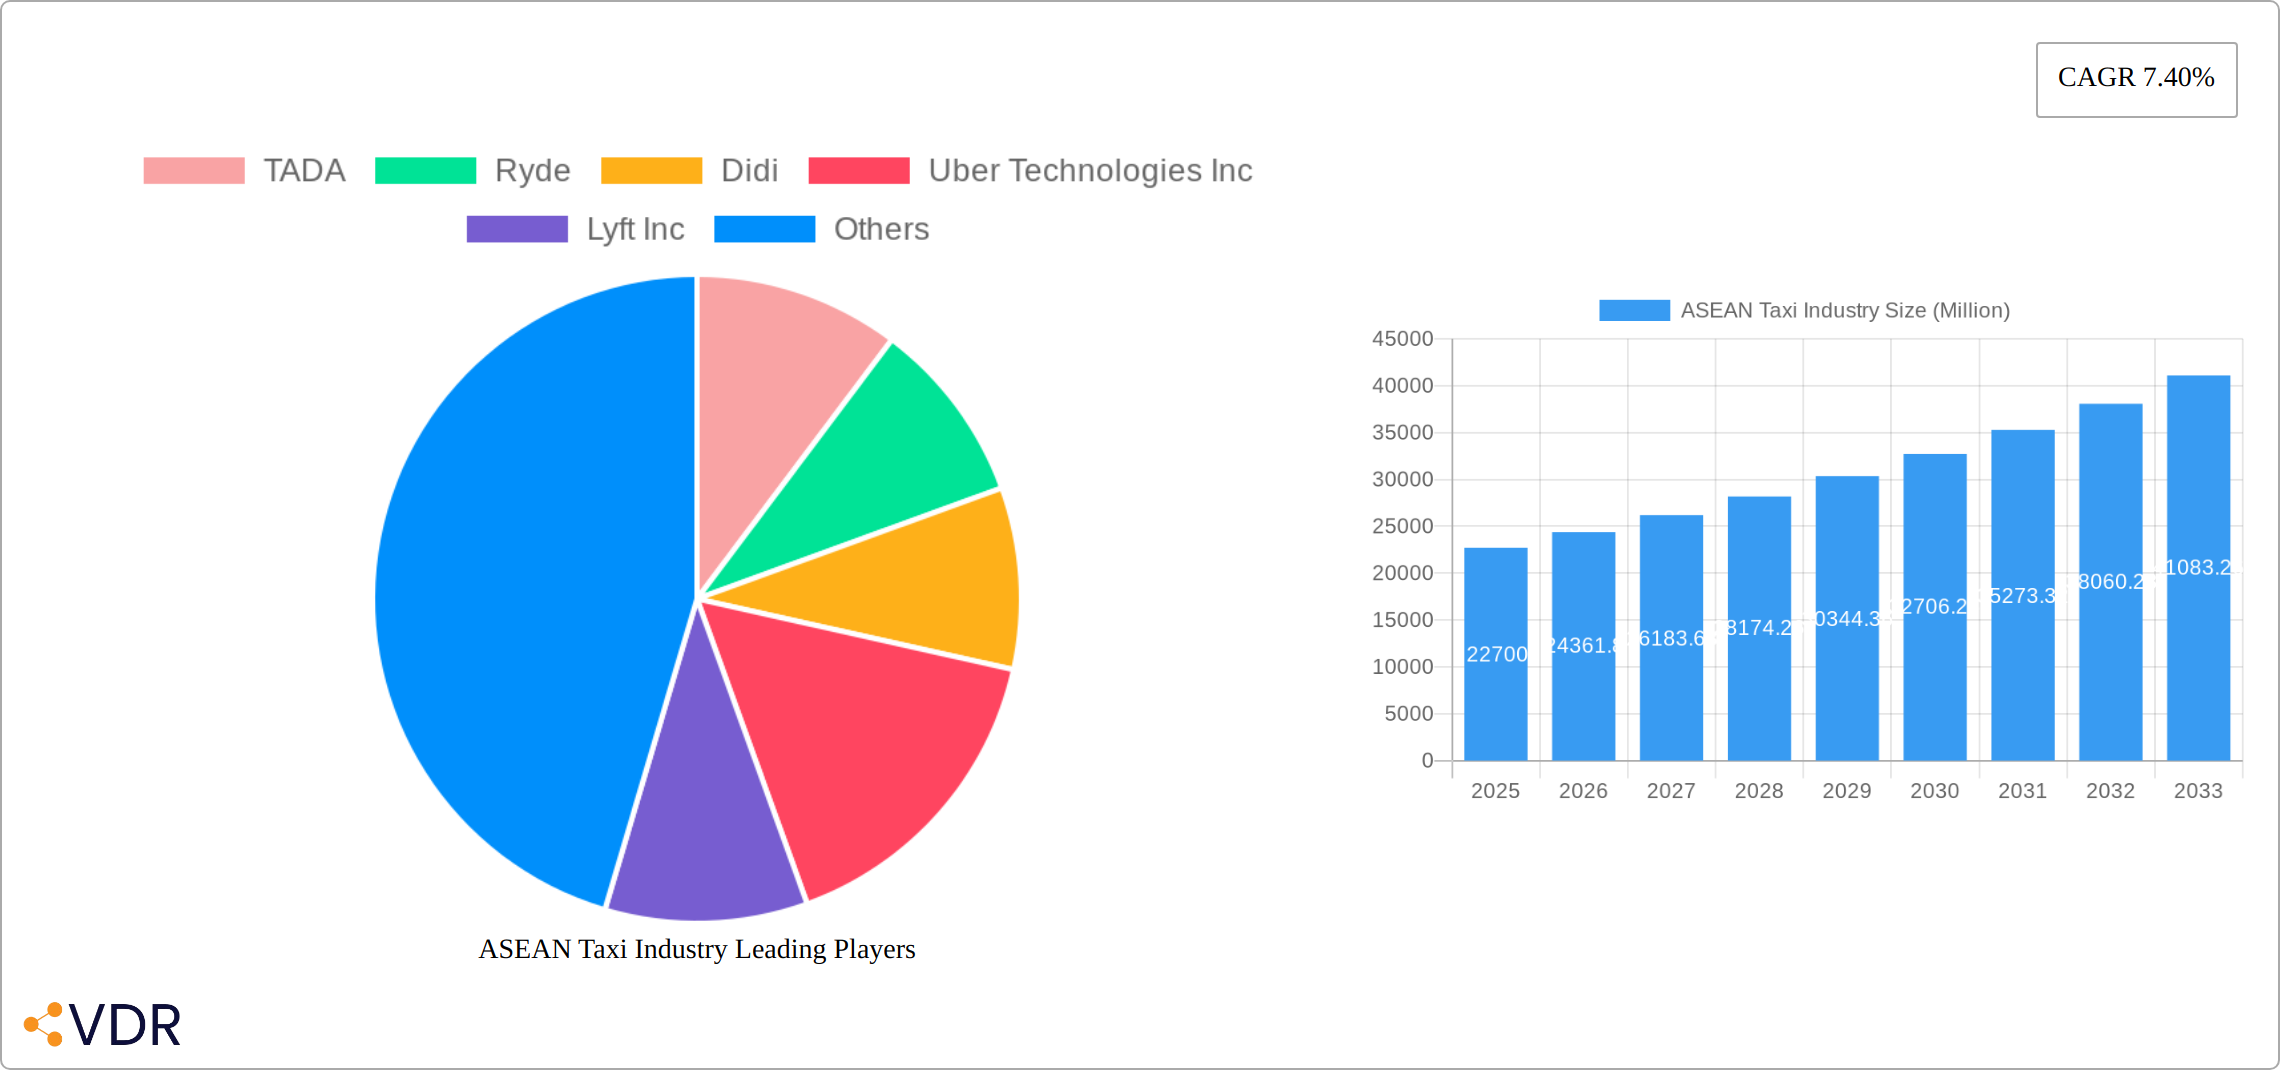
ASEAN Taxi Industry Market Size (In Billion)
The future of the ASEAN taxi industry is promising, with significant growth potential driven by sustained economic development and evolving transportation needs. Continued investment in technology, improved infrastructure, and regulatory frameworks that support both established players and innovative startups will be critical to unlocking the industry’s full potential. Specific focus should be on enhancing safety standards, addressing issues of driver welfare, and promoting sustainable practices, such as the adoption of electric vehicles. Competition will remain fierce, with the potential for consolidation amongst some players. However, the overall market is large enough to accommodate multiple players with differentiated services and offerings catering to niche markets. This makes it an attractive sector for both investors and entrepreneurs looking to capitalize on the growth trajectory of the ASEAN region.
ASEAN Taxi Industry Company Market Share
ASEAN Taxi Industry Market Report: 2019-2033
This comprehensive report provides an in-depth analysis of the burgeoning ASEAN taxi industry, encompassing historical data (2019-2024), current market estimations (2025), and future projections (2025-2033). It delves into market dynamics, growth trends, regional dominance, key players, and emerging opportunities across key segments, offering invaluable insights for industry professionals, investors, and strategic planners. The report uses Million Units (MU) as the unit of measurement for all values.
Keywords: ASEAN Taxi Industry, Ride-Hailing, Ride-Sharing, Grab, Gojek, Uber, Didi, Taxi Market, Southeast Asia, Market Size, Growth Forecast, Online Booking, Offline Booking, Motorcycles, Cars, Philippines, Malaysia, Thailand, Singapore.
ASEAN Taxi Industry Market Dynamics & Structure
This section analyzes the ASEAN taxi market's structure, encompassing market concentration, technological advancements, regulatory landscapes, competitive substitutes, user demographics, and merger & acquisition (M&A) activities. The market is characterized by a high degree of competition, particularly in the ride-hailing segment, dominated by large players like Grab and Gojek. However, smaller players and local operators continue to maintain a presence in specific niches.
- Market Concentration: Grab and Gojek hold a significant market share, with Grab estimated to control xx% and Gojek xx% of the overall market in 2025. The remaining share is distributed among numerous smaller players and traditional taxi services.
- Technological Innovation: Technological advancements, such as GPS tracking, mobile payment integration, and AI-powered dispatch systems, are driving industry growth. However, digital infrastructure limitations in some ASEAN nations pose a barrier to wider adoption.
- Regulatory Frameworks: Varying regulatory frameworks across ASEAN countries present challenges for standardization and seamless operation for both regional and international operators. This includes licensing requirements, fare regulations, and data privacy laws.
- Competitive Substitutes: The rise of private car ownership and the expansion of public transportation networks exert pressure on the taxi market, creating competitive substitutes.
- End-User Demographics: Young professionals and tourists form a significant part of the ride-hailing user base. The increasing smartphone penetration across the region significantly impacts the adoption of online booking platforms.
- M&A Trends: The ASEAN taxi market has seen notable M&A activities, mainly focused on consolidation and expansion. The total M&A deal value in the sector from 2019-2024 is estimated at xx MU.
ASEAN Taxi Industry Growth Trends & Insights
The ASEAN taxi industry experienced significant growth between 2019 and 2024, driven primarily by increased smartphone penetration, rising urbanization, and changing consumer preferences. The market size grew from xx MU in 2019 to xx MU in 2024, exhibiting a CAGR of xx%. This positive trend is projected to continue, with the market size expected to reach xx MU by 2025 and xx MU by 2033. This significant growth is fueled by factors such as rising disposable incomes, increasing tourism, and the expansion of e-commerce and delivery services that heavily rely on transportation networks. The market penetration rate is projected to reach xx% by 2033. Ride-hailing services account for the lion's share of this growth. Technological disruptions, like the introduction of electric vehicles and autonomous driving technology, are poised to reshape the landscape further. Changes in consumer behavior, such as preference for cashless transactions and real-time tracking, are also influential factors shaping industry evolution.
Dominant Regions, Countries, or Segments in ASEAN Taxi Industry
The ASEAN taxi market is a dynamic landscape, with the Philippines, Singapore, and Malaysia consistently emerging as leading players. This dominance is fueled by a confluence of factors: high population densities, robust economic growth, and well-established transportation infrastructures. Within these key markets, the online booking segment undeniably reigns supreme, reflecting a clear consumer shift towards the convenience and digital accessibility offered by ride-hailing apps. However, the traditional taxi sector continues to adapt and innovate, particularly in areas with less developed ride-hailing infrastructure.
- Leading Countries:
- Philippines: Rapid smartphone penetration and a large, densely populated nation create fertile ground for ride-hailing growth. The increasing demand for affordable transportation fuels this expansion.
- Singapore: Singapore's reputation for advanced infrastructure and high per capita income translates into high adoption rates of both ride-hailing and traditional taxi services. The city-state serves as a benchmark for technological integration within the industry.
- Malaysia: Rapid urbanization and the expansion of the middle class have spurred significant demand, creating a competitive market for both traditional and online taxi services. Growth is further fueled by increasing tourism.
- Other Notable Countries: While the Philippines, Singapore, and Malaysia lead, other ASEAN nations show substantial growth potential, albeit at varying paces depending on their individual levels of economic development and technological adoption.
- Dominant Segments:
- Online Booking/Ride-Hailing: The ease of use, transparent pricing, and range of features offered by online booking platforms have driven this segment's market dominance. Ride-hailing apps have fundamentally reshaped consumer expectations and competitive dynamics within the industry.
- Traditional Taxi Services: While facing significant competition, traditional taxi services continue to hold a place in the market, particularly in areas with limited online booking penetration. Adaptation and modernization are vital for their continued relevance.
- Vehicle Types: Cars remain the dominant vehicle type, but the inclusion of motorcycle taxis (particularly in densely populated urban areas) demonstrates the market’s adaptability to local conditions and consumer needs. The emergence of electric vehicles presents a significant opportunity to reduce carbon emissions and improve sustainability.
ASEAN Taxi Industry Product Landscape
The ASEAN taxi industry exhibits diverse product offerings catering to varied customer needs and preferences. Innovations include integrated payment options, real-time tracking, ride-sharing functionalities, and options for diverse vehicle types (cars, motorcycles). Key features are focused on enhancing convenience, safety, and efficiency, such as in-app communication, automated fare calculation, and rating systems. Furthermore, the integration of electric vehicles and the exploration of autonomous driving technologies represent significant product advancements.
Key Drivers, Barriers & Challenges in ASEAN Taxi Industry
Key Drivers:
Rapid urbanization, rising disposable incomes, increased smartphone penetration, and supportive government policies towards transportation innovation are key drivers of growth. The expanding e-commerce sector significantly fuels demand for logistics and delivery services, indirectly bolstering the taxi industry.
Key Challenges:
Regulatory inconsistencies across ASEAN countries create operational complexities. Intense competition, particularly from ride-hailing giants, squeezes profit margins. Moreover, issues like driver welfare, traffic congestion, and environmental concerns remain prominent challenges. The estimated impact of these challenges on market growth is a reduction in CAGR by approximately xx%.
Emerging Opportunities in ASEAN Taxi Industry
The ASEAN taxi industry presents promising opportunities for expansion in underserved areas, the development of specialized services (e.g., luxury ride-hailing, cargo delivery), and the integration of innovative technologies such as electric vehicle fleets and autonomous vehicles. The increasing demand for last-mile delivery solutions and the rise of micro-mobility solutions further enhance growth prospects.
Growth Accelerators in the ASEAN Taxi Industry
Technological advancements such as the introduction of electric and autonomous vehicles and strategic partnerships between taxi companies and other businesses (e.g., e-commerce platforms) will accelerate industry growth. Expanding into less developed markets within ASEAN and creating more niche services tailored to specific demographics will also contribute significantly.
Key Players Shaping the ASEAN Taxi Industry Market
- TADA
- Ryde
- Didi
- Uber Technologies Inc
- Lyft Inc
- Public Cab Sdn Bhd
- PT Gojek
- Blue Cab Malaysi
- Grab Holdings Inc
Notable Milestones in ASEAN Taxi Industry Sector
- 2020: Grab's expansion into food delivery and financial services further solidified its market dominance.
- 2021: Increased investment in electric vehicle fleets by several key players.
- 2022: Introduction of new ride-sharing options emphasizing affordability.
- 2023: Several regulatory changes in various ASEAN countries influencing operational strategies.
- 2024: Significant advancements in integrating AI and machine learning in optimizing dispatch systems and improving customer experience.
In-Depth ASEAN Taxi Industry Market Outlook
The ASEAN taxi industry is poised for sustained growth, driven by continuous technological innovation, expanding digital infrastructure, and evolving consumer preferences. The future will see increased competition and consolidation within the sector, as well as the emergence of new business models centered around sustainability and enhanced customer experiences. Opportunities exist for strategic partnerships and market expansion, particularly in less-penetrated segments and regions. The projected CAGR of xx% for the forecast period (2025-2033) highlights the significant growth potential of the ASEAN taxi market.
ASEAN Taxi Industry Segmentation
-
1. Booking Type
- 1.1. Online
- 1.2. Offline
-
2. Vehicle Type
- 2.1. Motorcycles
- 2.2. Cars
- 2.3. Other Vehicle Types
-
3. Service Type
- 3.1. Ride Hailing
- 3.2. Ride Sharing
ASEAN Taxi Industry Segmentation By Geography
-
1. North America
- 1.1. United States
- 1.2. Canada
- 1.3. Mexico
-
2. South America
- 2.1. Brazil
- 2.2. Argentina
- 2.3. Rest of South America
-
3. Europe
- 3.1. United Kingdom
- 3.2. Germany
- 3.3. France
- 3.4. Italy
- 3.5. Spain
- 3.6. Russia
- 3.7. Benelux
- 3.8. Nordics
- 3.9. Rest of Europe
-
4. Middle East & Africa
- 4.1. Turkey
- 4.2. Israel
- 4.3. GCC
- 4.4. North Africa
- 4.5. South Africa
- 4.6. Rest of Middle East & Africa
-
5. Asia Pacific
- 5.1. China
- 5.2. India
- 5.3. Japan
- 5.4. South Korea
- 5.5. ASEAN
- 5.6. Oceania
- 5.7. Rest of Asia Pacific
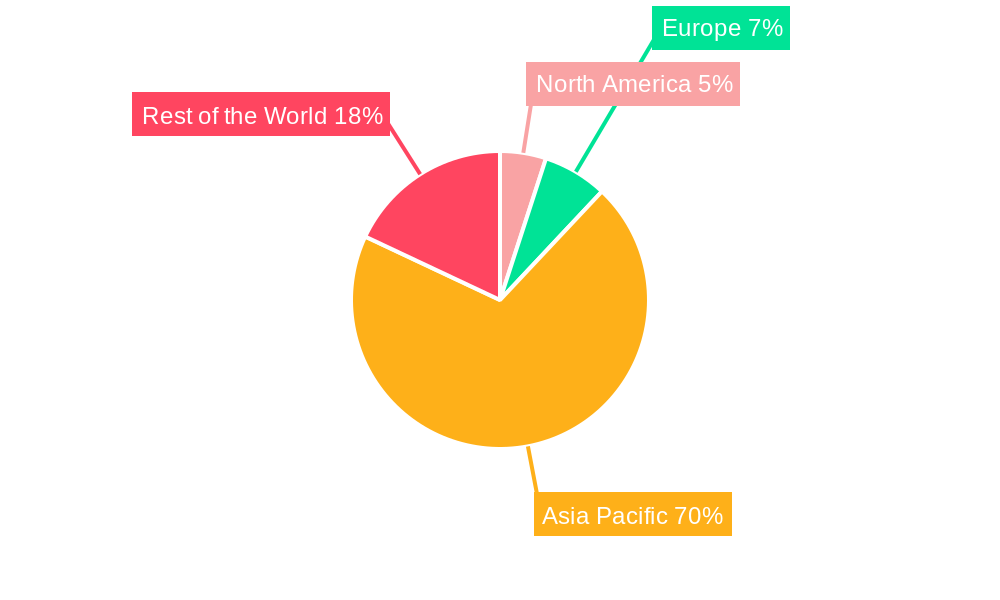
ASEAN Taxi Industry Regional Market Share
Geographic Coverage of ASEAN Taxi Industry
ASEAN Taxi Industry REPORT HIGHLIGHTS
| Aspects | Details |
|---|---|
| Study Period | 2020-2034 |
| Base Year | 2025 |
| Estimated Year | 2026 |
| Forecast Period | 2026-2034 |
| Historical Period | 2020-2025 |
| Growth Rate | CAGR of 7.40% from 2020-2034 |
| Segmentation |
|
Table of Contents
- 1. Introduction
- 1.1. Research Scope
- 1.2. Market Segmentation
- 1.3. Research Methodology
- 1.4. Definitions and Assumptions
- 2. Executive Summary
- 2.1. Introduction
- 3. Market Dynamics
- 3.1. Introduction
- 3.2. Market Drivers
- 3.2.1. Increasing Demand From Online Channel
- 3.3. Market Restrains
- 3.3.1. Increasing Traffic Problems And Reliability Issues
- 3.4. Market Trends
- 3.4.1. Increasing Penetration of Online Channels for Booking Taxis
- 4. Market Factor Analysis
- 4.1. Porters Five Forces
- 4.2. Supply/Value Chain
- 4.3. PESTEL analysis
- 4.4. Market Entropy
- 4.5. Patent/Trademark Analysis
- 5. Global ASEAN Taxi Industry Analysis, Insights and Forecast, 2020-2032
- 5.1. Market Analysis, Insights and Forecast - by Booking Type
- 5.1.1. Online
- 5.1.2. Offline
- 5.2. Market Analysis, Insights and Forecast - by Vehicle Type
- 5.2.1. Motorcycles
- 5.2.2. Cars
- 5.2.3. Other Vehicle Types
- 5.3. Market Analysis, Insights and Forecast - by Service Type
- 5.3.1. Ride Hailing
- 5.3.2. Ride Sharing
- 5.4. Market Analysis, Insights and Forecast - by Region
- 5.4.1. North America
- 5.4.2. South America
- 5.4.3. Europe
- 5.4.4. Middle East & Africa
- 5.4.5. Asia Pacific
- 5.1. Market Analysis, Insights and Forecast - by Booking Type
- 6. North America ASEAN Taxi Industry Analysis, Insights and Forecast, 2020-2032
- 6.1. Market Analysis, Insights and Forecast - by Booking Type
- 6.1.1. Online
- 6.1.2. Offline
- 6.2. Market Analysis, Insights and Forecast - by Vehicle Type
- 6.2.1. Motorcycles
- 6.2.2. Cars
- 6.2.3. Other Vehicle Types
- 6.3. Market Analysis, Insights and Forecast - by Service Type
- 6.3.1. Ride Hailing
- 6.3.2. Ride Sharing
- 6.1. Market Analysis, Insights and Forecast - by Booking Type
- 7. South America ASEAN Taxi Industry Analysis, Insights and Forecast, 2020-2032
- 7.1. Market Analysis, Insights and Forecast - by Booking Type
- 7.1.1. Online
- 7.1.2. Offline
- 7.2. Market Analysis, Insights and Forecast - by Vehicle Type
- 7.2.1. Motorcycles
- 7.2.2. Cars
- 7.2.3. Other Vehicle Types
- 7.3. Market Analysis, Insights and Forecast - by Service Type
- 7.3.1. Ride Hailing
- 7.3.2. Ride Sharing
- 7.1. Market Analysis, Insights and Forecast - by Booking Type
- 8. Europe ASEAN Taxi Industry Analysis, Insights and Forecast, 2020-2032
- 8.1. Market Analysis, Insights and Forecast - by Booking Type
- 8.1.1. Online
- 8.1.2. Offline
- 8.2. Market Analysis, Insights and Forecast - by Vehicle Type
- 8.2.1. Motorcycles
- 8.2.2. Cars
- 8.2.3. Other Vehicle Types
- 8.3. Market Analysis, Insights and Forecast - by Service Type
- 8.3.1. Ride Hailing
- 8.3.2. Ride Sharing
- 8.1. Market Analysis, Insights and Forecast - by Booking Type
- 9. Middle East & Africa ASEAN Taxi Industry Analysis, Insights and Forecast, 2020-2032
- 9.1. Market Analysis, Insights and Forecast - by Booking Type
- 9.1.1. Online
- 9.1.2. Offline
- 9.2. Market Analysis, Insights and Forecast - by Vehicle Type
- 9.2.1. Motorcycles
- 9.2.2. Cars
- 9.2.3. Other Vehicle Types
- 9.3. Market Analysis, Insights and Forecast - by Service Type
- 9.3.1. Ride Hailing
- 9.3.2. Ride Sharing
- 9.1. Market Analysis, Insights and Forecast - by Booking Type
- 10. Asia Pacific ASEAN Taxi Industry Analysis, Insights and Forecast, 2020-2032
- 10.1. Market Analysis, Insights and Forecast - by Booking Type
- 10.1.1. Online
- 10.1.2. Offline
- 10.2. Market Analysis, Insights and Forecast - by Vehicle Type
- 10.2.1. Motorcycles
- 10.2.2. Cars
- 10.2.3. Other Vehicle Types
- 10.3. Market Analysis, Insights and Forecast - by Service Type
- 10.3.1. Ride Hailing
- 10.3.2. Ride Sharing
- 10.1. Market Analysis, Insights and Forecast - by Booking Type
- 11. Competitive Analysis
- 11.1. Global Market Share Analysis 2025
- 11.2. Company Profiles
- 11.2.1 TADA
- 11.2.1.1. Overview
- 11.2.1.2. Products
- 11.2.1.3. SWOT Analysis
- 11.2.1.4. Recent Developments
- 11.2.1.5. Financials (Based on Availability)
- 11.2.2 Ryde
- 11.2.2.1. Overview
- 11.2.2.2. Products
- 11.2.2.3. SWOT Analysis
- 11.2.2.4. Recent Developments
- 11.2.2.5. Financials (Based on Availability)
- 11.2.3 Didi
- 11.2.3.1. Overview
- 11.2.3.2. Products
- 11.2.3.3. SWOT Analysis
- 11.2.3.4. Recent Developments
- 11.2.3.5. Financials (Based on Availability)
- 11.2.4 Uber Technologies Inc
- 11.2.4.1. Overview
- 11.2.4.2. Products
- 11.2.4.3. SWOT Analysis
- 11.2.4.4. Recent Developments
- 11.2.4.5. Financials (Based on Availability)
- 11.2.5 Lyft Inc
- 11.2.5.1. Overview
- 11.2.5.2. Products
- 11.2.5.3. SWOT Analysis
- 11.2.5.4. Recent Developments
- 11.2.5.5. Financials (Based on Availability)
- 11.2.6 Public Cab Sdn Bhd
- 11.2.6.1. Overview
- 11.2.6.2. Products
- 11.2.6.3. SWOT Analysis
- 11.2.6.4. Recent Developments
- 11.2.6.5. Financials (Based on Availability)
- 11.2.7 PT Gojek
- 11.2.7.1. Overview
- 11.2.7.2. Products
- 11.2.7.3. SWOT Analysis
- 11.2.7.4. Recent Developments
- 11.2.7.5. Financials (Based on Availability)
- 11.2.8 Blue Cab Malaysi
- 11.2.8.1. Overview
- 11.2.8.2. Products
- 11.2.8.3. SWOT Analysis
- 11.2.8.4. Recent Developments
- 11.2.8.5. Financials (Based on Availability)
- 11.2.9 Grab Holdings Inc
- 11.2.9.1. Overview
- 11.2.9.2. Products
- 11.2.9.3. SWOT Analysis
- 11.2.9.4. Recent Developments
- 11.2.9.5. Financials (Based on Availability)
- 11.2.1 TADA
List of Figures
- Figure 1: Global ASEAN Taxi Industry Revenue Breakdown (Million, %) by Region 2025 & 2033
- Figure 2: North America ASEAN Taxi Industry Revenue (Million), by Booking Type 2025 & 2033
- Figure 3: North America ASEAN Taxi Industry Revenue Share (%), by Booking Type 2025 & 2033
- Figure 4: North America ASEAN Taxi Industry Revenue (Million), by Vehicle Type 2025 & 2033
- Figure 5: North America ASEAN Taxi Industry Revenue Share (%), by Vehicle Type 2025 & 2033
- Figure 6: North America ASEAN Taxi Industry Revenue (Million), by Service Type 2025 & 2033
- Figure 7: North America ASEAN Taxi Industry Revenue Share (%), by Service Type 2025 & 2033
- Figure 8: North America ASEAN Taxi Industry Revenue (Million), by Country 2025 & 2033
- Figure 9: North America ASEAN Taxi Industry Revenue Share (%), by Country 2025 & 2033
- Figure 10: South America ASEAN Taxi Industry Revenue (Million), by Booking Type 2025 & 2033
- Figure 11: South America ASEAN Taxi Industry Revenue Share (%), by Booking Type 2025 & 2033
- Figure 12: South America ASEAN Taxi Industry Revenue (Million), by Vehicle Type 2025 & 2033
- Figure 13: South America ASEAN Taxi Industry Revenue Share (%), by Vehicle Type 2025 & 2033
- Figure 14: South America ASEAN Taxi Industry Revenue (Million), by Service Type 2025 & 2033
- Figure 15: South America ASEAN Taxi Industry Revenue Share (%), by Service Type 2025 & 2033
- Figure 16: South America ASEAN Taxi Industry Revenue (Million), by Country 2025 & 2033
- Figure 17: South America ASEAN Taxi Industry Revenue Share (%), by Country 2025 & 2033
- Figure 18: Europe ASEAN Taxi Industry Revenue (Million), by Booking Type 2025 & 2033
- Figure 19: Europe ASEAN Taxi Industry Revenue Share (%), by Booking Type 2025 & 2033
- Figure 20: Europe ASEAN Taxi Industry Revenue (Million), by Vehicle Type 2025 & 2033
- Figure 21: Europe ASEAN Taxi Industry Revenue Share (%), by Vehicle Type 2025 & 2033
- Figure 22: Europe ASEAN Taxi Industry Revenue (Million), by Service Type 2025 & 2033
- Figure 23: Europe ASEAN Taxi Industry Revenue Share (%), by Service Type 2025 & 2033
- Figure 24: Europe ASEAN Taxi Industry Revenue (Million), by Country 2025 & 2033
- Figure 25: Europe ASEAN Taxi Industry Revenue Share (%), by Country 2025 & 2033
- Figure 26: Middle East & Africa ASEAN Taxi Industry Revenue (Million), by Booking Type 2025 & 2033
- Figure 27: Middle East & Africa ASEAN Taxi Industry Revenue Share (%), by Booking Type 2025 & 2033
- Figure 28: Middle East & Africa ASEAN Taxi Industry Revenue (Million), by Vehicle Type 2025 & 2033
- Figure 29: Middle East & Africa ASEAN Taxi Industry Revenue Share (%), by Vehicle Type 2025 & 2033
- Figure 30: Middle East & Africa ASEAN Taxi Industry Revenue (Million), by Service Type 2025 & 2033
- Figure 31: Middle East & Africa ASEAN Taxi Industry Revenue Share (%), by Service Type 2025 & 2033
- Figure 32: Middle East & Africa ASEAN Taxi Industry Revenue (Million), by Country 2025 & 2033
- Figure 33: Middle East & Africa ASEAN Taxi Industry Revenue Share (%), by Country 2025 & 2033
- Figure 34: Asia Pacific ASEAN Taxi Industry Revenue (Million), by Booking Type 2025 & 2033
- Figure 35: Asia Pacific ASEAN Taxi Industry Revenue Share (%), by Booking Type 2025 & 2033
- Figure 36: Asia Pacific ASEAN Taxi Industry Revenue (Million), by Vehicle Type 2025 & 2033
- Figure 37: Asia Pacific ASEAN Taxi Industry Revenue Share (%), by Vehicle Type 2025 & 2033
- Figure 38: Asia Pacific ASEAN Taxi Industry Revenue (Million), by Service Type 2025 & 2033
- Figure 39: Asia Pacific ASEAN Taxi Industry Revenue Share (%), by Service Type 2025 & 2033
- Figure 40: Asia Pacific ASEAN Taxi Industry Revenue (Million), by Country 2025 & 2033
- Figure 41: Asia Pacific ASEAN Taxi Industry Revenue Share (%), by Country 2025 & 2033
List of Tables
- Table 1: Global ASEAN Taxi Industry Revenue Million Forecast, by Booking Type 2020 & 2033
- Table 2: Global ASEAN Taxi Industry Revenue Million Forecast, by Vehicle Type 2020 & 2033
- Table 3: Global ASEAN Taxi Industry Revenue Million Forecast, by Service Type 2020 & 2033
- Table 4: Global ASEAN Taxi Industry Revenue Million Forecast, by Region 2020 & 2033
- Table 5: Global ASEAN Taxi Industry Revenue Million Forecast, by Booking Type 2020 & 2033
- Table 6: Global ASEAN Taxi Industry Revenue Million Forecast, by Vehicle Type 2020 & 2033
- Table 7: Global ASEAN Taxi Industry Revenue Million Forecast, by Service Type 2020 & 2033
- Table 8: Global ASEAN Taxi Industry Revenue Million Forecast, by Country 2020 & 2033
- Table 9: United States ASEAN Taxi Industry Revenue (Million) Forecast, by Application 2020 & 2033
- Table 10: Canada ASEAN Taxi Industry Revenue (Million) Forecast, by Application 2020 & 2033
- Table 11: Mexico ASEAN Taxi Industry Revenue (Million) Forecast, by Application 2020 & 2033
- Table 12: Global ASEAN Taxi Industry Revenue Million Forecast, by Booking Type 2020 & 2033
- Table 13: Global ASEAN Taxi Industry Revenue Million Forecast, by Vehicle Type 2020 & 2033
- Table 14: Global ASEAN Taxi Industry Revenue Million Forecast, by Service Type 2020 & 2033
- Table 15: Global ASEAN Taxi Industry Revenue Million Forecast, by Country 2020 & 2033
- Table 16: Brazil ASEAN Taxi Industry Revenue (Million) Forecast, by Application 2020 & 2033
- Table 17: Argentina ASEAN Taxi Industry Revenue (Million) Forecast, by Application 2020 & 2033
- Table 18: Rest of South America ASEAN Taxi Industry Revenue (Million) Forecast, by Application 2020 & 2033
- Table 19: Global ASEAN Taxi Industry Revenue Million Forecast, by Booking Type 2020 & 2033
- Table 20: Global ASEAN Taxi Industry Revenue Million Forecast, by Vehicle Type 2020 & 2033
- Table 21: Global ASEAN Taxi Industry Revenue Million Forecast, by Service Type 2020 & 2033
- Table 22: Global ASEAN Taxi Industry Revenue Million Forecast, by Country 2020 & 2033
- Table 23: United Kingdom ASEAN Taxi Industry Revenue (Million) Forecast, by Application 2020 & 2033
- Table 24: Germany ASEAN Taxi Industry Revenue (Million) Forecast, by Application 2020 & 2033
- Table 25: France ASEAN Taxi Industry Revenue (Million) Forecast, by Application 2020 & 2033
- Table 26: Italy ASEAN Taxi Industry Revenue (Million) Forecast, by Application 2020 & 2033
- Table 27: Spain ASEAN Taxi Industry Revenue (Million) Forecast, by Application 2020 & 2033
- Table 28: Russia ASEAN Taxi Industry Revenue (Million) Forecast, by Application 2020 & 2033
- Table 29: Benelux ASEAN Taxi Industry Revenue (Million) Forecast, by Application 2020 & 2033
- Table 30: Nordics ASEAN Taxi Industry Revenue (Million) Forecast, by Application 2020 & 2033
- Table 31: Rest of Europe ASEAN Taxi Industry Revenue (Million) Forecast, by Application 2020 & 2033
- Table 32: Global ASEAN Taxi Industry Revenue Million Forecast, by Booking Type 2020 & 2033
- Table 33: Global ASEAN Taxi Industry Revenue Million Forecast, by Vehicle Type 2020 & 2033
- Table 34: Global ASEAN Taxi Industry Revenue Million Forecast, by Service Type 2020 & 2033
- Table 35: Global ASEAN Taxi Industry Revenue Million Forecast, by Country 2020 & 2033
- Table 36: Turkey ASEAN Taxi Industry Revenue (Million) Forecast, by Application 2020 & 2033
- Table 37: Israel ASEAN Taxi Industry Revenue (Million) Forecast, by Application 2020 & 2033
- Table 38: GCC ASEAN Taxi Industry Revenue (Million) Forecast, by Application 2020 & 2033
- Table 39: North Africa ASEAN Taxi Industry Revenue (Million) Forecast, by Application 2020 & 2033
- Table 40: South Africa ASEAN Taxi Industry Revenue (Million) Forecast, by Application 2020 & 2033
- Table 41: Rest of Middle East & Africa ASEAN Taxi Industry Revenue (Million) Forecast, by Application 2020 & 2033
- Table 42: Global ASEAN Taxi Industry Revenue Million Forecast, by Booking Type 2020 & 2033
- Table 43: Global ASEAN Taxi Industry Revenue Million Forecast, by Vehicle Type 2020 & 2033
- Table 44: Global ASEAN Taxi Industry Revenue Million Forecast, by Service Type 2020 & 2033
- Table 45: Global ASEAN Taxi Industry Revenue Million Forecast, by Country 2020 & 2033
- Table 46: China ASEAN Taxi Industry Revenue (Million) Forecast, by Application 2020 & 2033
- Table 47: India ASEAN Taxi Industry Revenue (Million) Forecast, by Application 2020 & 2033
- Table 48: Japan ASEAN Taxi Industry Revenue (Million) Forecast, by Application 2020 & 2033
- Table 49: South Korea ASEAN Taxi Industry Revenue (Million) Forecast, by Application 2020 & 2033
- Table 50: ASEAN ASEAN Taxi Industry Revenue (Million) Forecast, by Application 2020 & 2033
- Table 51: Oceania ASEAN Taxi Industry Revenue (Million) Forecast, by Application 2020 & 2033
- Table 52: Rest of Asia Pacific ASEAN Taxi Industry Revenue (Million) Forecast, by Application 2020 & 2033
Frequently Asked Questions
1. What is the projected Compound Annual Growth Rate (CAGR) of the ASEAN Taxi Industry?
The projected CAGR is approximately 7.40%.
2. Which companies are prominent players in the ASEAN Taxi Industry?
Key companies in the market include TADA, Ryde, Didi, Uber Technologies Inc, Lyft Inc, Public Cab Sdn Bhd, PT Gojek, Blue Cab Malaysi, Grab Holdings Inc.
3. What are the main segments of the ASEAN Taxi Industry?
The market segments include Booking Type, Vehicle Type, Service Type.
4. Can you provide details about the market size?
The market size is estimated to be USD 22.70 Million as of 2022.
5. What are some drivers contributing to market growth?
Increasing Demand From Online Channel.
6. What are the notable trends driving market growth?
Increasing Penetration of Online Channels for Booking Taxis.
7. Are there any restraints impacting market growth?
Increasing Traffic Problems And Reliability Issues.
8. Can you provide examples of recent developments in the market?
N/A
9. What pricing options are available for accessing the report?
Pricing options include single-user, multi-user, and enterprise licenses priced at USD 3800, USD 4500, and USD 5800 respectively.
10. Is the market size provided in terms of value or volume?
The market size is provided in terms of value, measured in Million.
11. Are there any specific market keywords associated with the report?
Yes, the market keyword associated with the report is "ASEAN Taxi Industry," which aids in identifying and referencing the specific market segment covered.
12. How do I determine which pricing option suits my needs best?
The pricing options vary based on user requirements and access needs. Individual users may opt for single-user licenses, while businesses requiring broader access may choose multi-user or enterprise licenses for cost-effective access to the report.
13. Are there any additional resources or data provided in the ASEAN Taxi Industry report?
While the report offers comprehensive insights, it's advisable to review the specific contents or supplementary materials provided to ascertain if additional resources or data are available.
14. How can I stay updated on further developments or reports in the ASEAN Taxi Industry?
To stay informed about further developments, trends, and reports in the ASEAN Taxi Industry, consider subscribing to industry newsletters, following relevant companies and organizations, or regularly checking reputable industry news sources and publications.
Methodology
Step 1 - Identification of Relevant Samples Size from Population Database


Step 2 - Approaches for Defining Global Market Size (Value, Volume* & Price*)

Note*: In applicable scenarios
Step 3 - Data Sources
Primary Research
- Web Analytics
- Survey Reports
- Research Institute
- Latest Research Reports
- Opinion Leaders
Secondary Research
- Annual Reports
- White Paper
- Latest Press Release
- Industry Association
- Paid Database
- Investor Presentations

Step 4 - Data Triangulation
Involves using different sources of information in order to increase the validity of a study
These sources are likely to be stakeholders in a program - participants, other researchers, program staff, other community members, and so on.
Then we put all data in single framework & apply various statistical tools to find out the dynamic on the market.
During the analysis stage, feedback from the stakeholder groups would be compared to determine areas of agreement as well as areas of divergence