
Key Insights
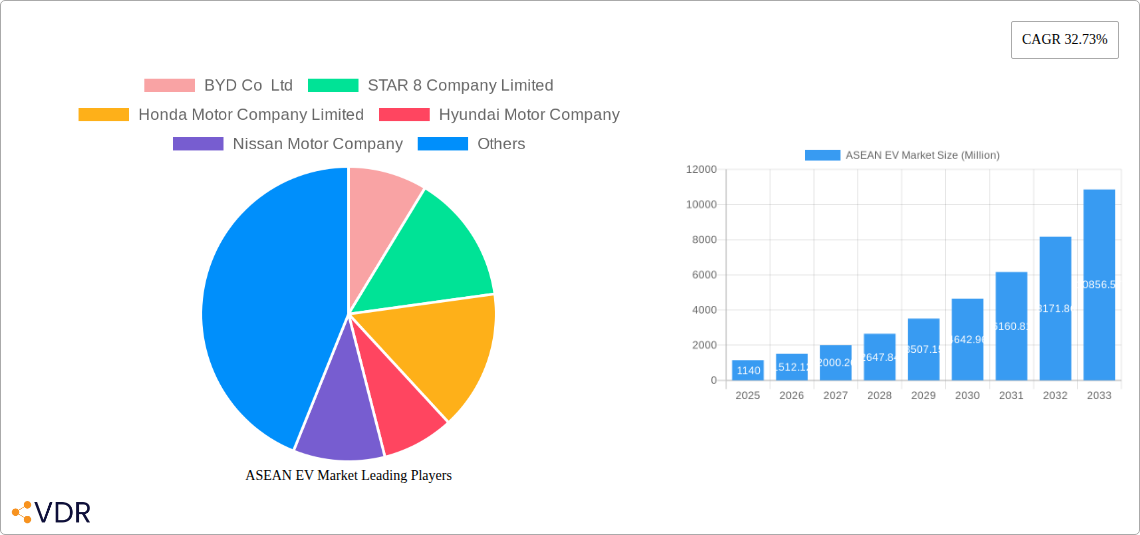
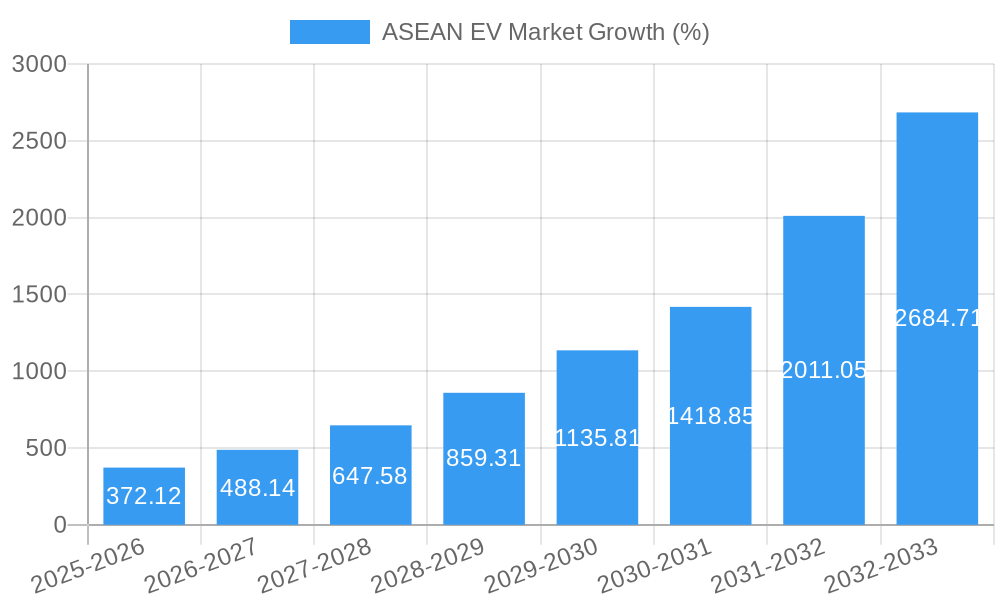
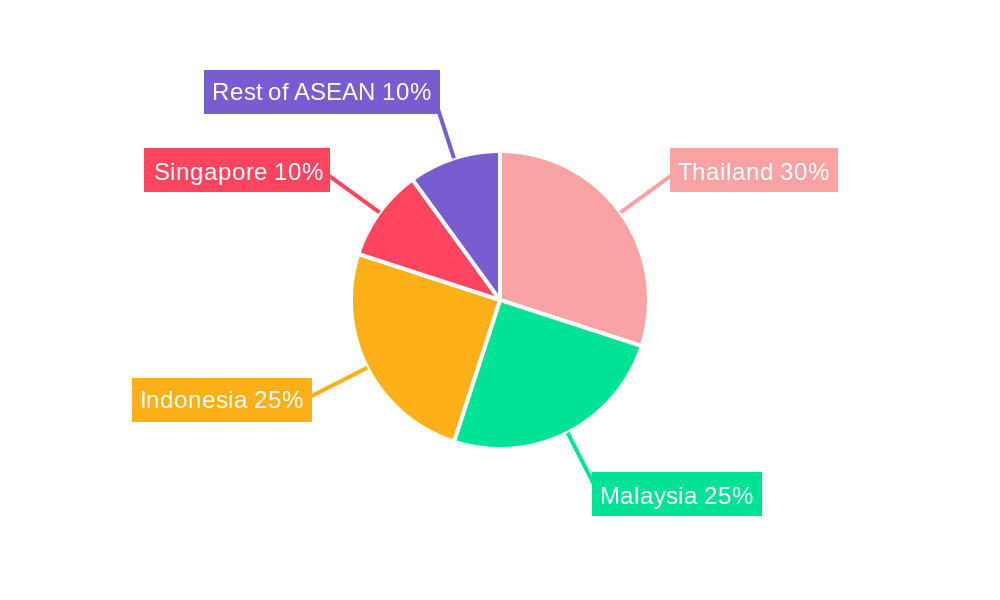
The ASEAN electric vehicle (EV) market is experiencing explosive growth, projected to reach a market size of $1.14 billion in 2025 and exhibiting a Compound Annual Growth Rate (CAGR) of 32.73% from 2025 to 2033. This surge is driven by several factors. Government incentives across the region, aimed at reducing carbon emissions and promoting cleaner transportation, are significantly boosting EV adoption. Furthermore, increasing consumer awareness of environmental concerns and the rising affordability of EVs are fueling demand. Technological advancements leading to improved battery performance, longer driving ranges, and faster charging times are also contributing to market expansion. Within the ASEAN region, Thailand, Indonesia, and Malaysia are expected to be the key growth drivers, owing to their large populations and supportive government policies. The passenger vehicle segment currently dominates, however, the commercial vehicle segment is poised for significant growth in the coming years as fleet operators seek to electrify their operations. Competition is fierce, with established global players like Toyota, Honda, and BMW competing alongside emerging Chinese manufacturers like BYD and local players. The diverse range of vehicle types available, including Battery Electric Vehicles (BEVs), Plug-in Hybrid Electric Vehicles (PHEVs), and Fuel Cell Electric Vehicles (FCEVs), caters to a wide range of consumer preferences and usage patterns. The market's future trajectory is strongly tied to the continued development of charging infrastructure and the resolution of challenges related to battery production and raw material sourcing.
The competitive landscape is dynamic, with both established and emerging automakers vying for market share. While BEVs are currently the most prominent type, the market will likely witness a rise in PHEVs and FCEVs as technology improves and becomes more cost-effective. The success of the ASEAN EV market hinges on overcoming key restraints, including the relatively high initial purchase price of EVs compared to internal combustion engine vehicles (ICEVs), limited charging infrastructure in some areas, and concerns regarding battery lifespan and charging time. Addressing these challenges through government support, private sector investment, and technological innovation is crucial for sustained market growth. The continued expansion of the EV market will reshape the automotive landscape in ASEAN, fostering innovation, creating new job opportunities, and contributing to a more sustainable transportation future.
ASEAN EV Market: A Comprehensive Market Report (2019-2033)
This in-depth report provides a comprehensive analysis of the ASEAN Electric Vehicle (EV) market, encompassing historical data (2019-2024), current estimations (2025), and future forecasts (2025-2033). It delves into market dynamics, growth trends, key players, and emerging opportunities within the parent market (ASEAN automotive sector) and its child markets (Passenger and Commercial Vehicles). This report is crucial for industry professionals, investors, and policymakers seeking to understand and capitalize on the burgeoning EV landscape in Southeast Asia.
ASEAN EV Market Dynamics & Structure
The ASEAN EV market is characterized by increasing market concentration, driven by the entry of major global players and the consolidation of smaller regional companies. Technological innovation, primarily in battery technology and charging infrastructure, is a major driver, while supportive government regulations, particularly in Singapore and Thailand, are accelerating adoption. However, the market faces competition from internal combustion engine (ICE) vehicles and challenges in scaling up EV infrastructure. Mergers and acquisitions (M&A) activity remains relatively low (xx deals in 2024), but is expected to increase as larger players seek to expand their presence and access new technologies.
- Market Concentration: Currently, xx% of the market is dominated by the top 5 players. This is projected to increase to xx% by 2033.
- Technological Innovation: Focus on battery range, charging speed, and cost reduction. Innovation barriers include high R&D costs and supply chain complexities.
- Regulatory Frameworks: Vary across ASEAN countries, with some offering significant incentives (tax breaks, subsidies) while others lag.
- Competitive Substitutes: ICE vehicles continue to dominate, though government policies are aiming to shift the balance.
- End-User Demographics: Primarily urban, affluent consumers, though this is expanding as prices fall and incentives increase.
ASEAN EV Market Growth Trends & Insights
The ASEAN EV market is experiencing rapid expansion, with a projected Compound Annual Growth Rate (CAGR) of xx% from 2025 to 2033. Market size is expected to reach xx million units by 2033, up from xx million units in 2024. This growth is fueled by increasing consumer awareness of environmental concerns, government support for EV adoption, and decreasing battery costs. Technological advancements, such as improved battery technology and fast charging capabilities, are further accelerating market penetration. Consumer behavior shifts are evident, with a growing preference for eco-friendly vehicles amongst younger demographics and urban dwellers. Market penetration is projected to reach xx% by 2033, up from xx% in 2024.
Dominant Regions, Countries, or Segments in ASEAN EV Market
Thailand and Singapore are currently the leading markets in the ASEAN region, driven by strong government support for EV adoption and well-developed infrastructure. The Passenger Vehicle segment dominates the market (xx million units in 2025), outpacing the Commercial Vehicle segment (xx million units in 2025). Battery Electric Vehicles (BEVs) represent the largest share of the EV market (xx%), followed by Plug-in Hybrid Electric Vehicles (PHEVs) (xx%).
- Thailand: Strong government incentives and a robust automotive manufacturing base.
- Singapore: High EV adoption rate fueled by favorable government policies and early mover advantage.
- Indonesia: Significant growth potential due to a large population and increasing economic development. However, infrastructure limitations remain a challenge.
- Passenger Vehicles: Higher demand driven by individual consumer needs.
- Battery Electric Vehicles (BEVs): Technological advancements and cost reductions are driving adoption.
ASEAN EV Market Product Landscape
The ASEAN EV market offers a diverse range of vehicles, from compact city cars to luxury SUVs, catering to various consumer preferences. Key product innovations include improvements in battery technology, increased range, faster charging times, and advanced driver-assistance systems (ADAS). Unique selling propositions often include features like superior acceleration, quiet operation, and reduced running costs. Technological advancements focus on improving efficiency, affordability, and safety.
Key Drivers, Barriers & Challenges in ASEAN EV Market
Key Drivers:
- Government incentives and supportive policies.
- Increasing consumer awareness of environmental issues.
- Technological advancements leading to better performance and lower costs.
- Growing urban populations and traffic congestion.
Key Challenges:
- High upfront cost of EVs compared to ICE vehicles.
- Limited charging infrastructure, particularly outside major cities.
- Range anxiety and charging time concerns amongst consumers.
- Dependence on foreign technology and supply chains. This is estimated to lead to a xx% reduction in EV sales growth annually until supply chain issues are resolved.
Emerging Opportunities in ASEAN EV Market
- Expansion into rural markets and untapped consumer segments.
- Development of innovative business models, such as battery swapping and shared mobility services.
- Growth of the commercial EV sector, including delivery vans and buses.
- Focus on sustainable sourcing of battery materials and responsible EV recycling.
Growth Accelerators in the ASEAN EV Market Industry
Strategic partnerships between automakers and energy companies to develop comprehensive EV ecosystems, coupled with breakthroughs in solid-state battery technology and fast-charging infrastructure, are key growth accelerators. Aggressive market expansion strategies by global players, coupled with increasing government support across ASEAN countries, will significantly shape the market's trajectory in the coming years.
Key Players Shaping the ASEAN EV Market Market
- BYD Co Ltd
- STAR 8 Company Limited
- Honda Motor Company Limited
- Hyundai Motor Company
- Nissan Motor Company
- Tesla Inc
- BMW Group
- MG Motor
- Audi AG
- Toyota Motor Corporation
- BYD Company Limite
- Mitsubishi Motors Corporation
- AB Volvo
Notable Milestones in ASEAN EV Market Sector
- December 2021: BMW Group Asia launched the first-ever BMW iX and new BMW iX3 electric cars in Singapore.
- January 2022: Toyota planned to introduce the BZX4 electric SUV in Thailand and Singapore by the end of 2022.
- March 2022: Volvo launched its electric car C40 in Thailand. The car, imported from China, was priced at 2.75 million baht.
- July 2022: BYD launched the ATTO 3 SUV in Singapore. This EV boasts a 150kW motor, 0-100 km/h acceleration in 7.3 seconds, and a 480 km range.
In-Depth ASEAN EV Market Market Outlook
The ASEAN EV market is poised for sustained growth, driven by favorable government policies, technological advancements, and increasing consumer demand. Strategic partnerships, investments in charging infrastructure, and the expansion of the commercial EV sector will further accelerate market penetration and create significant opportunities for both established players and new entrants. The long-term outlook remains extremely positive, with the market projected to become a major global hub for electric vehicle production and adoption.
ASEAN EV Market Segmentation
-
1. Vehicle Type
- 1.1. Passenger Vehicle
- 1.2. Commercial Vehicle
-
2. Drive Train Technology Type
- 2.1. Battery Electric Vehicle
- 2.2. Plug-in Hybrid Electric Vehicle
- 2.3. Fuel Cell Electric Vehicle
ASEAN EV Market Segmentation By Geography
-
1. North America
- 1.1. United States
- 1.2. Canada
- 1.3. Mexico
-
2. South America
- 2.1. Brazil
- 2.2. Argentina
- 2.3. Rest of South America
-
3. Europe
- 3.1. United Kingdom
- 3.2. Germany
- 3.3. France
- 3.4. Italy
- 3.5. Spain
- 3.6. Russia
- 3.7. Benelux
- 3.8. Nordics
- 3.9. Rest of Europe
-
4. Middle East & Africa
- 4.1. Turkey
- 4.2. Israel
- 4.3. GCC
- 4.4. North Africa
- 4.5. South Africa
- 4.6. Rest of Middle East & Africa
-
5. Asia Pacific
- 5.1. China
- 5.2. India
- 5.3. Japan
- 5.4. South Korea
- 5.5. ASEAN
- 5.6. Oceania
- 5.7. Rest of Asia Pacific
ASEAN EV Market REPORT HIGHLIGHTS
| Aspects | Details |
|---|---|
| Study Period | 2019-2033 |
| Base Year | 2024 |
| Estimated Year | 2025 |
| Forecast Period | 2025-2033 |
| Historical Period | 2019-2024 |
| Growth Rate | CAGR of 32.73% from 2019-2033 |
| Segmentation |
|
Table of Contents
- 1. Introduction
- 1.1. Research Scope
- 1.2. Market Segmentation
- 1.3. Research Methodology
- 1.4. Definitions and Assumptions
- 2. Executive Summary
- 2.1. Introduction
- 3. Market Dynamics
- 3.1. Introduction
- 3.2. Market Drivers
- 3.2.1. Integration With Telematics And Fleet Management Systems; Others
- 3.3. Market Restrains
- 3.3.1. The Initial Costs Associated With Purchasing And Installing ELD Systems is High; Others
- 3.4. Market Trends
- 3.4.1. Battery Electric Vehicle is Dominating the Market
- 4. Market Factor Analysis
- 4.1. Porters Five Forces
- 4.2. Supply/Value Chain
- 4.3. PESTEL analysis
- 4.4. Market Entropy
- 4.5. Patent/Trademark Analysis
- 5. Global ASEAN EV Market Analysis, Insights and Forecast, 2019-2031
- 5.1. Market Analysis, Insights and Forecast - by Vehicle Type
- 5.1.1. Passenger Vehicle
- 5.1.2. Commercial Vehicle
- 5.2. Market Analysis, Insights and Forecast - by Drive Train Technology Type
- 5.2.1. Battery Electric Vehicle
- 5.2.2. Plug-in Hybrid Electric Vehicle
- 5.2.3. Fuel Cell Electric Vehicle
- 5.3. Market Analysis, Insights and Forecast - by Region
- 5.3.1. North America
- 5.3.2. South America
- 5.3.3. Europe
- 5.3.4. Middle East & Africa
- 5.3.5. Asia Pacific
- 5.1. Market Analysis, Insights and Forecast - by Vehicle Type
- 6. North America ASEAN EV Market Analysis, Insights and Forecast, 2019-2031
- 6.1. Market Analysis, Insights and Forecast - by Vehicle Type
- 6.1.1. Passenger Vehicle
- 6.1.2. Commercial Vehicle
- 6.2. Market Analysis, Insights and Forecast - by Drive Train Technology Type
- 6.2.1. Battery Electric Vehicle
- 6.2.2. Plug-in Hybrid Electric Vehicle
- 6.2.3. Fuel Cell Electric Vehicle
- 6.1. Market Analysis, Insights and Forecast - by Vehicle Type
- 7. South America ASEAN EV Market Analysis, Insights and Forecast, 2019-2031
- 7.1. Market Analysis, Insights and Forecast - by Vehicle Type
- 7.1.1. Passenger Vehicle
- 7.1.2. Commercial Vehicle
- 7.2. Market Analysis, Insights and Forecast - by Drive Train Technology Type
- 7.2.1. Battery Electric Vehicle
- 7.2.2. Plug-in Hybrid Electric Vehicle
- 7.2.3. Fuel Cell Electric Vehicle
- 7.1. Market Analysis, Insights and Forecast - by Vehicle Type
- 8. Europe ASEAN EV Market Analysis, Insights and Forecast, 2019-2031
- 8.1. Market Analysis, Insights and Forecast - by Vehicle Type
- 8.1.1. Passenger Vehicle
- 8.1.2. Commercial Vehicle
- 8.2. Market Analysis, Insights and Forecast - by Drive Train Technology Type
- 8.2.1. Battery Electric Vehicle
- 8.2.2. Plug-in Hybrid Electric Vehicle
- 8.2.3. Fuel Cell Electric Vehicle
- 8.1. Market Analysis, Insights and Forecast - by Vehicle Type
- 9. Middle East & Africa ASEAN EV Market Analysis, Insights and Forecast, 2019-2031
- 9.1. Market Analysis, Insights and Forecast - by Vehicle Type
- 9.1.1. Passenger Vehicle
- 9.1.2. Commercial Vehicle
- 9.2. Market Analysis, Insights and Forecast - by Drive Train Technology Type
- 9.2.1. Battery Electric Vehicle
- 9.2.2. Plug-in Hybrid Electric Vehicle
- 9.2.3. Fuel Cell Electric Vehicle
- 9.1. Market Analysis, Insights and Forecast - by Vehicle Type
- 10. Asia Pacific ASEAN EV Market Analysis, Insights and Forecast, 2019-2031
- 10.1. Market Analysis, Insights and Forecast - by Vehicle Type
- 10.1.1. Passenger Vehicle
- 10.1.2. Commercial Vehicle
- 10.2. Market Analysis, Insights and Forecast - by Drive Train Technology Type
- 10.2.1. Battery Electric Vehicle
- 10.2.2. Plug-in Hybrid Electric Vehicle
- 10.2.3. Fuel Cell Electric Vehicle
- 10.1. Market Analysis, Insights and Forecast - by Vehicle Type
- 11. North America ASEAN EV Market Analysis, Insights and Forecast, 2019-2031
- 11.1. Market Analysis, Insights and Forecast - By Country/Sub-region
- 11.1.1 United States
- 11.1.2 Canada
- 11.1.3 Rest of North America
- 12. Europe ASEAN EV Market Analysis, Insights and Forecast, 2019-2031
- 12.1. Market Analysis, Insights and Forecast - By Country/Sub-region
- 12.1.1 Germany
- 12.1.2 United Kingdom
- 12.1.3 France
- 12.1.4 Rest of Europe
- 13. Asia Pacific ASEAN EV Market Analysis, Insights and Forecast, 2019-2031
- 13.1. Market Analysis, Insights and Forecast - By Country/Sub-region
- 13.1.1 India
- 13.1.2 China
- 13.1.3 Japan
- 13.1.4 South Korea
- 13.1.5 Rest of Asia Pacific
- 14. Rest of the World ASEAN EV Market Analysis, Insights and Forecast, 2019-2031
- 14.1. Market Analysis, Insights and Forecast - By Country/Sub-region
- 14.1.1 Brazil
- 14.1.2 Mexico
- 14.1.3 United Arab Emirates
- 14.1.4 Other Countries
- 15. Competitive Analysis
- 15.1. Global Market Share Analysis 2024
- 15.2. Company Profiles
- 15.2.1 BYD Co Ltd
- 15.2.1.1. Overview
- 15.2.1.2. Products
- 15.2.1.3. SWOT Analysis
- 15.2.1.4. Recent Developments
- 15.2.1.5. Financials (Based on Availability)
- 15.2.2 STAR 8 Company Limited
- 15.2.2.1. Overview
- 15.2.2.2. Products
- 15.2.2.3. SWOT Analysis
- 15.2.2.4. Recent Developments
- 15.2.2.5. Financials (Based on Availability)
- 15.2.3 Honda Motor Company Limited
- 15.2.3.1. Overview
- 15.2.3.2. Products
- 15.2.3.3. SWOT Analysis
- 15.2.3.4. Recent Developments
- 15.2.3.5. Financials (Based on Availability)
- 15.2.4 Hyundai Motor Company
- 15.2.4.1. Overview
- 15.2.4.2. Products
- 15.2.4.3. SWOT Analysis
- 15.2.4.4. Recent Developments
- 15.2.4.5. Financials (Based on Availability)
- 15.2.5 Nissan Motor Company
- 15.2.5.1. Overview
- 15.2.5.2. Products
- 15.2.5.3. SWOT Analysis
- 15.2.5.4. Recent Developments
- 15.2.5.5. Financials (Based on Availability)
- 15.2.6 Tesla Inc
- 15.2.6.1. Overview
- 15.2.6.2. Products
- 15.2.6.3. SWOT Analysis
- 15.2.6.4. Recent Developments
- 15.2.6.5. Financials (Based on Availability)
- 15.2.7 BMW Group
- 15.2.7.1. Overview
- 15.2.7.2. Products
- 15.2.7.3. SWOT Analysis
- 15.2.7.4. Recent Developments
- 15.2.7.5. Financials (Based on Availability)
- 15.2.8 MG Motor
- 15.2.8.1. Overview
- 15.2.8.2. Products
- 15.2.8.3. SWOT Analysis
- 15.2.8.4. Recent Developments
- 15.2.8.5. Financials (Based on Availability)
- 15.2.9 Audi AG
- 15.2.9.1. Overview
- 15.2.9.2. Products
- 15.2.9.3. SWOT Analysis
- 15.2.9.4. Recent Developments
- 15.2.9.5. Financials (Based on Availability)
- 15.2.10 Toyota Motor Corporation
- 15.2.10.1. Overview
- 15.2.10.2. Products
- 15.2.10.3. SWOT Analysis
- 15.2.10.4. Recent Developments
- 15.2.10.5. Financials (Based on Availability)
- 15.2.11 BYD Company Limite
- 15.2.11.1. Overview
- 15.2.11.2. Products
- 15.2.11.3. SWOT Analysis
- 15.2.11.4. Recent Developments
- 15.2.11.5. Financials (Based on Availability)
- 15.2.12 Mitsubishi Motors Corporation
- 15.2.12.1. Overview
- 15.2.12.2. Products
- 15.2.12.3. SWOT Analysis
- 15.2.12.4. Recent Developments
- 15.2.12.5. Financials (Based on Availability)
- 15.2.13 AB Volvo
- 15.2.13.1. Overview
- 15.2.13.2. Products
- 15.2.13.3. SWOT Analysis
- 15.2.13.4. Recent Developments
- 15.2.13.5. Financials (Based on Availability)
- 15.2.1 BYD Co Ltd
List of Figures
- Figure 1: Global ASEAN EV Market Revenue Breakdown (Million, %) by Region 2024 & 2032
- Figure 2: North America ASEAN EV Market Revenue (Million), by Country 2024 & 2032
- Figure 3: North America ASEAN EV Market Revenue Share (%), by Country 2024 & 2032
- Figure 4: Europe ASEAN EV Market Revenue (Million), by Country 2024 & 2032
- Figure 5: Europe ASEAN EV Market Revenue Share (%), by Country 2024 & 2032
- Figure 6: Asia Pacific ASEAN EV Market Revenue (Million), by Country 2024 & 2032
- Figure 7: Asia Pacific ASEAN EV Market Revenue Share (%), by Country 2024 & 2032
- Figure 8: Rest of the World ASEAN EV Market Revenue (Million), by Country 2024 & 2032
- Figure 9: Rest of the World ASEAN EV Market Revenue Share (%), by Country 2024 & 2032
- Figure 10: North America ASEAN EV Market Revenue (Million), by Vehicle Type 2024 & 2032
- Figure 11: North America ASEAN EV Market Revenue Share (%), by Vehicle Type 2024 & 2032
- Figure 12: North America ASEAN EV Market Revenue (Million), by Drive Train Technology Type 2024 & 2032
- Figure 13: North America ASEAN EV Market Revenue Share (%), by Drive Train Technology Type 2024 & 2032
- Figure 14: North America ASEAN EV Market Revenue (Million), by Country 2024 & 2032
- Figure 15: North America ASEAN EV Market Revenue Share (%), by Country 2024 & 2032
- Figure 16: South America ASEAN EV Market Revenue (Million), by Vehicle Type 2024 & 2032
- Figure 17: South America ASEAN EV Market Revenue Share (%), by Vehicle Type 2024 & 2032
- Figure 18: South America ASEAN EV Market Revenue (Million), by Drive Train Technology Type 2024 & 2032
- Figure 19: South America ASEAN EV Market Revenue Share (%), by Drive Train Technology Type 2024 & 2032
- Figure 20: South America ASEAN EV Market Revenue (Million), by Country 2024 & 2032
- Figure 21: South America ASEAN EV Market Revenue Share (%), by Country 2024 & 2032
- Figure 22: Europe ASEAN EV Market Revenue (Million), by Vehicle Type 2024 & 2032
- Figure 23: Europe ASEAN EV Market Revenue Share (%), by Vehicle Type 2024 & 2032
- Figure 24: Europe ASEAN EV Market Revenue (Million), by Drive Train Technology Type 2024 & 2032
- Figure 25: Europe ASEAN EV Market Revenue Share (%), by Drive Train Technology Type 2024 & 2032
- Figure 26: Europe ASEAN EV Market Revenue (Million), by Country 2024 & 2032
- Figure 27: Europe ASEAN EV Market Revenue Share (%), by Country 2024 & 2032
- Figure 28: Middle East & Africa ASEAN EV Market Revenue (Million), by Vehicle Type 2024 & 2032
- Figure 29: Middle East & Africa ASEAN EV Market Revenue Share (%), by Vehicle Type 2024 & 2032
- Figure 30: Middle East & Africa ASEAN EV Market Revenue (Million), by Drive Train Technology Type 2024 & 2032
- Figure 31: Middle East & Africa ASEAN EV Market Revenue Share (%), by Drive Train Technology Type 2024 & 2032
- Figure 32: Middle East & Africa ASEAN EV Market Revenue (Million), by Country 2024 & 2032
- Figure 33: Middle East & Africa ASEAN EV Market Revenue Share (%), by Country 2024 & 2032
- Figure 34: Asia Pacific ASEAN EV Market Revenue (Million), by Vehicle Type 2024 & 2032
- Figure 35: Asia Pacific ASEAN EV Market Revenue Share (%), by Vehicle Type 2024 & 2032
- Figure 36: Asia Pacific ASEAN EV Market Revenue (Million), by Drive Train Technology Type 2024 & 2032
- Figure 37: Asia Pacific ASEAN EV Market Revenue Share (%), by Drive Train Technology Type 2024 & 2032
- Figure 38: Asia Pacific ASEAN EV Market Revenue (Million), by Country 2024 & 2032
- Figure 39: Asia Pacific ASEAN EV Market Revenue Share (%), by Country 2024 & 2032
List of Tables
- Table 1: Global ASEAN EV Market Revenue Million Forecast, by Region 2019 & 2032
- Table 2: Global ASEAN EV Market Revenue Million Forecast, by Vehicle Type 2019 & 2032
- Table 3: Global ASEAN EV Market Revenue Million Forecast, by Drive Train Technology Type 2019 & 2032
- Table 4: Global ASEAN EV Market Revenue Million Forecast, by Region 2019 & 2032
- Table 5: Global ASEAN EV Market Revenue Million Forecast, by Country 2019 & 2032
- Table 6: United States ASEAN EV Market Revenue (Million) Forecast, by Application 2019 & 2032
- Table 7: Canada ASEAN EV Market Revenue (Million) Forecast, by Application 2019 & 2032
- Table 8: Rest of North America ASEAN EV Market Revenue (Million) Forecast, by Application 2019 & 2032
- Table 9: Global ASEAN EV Market Revenue Million Forecast, by Country 2019 & 2032
- Table 10: Germany ASEAN EV Market Revenue (Million) Forecast, by Application 2019 & 2032
- Table 11: United Kingdom ASEAN EV Market Revenue (Million) Forecast, by Application 2019 & 2032
- Table 12: France ASEAN EV Market Revenue (Million) Forecast, by Application 2019 & 2032
- Table 13: Rest of Europe ASEAN EV Market Revenue (Million) Forecast, by Application 2019 & 2032
- Table 14: Global ASEAN EV Market Revenue Million Forecast, by Country 2019 & 2032
- Table 15: India ASEAN EV Market Revenue (Million) Forecast, by Application 2019 & 2032
- Table 16: China ASEAN EV Market Revenue (Million) Forecast, by Application 2019 & 2032
- Table 17: Japan ASEAN EV Market Revenue (Million) Forecast, by Application 2019 & 2032
- Table 18: South Korea ASEAN EV Market Revenue (Million) Forecast, by Application 2019 & 2032
- Table 19: Rest of Asia Pacific ASEAN EV Market Revenue (Million) Forecast, by Application 2019 & 2032
- Table 20: Global ASEAN EV Market Revenue Million Forecast, by Country 2019 & 2032
- Table 21: Brazil ASEAN EV Market Revenue (Million) Forecast, by Application 2019 & 2032
- Table 22: Mexico ASEAN EV Market Revenue (Million) Forecast, by Application 2019 & 2032
- Table 23: United Arab Emirates ASEAN EV Market Revenue (Million) Forecast, by Application 2019 & 2032
- Table 24: Other Countries ASEAN EV Market Revenue (Million) Forecast, by Application 2019 & 2032
- Table 25: Global ASEAN EV Market Revenue Million Forecast, by Vehicle Type 2019 & 2032
- Table 26: Global ASEAN EV Market Revenue Million Forecast, by Drive Train Technology Type 2019 & 2032
- Table 27: Global ASEAN EV Market Revenue Million Forecast, by Country 2019 & 2032
- Table 28: United States ASEAN EV Market Revenue (Million) Forecast, by Application 2019 & 2032
- Table 29: Canada ASEAN EV Market Revenue (Million) Forecast, by Application 2019 & 2032
- Table 30: Mexico ASEAN EV Market Revenue (Million) Forecast, by Application 2019 & 2032
- Table 31: Global ASEAN EV Market Revenue Million Forecast, by Vehicle Type 2019 & 2032
- Table 32: Global ASEAN EV Market Revenue Million Forecast, by Drive Train Technology Type 2019 & 2032
- Table 33: Global ASEAN EV Market Revenue Million Forecast, by Country 2019 & 2032
- Table 34: Brazil ASEAN EV Market Revenue (Million) Forecast, by Application 2019 & 2032
- Table 35: Argentina ASEAN EV Market Revenue (Million) Forecast, by Application 2019 & 2032
- Table 36: Rest of South America ASEAN EV Market Revenue (Million) Forecast, by Application 2019 & 2032
- Table 37: Global ASEAN EV Market Revenue Million Forecast, by Vehicle Type 2019 & 2032
- Table 38: Global ASEAN EV Market Revenue Million Forecast, by Drive Train Technology Type 2019 & 2032
- Table 39: Global ASEAN EV Market Revenue Million Forecast, by Country 2019 & 2032
- Table 40: United Kingdom ASEAN EV Market Revenue (Million) Forecast, by Application 2019 & 2032
- Table 41: Germany ASEAN EV Market Revenue (Million) Forecast, by Application 2019 & 2032
- Table 42: France ASEAN EV Market Revenue (Million) Forecast, by Application 2019 & 2032
- Table 43: Italy ASEAN EV Market Revenue (Million) Forecast, by Application 2019 & 2032
- Table 44: Spain ASEAN EV Market Revenue (Million) Forecast, by Application 2019 & 2032
- Table 45: Russia ASEAN EV Market Revenue (Million) Forecast, by Application 2019 & 2032
- Table 46: Benelux ASEAN EV Market Revenue (Million) Forecast, by Application 2019 & 2032
- Table 47: Nordics ASEAN EV Market Revenue (Million) Forecast, by Application 2019 & 2032
- Table 48: Rest of Europe ASEAN EV Market Revenue (Million) Forecast, by Application 2019 & 2032
- Table 49: Global ASEAN EV Market Revenue Million Forecast, by Vehicle Type 2019 & 2032
- Table 50: Global ASEAN EV Market Revenue Million Forecast, by Drive Train Technology Type 2019 & 2032
- Table 51: Global ASEAN EV Market Revenue Million Forecast, by Country 2019 & 2032
- Table 52: Turkey ASEAN EV Market Revenue (Million) Forecast, by Application 2019 & 2032
- Table 53: Israel ASEAN EV Market Revenue (Million) Forecast, by Application 2019 & 2032
- Table 54: GCC ASEAN EV Market Revenue (Million) Forecast, by Application 2019 & 2032
- Table 55: North Africa ASEAN EV Market Revenue (Million) Forecast, by Application 2019 & 2032
- Table 56: South Africa ASEAN EV Market Revenue (Million) Forecast, by Application 2019 & 2032
- Table 57: Rest of Middle East & Africa ASEAN EV Market Revenue (Million) Forecast, by Application 2019 & 2032
- Table 58: Global ASEAN EV Market Revenue Million Forecast, by Vehicle Type 2019 & 2032
- Table 59: Global ASEAN EV Market Revenue Million Forecast, by Drive Train Technology Type 2019 & 2032
- Table 60: Global ASEAN EV Market Revenue Million Forecast, by Country 2019 & 2032
- Table 61: China ASEAN EV Market Revenue (Million) Forecast, by Application 2019 & 2032
- Table 62: India ASEAN EV Market Revenue (Million) Forecast, by Application 2019 & 2032
- Table 63: Japan ASEAN EV Market Revenue (Million) Forecast, by Application 2019 & 2032
- Table 64: South Korea ASEAN EV Market Revenue (Million) Forecast, by Application 2019 & 2032
- Table 65: ASEAN ASEAN EV Market Revenue (Million) Forecast, by Application 2019 & 2032
- Table 66: Oceania ASEAN EV Market Revenue (Million) Forecast, by Application 2019 & 2032
- Table 67: Rest of Asia Pacific ASEAN EV Market Revenue (Million) Forecast, by Application 2019 & 2032
Frequently Asked Questions
1. What is the projected Compound Annual Growth Rate (CAGR) of the ASEAN EV Market?
The projected CAGR is approximately 32.73%.
2. Which companies are prominent players in the ASEAN EV Market?
Key companies in the market include BYD Co Ltd, STAR 8 Company Limited, Honda Motor Company Limited, Hyundai Motor Company, Nissan Motor Company, Tesla Inc, BMW Group, MG Motor, Audi AG, Toyota Motor Corporation, BYD Company Limite, Mitsubishi Motors Corporation, AB Volvo.
3. What are the main segments of the ASEAN EV Market?
The market segments include Vehicle Type, Drive Train Technology Type.
4. Can you provide details about the market size?
The market size is estimated to be USD 1.14 Million as of 2022.
5. What are some drivers contributing to market growth?
Integration With Telematics And Fleet Management Systems; Others.
6. What are the notable trends driving market growth?
Battery Electric Vehicle is Dominating the Market.
7. Are there any restraints impacting market growth?
The Initial Costs Associated With Purchasing And Installing ELD Systems is High; Others.
8. Can you provide examples of recent developments in the market?
July 2022: BYD launched the ATTO 3 SUV in Singapore. The ATTO 3 has a basic 150kW motor that allows it to sprint from 0 to 100 km/h in 7.3 seconds. The EV has a range of 480 km on a single charge.
9. What pricing options are available for accessing the report?
Pricing options include single-user, multi-user, and enterprise licenses priced at USD 3800, USD 4500, and USD 5800 respectively.
10. Is the market size provided in terms of value or volume?
The market size is provided in terms of value, measured in Million.
11. Are there any specific market keywords associated with the report?
Yes, the market keyword associated with the report is "ASEAN EV Market," which aids in identifying and referencing the specific market segment covered.
12. How do I determine which pricing option suits my needs best?
The pricing options vary based on user requirements and access needs. Individual users may opt for single-user licenses, while businesses requiring broader access may choose multi-user or enterprise licenses for cost-effective access to the report.
13. Are there any additional resources or data provided in the ASEAN EV Market report?
While the report offers comprehensive insights, it's advisable to review the specific contents or supplementary materials provided to ascertain if additional resources or data are available.
14. How can I stay updated on further developments or reports in the ASEAN EV Market?
To stay informed about further developments, trends, and reports in the ASEAN EV Market, consider subscribing to industry newsletters, following relevant companies and organizations, or regularly checking reputable industry news sources and publications.
Methodology
Step 1 - Identification of Relevant Samples Size from Population Database


Step 2 - Approaches for Defining Global Market Size (Value, Volume* & Price*)

Note*: In applicable scenarios
Step 3 - Data Sources
Primary Research
- Web Analytics
- Survey Reports
- Research Institute
- Latest Research Reports
- Opinion Leaders
Secondary Research
- Annual Reports
- White Paper
- Latest Press Release
- Industry Association
- Paid Database
- Investor Presentations

Step 4 - Data Triangulation
Involves using different sources of information in order to increase the validity of a study
These sources are likely to be stakeholders in a program - participants, other researchers, program staff, other community members, and so on.
Then we put all data in single framework & apply various statistical tools to find out the dynamic on the market.
During the analysis stage, feedback from the stakeholder groups would be compared to determine areas of agreement as well as areas of divergence


