
Key Insights
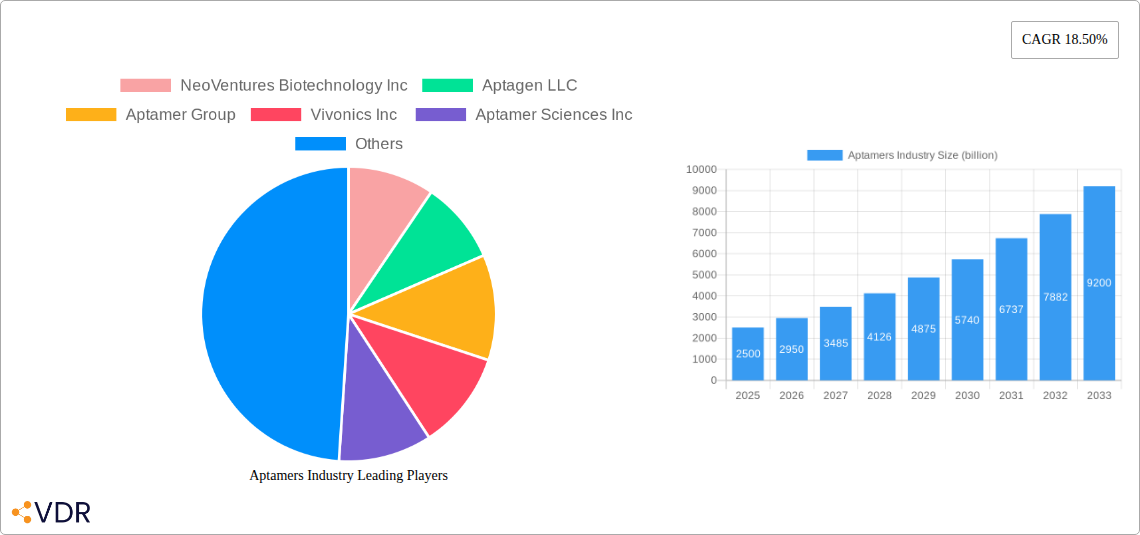
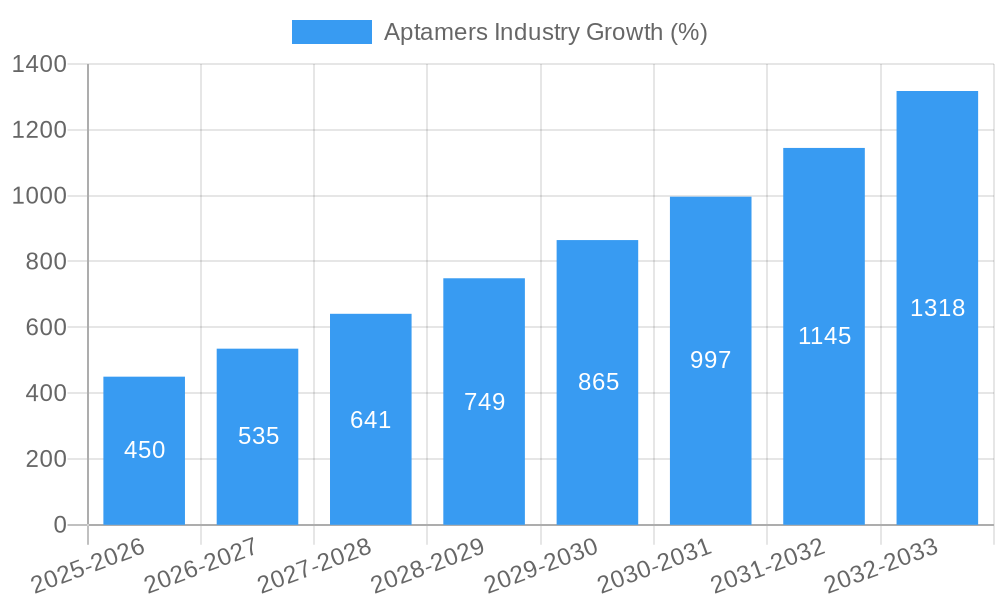
The aptamers market is experiencing robust growth, projected to reach a significant value in the coming years. Driven by advancements in biotechnology and a rising demand for innovative diagnostic and therapeutic solutions, the market is expected to maintain a Compound Annual Growth Rate (CAGR) of 18.50% from 2025 to 2033. This expansion is fueled by several key factors. Firstly, the increasing prevalence of chronic diseases globally necessitates more effective diagnostic and therapeutic tools, creating a significant market opportunity for aptamers. Secondly, aptamers' inherent advantages, such as high specificity, affinity, and ease of modification, make them attractive alternatives to traditional methods. Their potential in personalized medicine further contributes to market growth. The segments driving growth include diagnostic applications, leveraging aptamers' ability to detect specific biomarkers, and therapeutic applications where they are being developed as targeted drug delivery systems and novel therapeutics. Research and development activities are also significant, indicating a strong pipeline of future aptamer-based products. While challenges exist, such as the complexities associated with aptamer production and regulatory approvals, ongoing technological advancements and increased industry investment are mitigating these obstacles, paving the way for sustained market expansion.
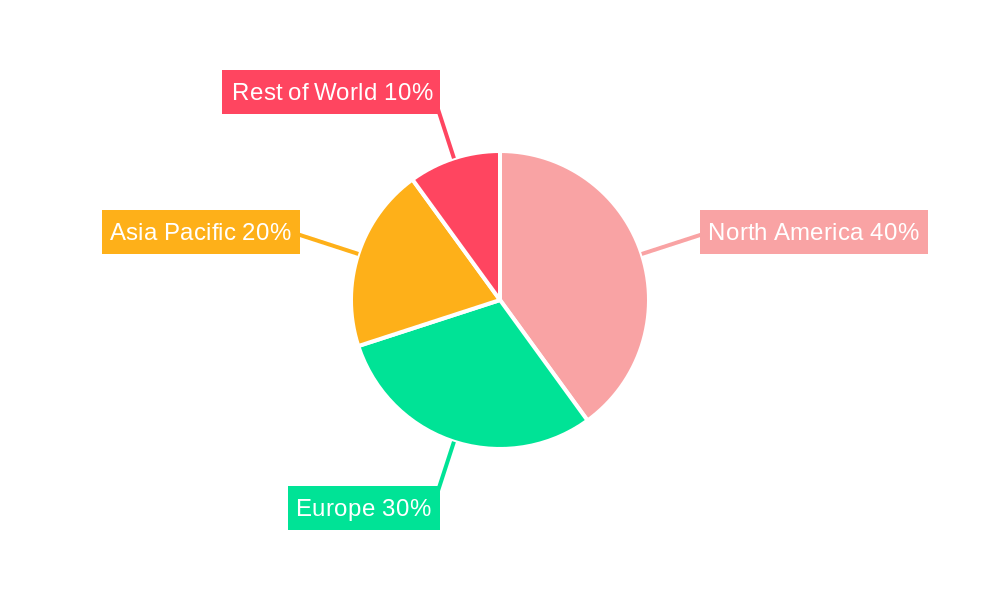
The geographical distribution of the aptamers market reveals a diverse landscape with North America currently holding a substantial market share due to strong technological infrastructure, high research spending, and a large pool of skilled researchers. However, Asia-Pacific is expected to exhibit significant growth, fueled by increasing healthcare expenditure, rising awareness of advanced medical technologies, and expanding research activities in emerging economies. Europe will also maintain a strong presence due to established pharmaceutical sectors and a favorable regulatory environment. The competitive landscape is dynamic, with several key players actively engaged in developing and commercializing aptamer-based products. Companies such as NeoVentures Biotechnology, Aptagen, and Aptamer Sciences are at the forefront of innovation, fostering competition and accelerating market growth. This competitive environment also drives innovation and lowers costs for the benefit of patients and the healthcare systems. The continued exploration of new applications and technological refinements ensures that the aptamers market will remain a vibrant and significant sector within the broader biotechnology landscape for years to come.
Aptamers Industry Market Report: 2019-2033
This comprehensive report provides an in-depth analysis of the Aptamers industry, encompassing market dynamics, growth trends, regional segmentation, product landscape, and key players. With a focus on the parent market of therapeutic and diagnostic tools and the child market of targeted drug delivery, this report offers invaluable insights for industry professionals, investors, and researchers. The study period covers 2019-2033, with 2025 as the base year and a forecast period of 2025-2033. The market size is projected in billion USD.
Aptamers Industry Market Dynamics & Structure
The Aptamers market, valued at $xx billion in 2025, exhibits a moderately concentrated structure with a few major players and numerous smaller companies. Technological innovation, particularly in areas like next-generation sequencing and high-throughput screening, is a significant growth driver. Stringent regulatory frameworks, especially concerning therapeutic applications, present challenges, while the emergence of competitive technologies like antibody-based therapies necessitates continuous innovation. End-user demographics are expanding, driven by increasing demand for personalized medicine and improved diagnostics. M&A activity within the sector remains moderate, with approximately xx deals recorded in the historical period (2019-2024), primarily focused on consolidating smaller firms into larger entities.
- Market Concentration: Moderately concentrated, with a Herfindahl-Hirschman Index (HHI) of xx.
- Innovation Drivers: Next-generation sequencing, high-throughput screening, advancements in aptamer design and engineering.
- Regulatory Framework: Stringent regulatory pathways for therapeutic applications, impacting time-to-market and development costs.
- Competitive Substitutes: Antibodies, small molecule drugs, other diagnostic tools.
- M&A Trends: Moderate activity, with xx deals valued at approximately $xx billion during 2019-2024.
Aptamers Industry Growth Trends & Insights
The Aptamers market demonstrates robust growth, exhibiting a Compound Annual Growth Rate (CAGR) of xx% during the historical period (2019-2024) and is projected to reach $xx billion by 2033. Increased adoption in diagnostics, driven by the need for rapid and point-of-care testing, is a major factor. Technological disruptions, particularly in the area of targeted drug delivery, are significantly accelerating market expansion. Consumer behavior shifts towards personalized and precision medicine further fuel demand. Market penetration in key therapeutic areas remains relatively low, presenting substantial opportunities for growth. The increasing understanding of aptamer functionalities and its ability to address unmet medical needs and diagnostic requirements propels the overall growth.
Dominant Regions, Countries, or Segments in Aptamers Industry
North America currently dominates the Aptamers market, holding a market share of xx% in 2025, fueled by robust research and development investment and a well-established healthcare infrastructure. Within the application segments, the therapeutics segment leads, with a projected market share of xx% in 2025, driven by the successful development and commercialization of aptamer-based drugs. The Nucleic Acid type accounts for the largest segment share.
- North America Dominance: Strong R&D investment, established healthcare infrastructure, favorable regulatory environment.
- Therapeutics Segment Lead: Growing demand for targeted therapies, successful clinical trials, increasing market approval of aptamer-based drugs.
- Nucleic Acid Type: Wide applicability, ease of modification, and cost-effectiveness compared to peptide aptamers.
Aptamers Industry Product Landscape
Aptamers are evolving from simple diagnostic tools to sophisticated therapeutic agents and research reagents. Innovation focuses on enhancing aptamer stability, specificity, and efficacy through chemical modifications and advanced selection techniques. Unique selling propositions include high specificity, low immunogenicity, and ease of modification for targeted delivery. Technological advancements in high-throughput screening and next-generation sequencing are expediting the development process.
Key Drivers, Barriers & Challenges in Aptamers Industry
Key Drivers:
- Growing demand for personalized medicine and point-of-care diagnostics.
- Advancements in aptamer engineering and selection technologies.
- Increasing funding for aptamer-related research and development.
Key Challenges:
- High development costs and time-to-market for therapeutic applications.
- Regulatory hurdles and stringent approval processes.
- Competition from other targeted drug delivery technologies. Limited manufacturing scalability leading to high production costs.
Emerging Opportunities in Aptamers Industry
- Expanding applications in areas like cancer diagnostics, infectious disease detection, and environmental monitoring.
- Development of aptamer-based combination therapies.
- Exploration of novel aptamer delivery systems for enhanced efficacy.
Growth Accelerators in the Aptamers Industry
Technological breakthroughs in aptamer engineering, such as the development of improved selection methods and chemical modifications, are pivotal. Strategic partnerships between pharmaceutical companies and aptamer developers are accelerating clinical development. Market expansion into emerging economies with significant unmet medical needs will significantly increase growth.
Key Players Shaping the Aptamers Industry Market
- NeoVentures Biotechnology Inc
- Aptagen LLC
- Aptamer Group
- Vivonics Inc
- Aptamer Sciences Inc
- Base Pair Biotechnologies Inc
- Baush Health Companies Inc
- NOXXON Pharma
- Aptus Biotech S L
- SomaLogic Inc
- AM Biotechnologies LLC
- Maravai Lifesciences (Trilink Biotechnologies)
Notable Milestones in Aptamers Industry Sector
- 2020: FDA approval of the first aptamer-based therapeutic drug (Example milestone – replace with actual data).
- 2022: Launch of a novel high-throughput screening platform for aptamer discovery (Example milestone – replace with actual data).
- 2023: Major pharmaceutical company announces strategic partnership with an aptamer development company. (Example milestone – replace with actual data).
In-Depth Aptamers Industry Market Outlook
The Aptamers market is poised for significant growth, driven by technological advancements, increased investment in R&D, and the growing demand for personalized medicine and improved diagnostic tools. Strategic partnerships and market expansion into new therapeutic areas and emerging economies will create substantial opportunities for market players. The convergence of aptamers with other technologies, like nanotechnology and artificial intelligence, presents new avenues for innovation and market penetration. The market is expected to surpass $xx billion by 2033.
Aptamers Industry Segmentation
-
1. Type
- 1.1. Nucleic Acid
- 1.2. Peptide
-
2. Application
- 2.1. Diagnostics
- 2.2. Therapeutics
- 2.3. Research and Development
- 2.4. Other Applications
Aptamers Industry Segmentation By Geography
-
1. North America
- 1.1. United States
- 1.2. Canada
- 1.3. Mexico
-
2. Europe
- 2.1. Germany
- 2.2. United Kingdom
- 2.3. France
- 2.4. Italy
- 2.5. Spain
- 2.6. Rest of Europe
-
3. Asia Pacific
- 3.1. China
- 3.2. Japan
- 3.3. India
- 3.4. Australia
- 3.5. South Korea
- 3.6. Rest of Asia Pacific
-
4. Middle East and Africa
- 4.1. GCC
- 4.2. South Africa
- 4.3. Rest of Middle East and Africa
-
5. South America
- 5.1. Brazil
- 5.2. Argentina
- 5.3. Rest of South America
Aptamers Industry REPORT HIGHLIGHTS
| Aspects | Details |
|---|---|
| Study Period | 2019-2033 |
| Base Year | 2024 |
| Estimated Year | 2025 |
| Forecast Period | 2025-2033 |
| Historical Period | 2019-2024 |
| Growth Rate | CAGR of 18.50% from 2019-2033 |
| Segmentation |
|
Table of Contents
- 1. Introduction
- 1.1. Research Scope
- 1.2. Market Segmentation
- 1.3. Research Methodology
- 1.4. Definitions and Assumptions
- 2. Executive Summary
- 2.1. Introduction
- 3. Market Dynamics
- 3.1. Introduction
- 3.2. Market Drivers
- 3.2.1 High Advantage of Aptamers
- 3.2.2 Compared to Antibodies; Advancements in the Field of Aptamer Development Technologies; Growing Investment in the Companies and Research Institutes
- 3.3. Market Restrains
- 3.3.1. Unfavorable Pharmacokinetic Properties of Aptamers; Low Awareness Level and Incomplete Regulatory Policies
- 3.4. Market Trends
- 3.4.1. Diagnostics Segment is Expected to Witness a Healthy Growth Rate Over the Forecast Period
- 4. Market Factor Analysis
- 4.1. Porters Five Forces
- 4.2. Supply/Value Chain
- 4.3. PESTEL analysis
- 4.4. Market Entropy
- 4.5. Patent/Trademark Analysis
- 5. Global Aptamers Industry Analysis, Insights and Forecast, 2019-2031
- 5.1. Market Analysis, Insights and Forecast - by Type
- 5.1.1. Nucleic Acid
- 5.1.2. Peptide
- 5.2. Market Analysis, Insights and Forecast - by Application
- 5.2.1. Diagnostics
- 5.2.2. Therapeutics
- 5.2.3. Research and Development
- 5.2.4. Other Applications
- 5.3. Market Analysis, Insights and Forecast - by Region
- 5.3.1. North America
- 5.3.2. Europe
- 5.3.3. Asia Pacific
- 5.3.4. Middle East and Africa
- 5.3.5. South America
- 5.1. Market Analysis, Insights and Forecast - by Type
- 6. North America Aptamers Industry Analysis, Insights and Forecast, 2019-2031
- 6.1. Market Analysis, Insights and Forecast - by Type
- 6.1.1. Nucleic Acid
- 6.1.2. Peptide
- 6.2. Market Analysis, Insights and Forecast - by Application
- 6.2.1. Diagnostics
- 6.2.2. Therapeutics
- 6.2.3. Research and Development
- 6.2.4. Other Applications
- 6.1. Market Analysis, Insights and Forecast - by Type
- 7. Europe Aptamers Industry Analysis, Insights and Forecast, 2019-2031
- 7.1. Market Analysis, Insights and Forecast - by Type
- 7.1.1. Nucleic Acid
- 7.1.2. Peptide
- 7.2. Market Analysis, Insights and Forecast - by Application
- 7.2.1. Diagnostics
- 7.2.2. Therapeutics
- 7.2.3. Research and Development
- 7.2.4. Other Applications
- 7.1. Market Analysis, Insights and Forecast - by Type
- 8. Asia Pacific Aptamers Industry Analysis, Insights and Forecast, 2019-2031
- 8.1. Market Analysis, Insights and Forecast - by Type
- 8.1.1. Nucleic Acid
- 8.1.2. Peptide
- 8.2. Market Analysis, Insights and Forecast - by Application
- 8.2.1. Diagnostics
- 8.2.2. Therapeutics
- 8.2.3. Research and Development
- 8.2.4. Other Applications
- 8.1. Market Analysis, Insights and Forecast - by Type
- 9. Middle East and Africa Aptamers Industry Analysis, Insights and Forecast, 2019-2031
- 9.1. Market Analysis, Insights and Forecast - by Type
- 9.1.1. Nucleic Acid
- 9.1.2. Peptide
- 9.2. Market Analysis, Insights and Forecast - by Application
- 9.2.1. Diagnostics
- 9.2.2. Therapeutics
- 9.2.3. Research and Development
- 9.2.4. Other Applications
- 9.1. Market Analysis, Insights and Forecast - by Type
- 10. South America Aptamers Industry Analysis, Insights and Forecast, 2019-2031
- 10.1. Market Analysis, Insights and Forecast - by Type
- 10.1.1. Nucleic Acid
- 10.1.2. Peptide
- 10.2. Market Analysis, Insights and Forecast - by Application
- 10.2.1. Diagnostics
- 10.2.2. Therapeutics
- 10.2.3. Research and Development
- 10.2.4. Other Applications
- 10.1. Market Analysis, Insights and Forecast - by Type
- 11. North America Aptamers Industry Analysis, Insights and Forecast, 2019-2031
- 11.1. Market Analysis, Insights and Forecast - By Country/Sub-region
- 11.1.1 United States
- 11.1.2 Canada
- 11.1.3 Mexico
- 12. South America Aptamers Industry Analysis, Insights and Forecast, 2019-2031
- 12.1. Market Analysis, Insights and Forecast - By Country/Sub-region
- 12.1.1 Brazil
- 12.1.2 Mexico
- 12.1.3 Rest of South America
- 13. Europe Aptamers Industry Analysis, Insights and Forecast, 2019-2031
- 13.1. Market Analysis, Insights and Forecast - By Country/Sub-region
- 13.1.1 Germany
- 13.1.2 United Kingdom
- 13.1.3 France
- 13.1.4 Italy
- 13.1.5 Spain
- 13.1.6 Rest of Europe
- 14. Asia Pacific Aptamers Industry Analysis, Insights and Forecast, 2019-2031
- 14.1. Market Analysis, Insights and Forecast - By Country/Sub-region
- 14.1.1 China
- 14.1.2 Japan
- 14.1.3 India
- 14.1.4 South Korea
- 14.1.5 Taiwan
- 14.1.6 Australia
- 14.1.7 Rest of Asia-Pacific
- 15. MEA Aptamers Industry Analysis, Insights and Forecast, 2019-2031
- 15.1. Market Analysis, Insights and Forecast - By Country/Sub-region
- 15.1.1 Middle East
- 15.1.2 Africa
- 16. Competitive Analysis
- 16.1. Global Market Share Analysis 2024
- 16.2. Company Profiles
- 16.2.1 NeoVentures Biotechnology Inc
- 16.2.1.1. Overview
- 16.2.1.2. Products
- 16.2.1.3. SWOT Analysis
- 16.2.1.4. Recent Developments
- 16.2.1.5. Financials (Based on Availability)
- 16.2.2 Aptagen LLC
- 16.2.2.1. Overview
- 16.2.2.2. Products
- 16.2.2.3. SWOT Analysis
- 16.2.2.4. Recent Developments
- 16.2.2.5. Financials (Based on Availability)
- 16.2.3 Aptamer Group
- 16.2.3.1. Overview
- 16.2.3.2. Products
- 16.2.3.3. SWOT Analysis
- 16.2.3.4. Recent Developments
- 16.2.3.5. Financials (Based on Availability)
- 16.2.4 Vivonics Inc
- 16.2.4.1. Overview
- 16.2.4.2. Products
- 16.2.4.3. SWOT Analysis
- 16.2.4.4. Recent Developments
- 16.2.4.5. Financials (Based on Availability)
- 16.2.5 Aptamer Sciences Inc
- 16.2.5.1. Overview
- 16.2.5.2. Products
- 16.2.5.3. SWOT Analysis
- 16.2.5.4. Recent Developments
- 16.2.5.5. Financials (Based on Availability)
- 16.2.6 Base Pair Biotechnologies Inc
- 16.2.6.1. Overview
- 16.2.6.2. Products
- 16.2.6.3. SWOT Analysis
- 16.2.6.4. Recent Developments
- 16.2.6.5. Financials (Based on Availability)
- 16.2.7 Baush Health Companies Inc
- 16.2.7.1. Overview
- 16.2.7.2. Products
- 16.2.7.3. SWOT Analysis
- 16.2.7.4. Recent Developments
- 16.2.7.5. Financials (Based on Availability)
- 16.2.8 NOXXON Pharma
- 16.2.8.1. Overview
- 16.2.8.2. Products
- 16.2.8.3. SWOT Analysis
- 16.2.8.4. Recent Developments
- 16.2.8.5. Financials (Based on Availability)
- 16.2.9 Aptus Biotech S L
- 16.2.9.1. Overview
- 16.2.9.2. Products
- 16.2.9.3. SWOT Analysis
- 16.2.9.4. Recent Developments
- 16.2.9.5. Financials (Based on Availability)
- 16.2.10 SomaLogic Inc
- 16.2.10.1. Overview
- 16.2.10.2. Products
- 16.2.10.3. SWOT Analysis
- 16.2.10.4. Recent Developments
- 16.2.10.5. Financials (Based on Availability)
- 16.2.11 AM Biotechnologies LLC
- 16.2.11.1. Overview
- 16.2.11.2. Products
- 16.2.11.3. SWOT Analysis
- 16.2.11.4. Recent Developments
- 16.2.11.5. Financials (Based on Availability)
- 16.2.12 Maravai Lifesciences (Trilink Biotechnologies)
- 16.2.12.1. Overview
- 16.2.12.2. Products
- 16.2.12.3. SWOT Analysis
- 16.2.12.4. Recent Developments
- 16.2.12.5. Financials (Based on Availability)
- 16.2.1 NeoVentures Biotechnology Inc
List of Figures
- Figure 1: Global Aptamers Industry Revenue Breakdown (billion, %) by Region 2024 & 2032
- Figure 2: Global Aptamers Industry Volume Breakdown (K Tons, %) by Region 2024 & 2032
- Figure 3: North America Aptamers Industry Revenue (billion), by Country 2024 & 2032
- Figure 4: North America Aptamers Industry Volume (K Tons), by Country 2024 & 2032
- Figure 5: North America Aptamers Industry Revenue Share (%), by Country 2024 & 2032
- Figure 6: North America Aptamers Industry Volume Share (%), by Country 2024 & 2032
- Figure 7: South America Aptamers Industry Revenue (billion), by Country 2024 & 2032
- Figure 8: South America Aptamers Industry Volume (K Tons), by Country 2024 & 2032
- Figure 9: South America Aptamers Industry Revenue Share (%), by Country 2024 & 2032
- Figure 10: South America Aptamers Industry Volume Share (%), by Country 2024 & 2032
- Figure 11: Europe Aptamers Industry Revenue (billion), by Country 2024 & 2032
- Figure 12: Europe Aptamers Industry Volume (K Tons), by Country 2024 & 2032
- Figure 13: Europe Aptamers Industry Revenue Share (%), by Country 2024 & 2032
- Figure 14: Europe Aptamers Industry Volume Share (%), by Country 2024 & 2032
- Figure 15: Asia Pacific Aptamers Industry Revenue (billion), by Country 2024 & 2032
- Figure 16: Asia Pacific Aptamers Industry Volume (K Tons), by Country 2024 & 2032
- Figure 17: Asia Pacific Aptamers Industry Revenue Share (%), by Country 2024 & 2032
- Figure 18: Asia Pacific Aptamers Industry Volume Share (%), by Country 2024 & 2032
- Figure 19: MEA Aptamers Industry Revenue (billion), by Country 2024 & 2032
- Figure 20: MEA Aptamers Industry Volume (K Tons), by Country 2024 & 2032
- Figure 21: MEA Aptamers Industry Revenue Share (%), by Country 2024 & 2032
- Figure 22: MEA Aptamers Industry Volume Share (%), by Country 2024 & 2032
- Figure 23: North America Aptamers Industry Revenue (billion), by Type 2024 & 2032
- Figure 24: North America Aptamers Industry Volume (K Tons), by Type 2024 & 2032
- Figure 25: North America Aptamers Industry Revenue Share (%), by Type 2024 & 2032
- Figure 26: North America Aptamers Industry Volume Share (%), by Type 2024 & 2032
- Figure 27: North America Aptamers Industry Revenue (billion), by Application 2024 & 2032
- Figure 28: North America Aptamers Industry Volume (K Tons), by Application 2024 & 2032
- Figure 29: North America Aptamers Industry Revenue Share (%), by Application 2024 & 2032
- Figure 30: North America Aptamers Industry Volume Share (%), by Application 2024 & 2032
- Figure 31: North America Aptamers Industry Revenue (billion), by Country 2024 & 2032
- Figure 32: North America Aptamers Industry Volume (K Tons), by Country 2024 & 2032
- Figure 33: North America Aptamers Industry Revenue Share (%), by Country 2024 & 2032
- Figure 34: North America Aptamers Industry Volume Share (%), by Country 2024 & 2032
- Figure 35: Europe Aptamers Industry Revenue (billion), by Type 2024 & 2032
- Figure 36: Europe Aptamers Industry Volume (K Tons), by Type 2024 & 2032
- Figure 37: Europe Aptamers Industry Revenue Share (%), by Type 2024 & 2032
- Figure 38: Europe Aptamers Industry Volume Share (%), by Type 2024 & 2032
- Figure 39: Europe Aptamers Industry Revenue (billion), by Application 2024 & 2032
- Figure 40: Europe Aptamers Industry Volume (K Tons), by Application 2024 & 2032
- Figure 41: Europe Aptamers Industry Revenue Share (%), by Application 2024 & 2032
- Figure 42: Europe Aptamers Industry Volume Share (%), by Application 2024 & 2032
- Figure 43: Europe Aptamers Industry Revenue (billion), by Country 2024 & 2032
- Figure 44: Europe Aptamers Industry Volume (K Tons), by Country 2024 & 2032
- Figure 45: Europe Aptamers Industry Revenue Share (%), by Country 2024 & 2032
- Figure 46: Europe Aptamers Industry Volume Share (%), by Country 2024 & 2032
- Figure 47: Asia Pacific Aptamers Industry Revenue (billion), by Type 2024 & 2032
- Figure 48: Asia Pacific Aptamers Industry Volume (K Tons), by Type 2024 & 2032
- Figure 49: Asia Pacific Aptamers Industry Revenue Share (%), by Type 2024 & 2032
- Figure 50: Asia Pacific Aptamers Industry Volume Share (%), by Type 2024 & 2032
- Figure 51: Asia Pacific Aptamers Industry Revenue (billion), by Application 2024 & 2032
- Figure 52: Asia Pacific Aptamers Industry Volume (K Tons), by Application 2024 & 2032
- Figure 53: Asia Pacific Aptamers Industry Revenue Share (%), by Application 2024 & 2032
- Figure 54: Asia Pacific Aptamers Industry Volume Share (%), by Application 2024 & 2032
- Figure 55: Asia Pacific Aptamers Industry Revenue (billion), by Country 2024 & 2032
- Figure 56: Asia Pacific Aptamers Industry Volume (K Tons), by Country 2024 & 2032
- Figure 57: Asia Pacific Aptamers Industry Revenue Share (%), by Country 2024 & 2032
- Figure 58: Asia Pacific Aptamers Industry Volume Share (%), by Country 2024 & 2032
- Figure 59: Middle East and Africa Aptamers Industry Revenue (billion), by Type 2024 & 2032
- Figure 60: Middle East and Africa Aptamers Industry Volume (K Tons), by Type 2024 & 2032
- Figure 61: Middle East and Africa Aptamers Industry Revenue Share (%), by Type 2024 & 2032
- Figure 62: Middle East and Africa Aptamers Industry Volume Share (%), by Type 2024 & 2032
- Figure 63: Middle East and Africa Aptamers Industry Revenue (billion), by Application 2024 & 2032
- Figure 64: Middle East and Africa Aptamers Industry Volume (K Tons), by Application 2024 & 2032
- Figure 65: Middle East and Africa Aptamers Industry Revenue Share (%), by Application 2024 & 2032
- Figure 66: Middle East and Africa Aptamers Industry Volume Share (%), by Application 2024 & 2032
- Figure 67: Middle East and Africa Aptamers Industry Revenue (billion), by Country 2024 & 2032
- Figure 68: Middle East and Africa Aptamers Industry Volume (K Tons), by Country 2024 & 2032
- Figure 69: Middle East and Africa Aptamers Industry Revenue Share (%), by Country 2024 & 2032
- Figure 70: Middle East and Africa Aptamers Industry Volume Share (%), by Country 2024 & 2032
- Figure 71: South America Aptamers Industry Revenue (billion), by Type 2024 & 2032
- Figure 72: South America Aptamers Industry Volume (K Tons), by Type 2024 & 2032
- Figure 73: South America Aptamers Industry Revenue Share (%), by Type 2024 & 2032
- Figure 74: South America Aptamers Industry Volume Share (%), by Type 2024 & 2032
- Figure 75: South America Aptamers Industry Revenue (billion), by Application 2024 & 2032
- Figure 76: South America Aptamers Industry Volume (K Tons), by Application 2024 & 2032
- Figure 77: South America Aptamers Industry Revenue Share (%), by Application 2024 & 2032
- Figure 78: South America Aptamers Industry Volume Share (%), by Application 2024 & 2032
- Figure 79: South America Aptamers Industry Revenue (billion), by Country 2024 & 2032
- Figure 80: South America Aptamers Industry Volume (K Tons), by Country 2024 & 2032
- Figure 81: South America Aptamers Industry Revenue Share (%), by Country 2024 & 2032
- Figure 82: South America Aptamers Industry Volume Share (%), by Country 2024 & 2032
List of Tables
- Table 1: Global Aptamers Industry Revenue billion Forecast, by Region 2019 & 2032
- Table 2: Global Aptamers Industry Volume K Tons Forecast, by Region 2019 & 2032
- Table 3: Global Aptamers Industry Revenue billion Forecast, by Type 2019 & 2032
- Table 4: Global Aptamers Industry Volume K Tons Forecast, by Type 2019 & 2032
- Table 5: Global Aptamers Industry Revenue billion Forecast, by Application 2019 & 2032
- Table 6: Global Aptamers Industry Volume K Tons Forecast, by Application 2019 & 2032
- Table 7: Global Aptamers Industry Revenue billion Forecast, by Region 2019 & 2032
- Table 8: Global Aptamers Industry Volume K Tons Forecast, by Region 2019 & 2032
- Table 9: Global Aptamers Industry Revenue billion Forecast, by Country 2019 & 2032
- Table 10: Global Aptamers Industry Volume K Tons Forecast, by Country 2019 & 2032
- Table 11: United States Aptamers Industry Revenue (billion) Forecast, by Application 2019 & 2032
- Table 12: United States Aptamers Industry Volume (K Tons) Forecast, by Application 2019 & 2032
- Table 13: Canada Aptamers Industry Revenue (billion) Forecast, by Application 2019 & 2032
- Table 14: Canada Aptamers Industry Volume (K Tons) Forecast, by Application 2019 & 2032
- Table 15: Mexico Aptamers Industry Revenue (billion) Forecast, by Application 2019 & 2032
- Table 16: Mexico Aptamers Industry Volume (K Tons) Forecast, by Application 2019 & 2032
- Table 17: Global Aptamers Industry Revenue billion Forecast, by Country 2019 & 2032
- Table 18: Global Aptamers Industry Volume K Tons Forecast, by Country 2019 & 2032
- Table 19: Brazil Aptamers Industry Revenue (billion) Forecast, by Application 2019 & 2032
- Table 20: Brazil Aptamers Industry Volume (K Tons) Forecast, by Application 2019 & 2032
- Table 21: Mexico Aptamers Industry Revenue (billion) Forecast, by Application 2019 & 2032
- Table 22: Mexico Aptamers Industry Volume (K Tons) Forecast, by Application 2019 & 2032
- Table 23: Rest of South America Aptamers Industry Revenue (billion) Forecast, by Application 2019 & 2032
- Table 24: Rest of South America Aptamers Industry Volume (K Tons) Forecast, by Application 2019 & 2032
- Table 25: Global Aptamers Industry Revenue billion Forecast, by Country 2019 & 2032
- Table 26: Global Aptamers Industry Volume K Tons Forecast, by Country 2019 & 2032
- Table 27: Germany Aptamers Industry Revenue (billion) Forecast, by Application 2019 & 2032
- Table 28: Germany Aptamers Industry Volume (K Tons) Forecast, by Application 2019 & 2032
- Table 29: United Kingdom Aptamers Industry Revenue (billion) Forecast, by Application 2019 & 2032
- Table 30: United Kingdom Aptamers Industry Volume (K Tons) Forecast, by Application 2019 & 2032
- Table 31: France Aptamers Industry Revenue (billion) Forecast, by Application 2019 & 2032
- Table 32: France Aptamers Industry Volume (K Tons) Forecast, by Application 2019 & 2032
- Table 33: Italy Aptamers Industry Revenue (billion) Forecast, by Application 2019 & 2032
- Table 34: Italy Aptamers Industry Volume (K Tons) Forecast, by Application 2019 & 2032
- Table 35: Spain Aptamers Industry Revenue (billion) Forecast, by Application 2019 & 2032
- Table 36: Spain Aptamers Industry Volume (K Tons) Forecast, by Application 2019 & 2032
- Table 37: Rest of Europe Aptamers Industry Revenue (billion) Forecast, by Application 2019 & 2032
- Table 38: Rest of Europe Aptamers Industry Volume (K Tons) Forecast, by Application 2019 & 2032
- Table 39: Global Aptamers Industry Revenue billion Forecast, by Country 2019 & 2032
- Table 40: Global Aptamers Industry Volume K Tons Forecast, by Country 2019 & 2032
- Table 41: China Aptamers Industry Revenue (billion) Forecast, by Application 2019 & 2032
- Table 42: China Aptamers Industry Volume (K Tons) Forecast, by Application 2019 & 2032
- Table 43: Japan Aptamers Industry Revenue (billion) Forecast, by Application 2019 & 2032
- Table 44: Japan Aptamers Industry Volume (K Tons) Forecast, by Application 2019 & 2032
- Table 45: India Aptamers Industry Revenue (billion) Forecast, by Application 2019 & 2032
- Table 46: India Aptamers Industry Volume (K Tons) Forecast, by Application 2019 & 2032
- Table 47: South Korea Aptamers Industry Revenue (billion) Forecast, by Application 2019 & 2032
- Table 48: South Korea Aptamers Industry Volume (K Tons) Forecast, by Application 2019 & 2032
- Table 49: Taiwan Aptamers Industry Revenue (billion) Forecast, by Application 2019 & 2032
- Table 50: Taiwan Aptamers Industry Volume (K Tons) Forecast, by Application 2019 & 2032
- Table 51: Australia Aptamers Industry Revenue (billion) Forecast, by Application 2019 & 2032
- Table 52: Australia Aptamers Industry Volume (K Tons) Forecast, by Application 2019 & 2032
- Table 53: Rest of Asia-Pacific Aptamers Industry Revenue (billion) Forecast, by Application 2019 & 2032
- Table 54: Rest of Asia-Pacific Aptamers Industry Volume (K Tons) Forecast, by Application 2019 & 2032
- Table 55: Global Aptamers Industry Revenue billion Forecast, by Country 2019 & 2032
- Table 56: Global Aptamers Industry Volume K Tons Forecast, by Country 2019 & 2032
- Table 57: Middle East Aptamers Industry Revenue (billion) Forecast, by Application 2019 & 2032
- Table 58: Middle East Aptamers Industry Volume (K Tons) Forecast, by Application 2019 & 2032
- Table 59: Africa Aptamers Industry Revenue (billion) Forecast, by Application 2019 & 2032
- Table 60: Africa Aptamers Industry Volume (K Tons) Forecast, by Application 2019 & 2032
- Table 61: Global Aptamers Industry Revenue billion Forecast, by Type 2019 & 2032
- Table 62: Global Aptamers Industry Volume K Tons Forecast, by Type 2019 & 2032
- Table 63: Global Aptamers Industry Revenue billion Forecast, by Application 2019 & 2032
- Table 64: Global Aptamers Industry Volume K Tons Forecast, by Application 2019 & 2032
- Table 65: Global Aptamers Industry Revenue billion Forecast, by Country 2019 & 2032
- Table 66: Global Aptamers Industry Volume K Tons Forecast, by Country 2019 & 2032
- Table 67: United States Aptamers Industry Revenue (billion) Forecast, by Application 2019 & 2032
- Table 68: United States Aptamers Industry Volume (K Tons) Forecast, by Application 2019 & 2032
- Table 69: Canada Aptamers Industry Revenue (billion) Forecast, by Application 2019 & 2032
- Table 70: Canada Aptamers Industry Volume (K Tons) Forecast, by Application 2019 & 2032
- Table 71: Mexico Aptamers Industry Revenue (billion) Forecast, by Application 2019 & 2032
- Table 72: Mexico Aptamers Industry Volume (K Tons) Forecast, by Application 2019 & 2032
- Table 73: Global Aptamers Industry Revenue billion Forecast, by Type 2019 & 2032
- Table 74: Global Aptamers Industry Volume K Tons Forecast, by Type 2019 & 2032
- Table 75: Global Aptamers Industry Revenue billion Forecast, by Application 2019 & 2032
- Table 76: Global Aptamers Industry Volume K Tons Forecast, by Application 2019 & 2032
- Table 77: Global Aptamers Industry Revenue billion Forecast, by Country 2019 & 2032
- Table 78: Global Aptamers Industry Volume K Tons Forecast, by Country 2019 & 2032
- Table 79: Germany Aptamers Industry Revenue (billion) Forecast, by Application 2019 & 2032
- Table 80: Germany Aptamers Industry Volume (K Tons) Forecast, by Application 2019 & 2032
- Table 81: United Kingdom Aptamers Industry Revenue (billion) Forecast, by Application 2019 & 2032
- Table 82: United Kingdom Aptamers Industry Volume (K Tons) Forecast, by Application 2019 & 2032
- Table 83: France Aptamers Industry Revenue (billion) Forecast, by Application 2019 & 2032
- Table 84: France Aptamers Industry Volume (K Tons) Forecast, by Application 2019 & 2032
- Table 85: Italy Aptamers Industry Revenue (billion) Forecast, by Application 2019 & 2032
- Table 86: Italy Aptamers Industry Volume (K Tons) Forecast, by Application 2019 & 2032
- Table 87: Spain Aptamers Industry Revenue (billion) Forecast, by Application 2019 & 2032
- Table 88: Spain Aptamers Industry Volume (K Tons) Forecast, by Application 2019 & 2032
- Table 89: Rest of Europe Aptamers Industry Revenue (billion) Forecast, by Application 2019 & 2032
- Table 90: Rest of Europe Aptamers Industry Volume (K Tons) Forecast, by Application 2019 & 2032
- Table 91: Global Aptamers Industry Revenue billion Forecast, by Type 2019 & 2032
- Table 92: Global Aptamers Industry Volume K Tons Forecast, by Type 2019 & 2032
- Table 93: Global Aptamers Industry Revenue billion Forecast, by Application 2019 & 2032
- Table 94: Global Aptamers Industry Volume K Tons Forecast, by Application 2019 & 2032
- Table 95: Global Aptamers Industry Revenue billion Forecast, by Country 2019 & 2032
- Table 96: Global Aptamers Industry Volume K Tons Forecast, by Country 2019 & 2032
- Table 97: China Aptamers Industry Revenue (billion) Forecast, by Application 2019 & 2032
- Table 98: China Aptamers Industry Volume (K Tons) Forecast, by Application 2019 & 2032
- Table 99: Japan Aptamers Industry Revenue (billion) Forecast, by Application 2019 & 2032
- Table 100: Japan Aptamers Industry Volume (K Tons) Forecast, by Application 2019 & 2032
- Table 101: India Aptamers Industry Revenue (billion) Forecast, by Application 2019 & 2032
- Table 102: India Aptamers Industry Volume (K Tons) Forecast, by Application 2019 & 2032
- Table 103: Australia Aptamers Industry Revenue (billion) Forecast, by Application 2019 & 2032
- Table 104: Australia Aptamers Industry Volume (K Tons) Forecast, by Application 2019 & 2032
- Table 105: South Korea Aptamers Industry Revenue (billion) Forecast, by Application 2019 & 2032
- Table 106: South Korea Aptamers Industry Volume (K Tons) Forecast, by Application 2019 & 2032
- Table 107: Rest of Asia Pacific Aptamers Industry Revenue (billion) Forecast, by Application 2019 & 2032
- Table 108: Rest of Asia Pacific Aptamers Industry Volume (K Tons) Forecast, by Application 2019 & 2032
- Table 109: Global Aptamers Industry Revenue billion Forecast, by Type 2019 & 2032
- Table 110: Global Aptamers Industry Volume K Tons Forecast, by Type 2019 & 2032
- Table 111: Global Aptamers Industry Revenue billion Forecast, by Application 2019 & 2032
- Table 112: Global Aptamers Industry Volume K Tons Forecast, by Application 2019 & 2032
- Table 113: Global Aptamers Industry Revenue billion Forecast, by Country 2019 & 2032
- Table 114: Global Aptamers Industry Volume K Tons Forecast, by Country 2019 & 2032
- Table 115: GCC Aptamers Industry Revenue (billion) Forecast, by Application 2019 & 2032
- Table 116: GCC Aptamers Industry Volume (K Tons) Forecast, by Application 2019 & 2032
- Table 117: South Africa Aptamers Industry Revenue (billion) Forecast, by Application 2019 & 2032
- Table 118: South Africa Aptamers Industry Volume (K Tons) Forecast, by Application 2019 & 2032
- Table 119: Rest of Middle East and Africa Aptamers Industry Revenue (billion) Forecast, by Application 2019 & 2032
- Table 120: Rest of Middle East and Africa Aptamers Industry Volume (K Tons) Forecast, by Application 2019 & 2032
- Table 121: Global Aptamers Industry Revenue billion Forecast, by Type 2019 & 2032
- Table 122: Global Aptamers Industry Volume K Tons Forecast, by Type 2019 & 2032
- Table 123: Global Aptamers Industry Revenue billion Forecast, by Application 2019 & 2032
- Table 124: Global Aptamers Industry Volume K Tons Forecast, by Application 2019 & 2032
- Table 125: Global Aptamers Industry Revenue billion Forecast, by Country 2019 & 2032
- Table 126: Global Aptamers Industry Volume K Tons Forecast, by Country 2019 & 2032
- Table 127: Brazil Aptamers Industry Revenue (billion) Forecast, by Application 2019 & 2032
- Table 128: Brazil Aptamers Industry Volume (K Tons) Forecast, by Application 2019 & 2032
- Table 129: Argentina Aptamers Industry Revenue (billion) Forecast, by Application 2019 & 2032
- Table 130: Argentina Aptamers Industry Volume (K Tons) Forecast, by Application 2019 & 2032
- Table 131: Rest of South America Aptamers Industry Revenue (billion) Forecast, by Application 2019 & 2032
- Table 132: Rest of South America Aptamers Industry Volume (K Tons) Forecast, by Application 2019 & 2032
Frequently Asked Questions
1. What is the projected Compound Annual Growth Rate (CAGR) of the Aptamers Industry?
The projected CAGR is approximately 18.50%.
2. Which companies are prominent players in the Aptamers Industry?
Key companies in the market include NeoVentures Biotechnology Inc, Aptagen LLC, Aptamer Group, Vivonics Inc , Aptamer Sciences Inc, Base Pair Biotechnologies Inc, Baush Health Companies Inc, NOXXON Pharma, Aptus Biotech S L, SomaLogic Inc, AM Biotechnologies LLC, Maravai Lifesciences (Trilink Biotechnologies).
3. What are the main segments of the Aptamers Industry?
The market segments include Type, Application.
4. Can you provide details about the market size?
The market size is estimated to be USD XX billion as of 2022.
5. What are some drivers contributing to market growth?
High Advantage of Aptamers. Compared to Antibodies; Advancements in the Field of Aptamer Development Technologies; Growing Investment in the Companies and Research Institutes.
6. What are the notable trends driving market growth?
Diagnostics Segment is Expected to Witness a Healthy Growth Rate Over the Forecast Period.
7. Are there any restraints impacting market growth?
Unfavorable Pharmacokinetic Properties of Aptamers; Low Awareness Level and Incomplete Regulatory Policies.
8. Can you provide examples of recent developments in the market?
N/A
9. What pricing options are available for accessing the report?
Pricing options include single-user, multi-user, and enterprise licenses priced at USD 4750, USD 5250, and USD 8750 respectively.
10. Is the market size provided in terms of value or volume?
The market size is provided in terms of value, measured in billion and volume, measured in K Tons.
11. Are there any specific market keywords associated with the report?
Yes, the market keyword associated with the report is "Aptamers Industry," which aids in identifying and referencing the specific market segment covered.
12. How do I determine which pricing option suits my needs best?
The pricing options vary based on user requirements and access needs. Individual users may opt for single-user licenses, while businesses requiring broader access may choose multi-user or enterprise licenses for cost-effective access to the report.
13. Are there any additional resources or data provided in the Aptamers Industry report?
While the report offers comprehensive insights, it's advisable to review the specific contents or supplementary materials provided to ascertain if additional resources or data are available.
14. How can I stay updated on further developments or reports in the Aptamers Industry?
To stay informed about further developments, trends, and reports in the Aptamers Industry, consider subscribing to industry newsletters, following relevant companies and organizations, or regularly checking reputable industry news sources and publications.
Methodology
Step 1 - Identification of Relevant Samples Size from Population Database


Step 2 - Approaches for Defining Global Market Size (Value, Volume* & Price*)

Note*: In applicable scenarios
Step 3 - Data Sources
Primary Research
- Web Analytics
- Survey Reports
- Research Institute
- Latest Research Reports
- Opinion Leaders
Secondary Research
- Annual Reports
- White Paper
- Latest Press Release
- Industry Association
- Paid Database
- Investor Presentations

Step 4 - Data Triangulation
Involves using different sources of information in order to increase the validity of a study
These sources are likely to be stakeholders in a program - participants, other researchers, program staff, other community members, and so on.
Then we put all data in single framework & apply various statistical tools to find out the dynamic on the market.
During the analysis stage, feedback from the stakeholder groups would be compared to determine areas of agreement as well as areas of divergence


