
Key Insights
The Asia-Pacific (APAC) pressure sensor market is experiencing robust growth, driven by the region's burgeoning automotive, medical, and industrial sectors. A compound annual growth rate (CAGR) of 10.30% from 2019 to 2024 suggests a significant market expansion, likely continuing into the forecast period (2025-2033). The automotive industry, a major driver, is witnessing increased adoption of advanced driver-assistance systems (ADAS) and electronic control units (ECUs), necessitating higher precision and more sophisticated pressure sensors. Similarly, the medical sector's demand for advanced diagnostic and therapeutic equipment, such as CPAP machines and blood pressure monitors, fuels market growth. The industrial sector's automation push and the rise of smart manufacturing further contribute to increased demand. China and India, with their large and rapidly growing economies, are key contributors to the APAC market's expansion, although other countries like Japan and South Korea also present significant opportunities. While challenges such as supply chain disruptions and fluctuating raw material prices might pose some restraints, the overall outlook remains optimistic, with strong growth projected throughout the forecast period. The diverse applications across various sectors ensure sustained demand, and the presence of established international players alongside emerging regional manufacturers fosters competition and innovation, driving technological advancements and further market expansion.
Increased investments in infrastructure development and rising disposable incomes in several APAC countries are accelerating the adoption of pressure sensors across diverse industrial applications, such as process control, HVAC systems, and food and beverage manufacturing. Technological advancements, particularly in miniaturization, improved accuracy, and enhanced durability, are further enhancing the appeal of pressure sensors. The integration of pressure sensors with IoT devices and cloud-based platforms is opening up new avenues for data-driven decision-making and predictive maintenance, particularly within industrial settings. Competitive pricing strategies by both established and emerging players are making the technology more accessible, further fueling market expansion. The continued focus on research and development efforts, leading to the development of more efficient and cost-effective sensor technologies, is another positive factor influencing the market's growth trajectory. This creates an environment where pressure sensor technology is becoming increasingly integrated into a wide variety of products and processes, solidifying its position as a crucial component across multiple industries.
APAC Pressure Sensors Market: A Comprehensive Report (2019-2033)
This comprehensive report provides a detailed analysis of the Asia-Pacific (APAC) pressure sensors market, covering the period 2019-2033. It delves into market dynamics, growth trends, dominant segments, and key players, offering valuable insights for industry professionals, investors, and strategic decision-makers. The report segments the market by application (automotive, medical, consumer electronics, industrial, aerospace & defense, food & beverage, HVAC) and by country (China, India, Japan, South Korea, Rest of Asia Pacific). The market size is valued in million units.
APAC Pressure Sensors Market Dynamics & Structure
The APAC pressure sensor market is characterized by moderate concentration, with several multinational corporations and regional players vying for market share. Technological advancements, particularly in miniaturization, improved accuracy, and wireless capabilities, are key drivers. Stringent regulatory frameworks concerning safety and performance standards, especially in automotive and medical applications, influence market growth. Competitive substitutes, such as alternative sensing technologies, present challenges. The end-user demographics are diverse, with automotive and industrial sectors accounting for significant portions of the demand. Mergers and acquisitions (M&A) activity has been moderate, with strategic partnerships being more prevalent.
- Market Concentration: Moderately concentrated, with a few major players holding significant market share (estimated at xx%).
- Technological Innovation: Driving growth through miniaturization, enhanced accuracy, and wireless connectivity.
- Regulatory Frameworks: Influence market dynamics and product development, particularly in regulated sectors like automotive and medical.
- Competitive Substitutes: Present a challenge, requiring continuous innovation and differentiation.
- End-User Demographics: Highly diverse, with automotive and industrial sectors dominating.
- M&A Trends: Moderate M&A activity, with strategic alliances and partnerships becoming more common (xx deals in the past 5 years).
APAC Pressure Sensors Market Growth Trends & Insights
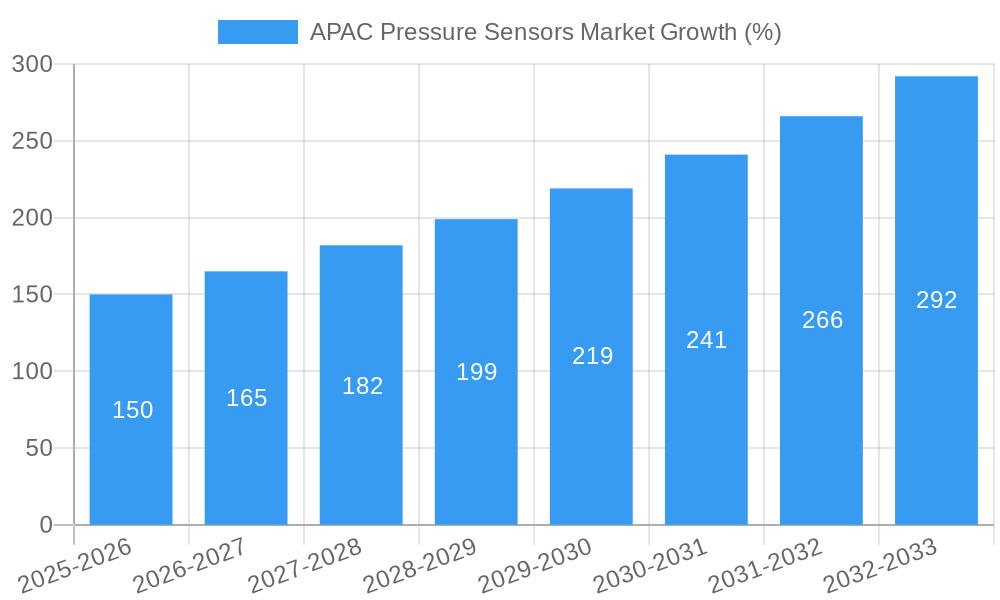
The APAC pressure sensor market experienced significant growth during the historical period (2019-2024), driven by expanding industrialization, automotive production, and advancements in healthcare technology. The market is projected to maintain a healthy CAGR of xx% during the forecast period (2025-2033). Increased adoption of pressure sensors in various applications, technological disruptions leading to improved sensor performance, and shifts in consumer preferences towards sophisticated electronics are key factors driving market expansion. Market penetration varies significantly across different applications and countries, with higher penetration in developed economies compared to developing nations.
- Market Size Evolution: Steady growth from xx million units in 2019 to xx million units in 2024, projected to reach xx million units by 2033.
- CAGR: xx% during the forecast period (2025-2033).
- Market Penetration: High in developed economies, with potential for significant growth in developing countries.
- Technological Disruptions: Miniaturization, improved accuracy, and wireless technologies are transforming the market landscape.
- Consumer Behavior Shifts: Increasing demand for sophisticated electronics and advanced healthcare solutions drives market growth.
Dominant Regions, Countries, or Segments in APAC Pressure Sensors Market
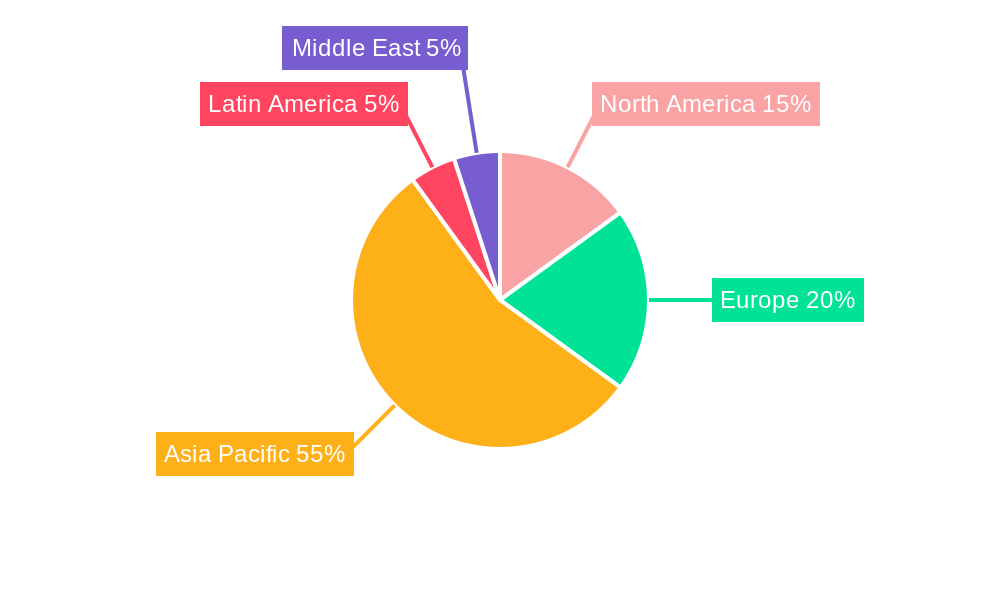
China continues to dominate the APAC pressure sensor market, fueled by its rapid industrial expansion, thriving automotive sector, and the increasing integration of pressure sensors across diverse applications. India exhibits substantial growth potential, driven by significant investments in infrastructure development and a rapidly expanding healthcare sector. Japan and South Korea maintain considerable market share due to their technologically advanced manufacturing bases and robust electronics industries. The automotive segment remains the largest consumer of pressure sensors, propelled by stringent safety regulations mandating advanced driver-assistance systems (ADAS) and the increasing sophistication of vehicle electronics. However, significant growth is also anticipated in industrial automation, particularly within process control and manufacturing sectors across the region.
- Dominant Region: China (Estimate xx% market share in 2024 – requires updated market research data)
- High-Growth Regions: India, experiencing rapid industrialization and automotive sector expansion; Southeast Asia, showing increasing demand across various sectors.
- Key Drivers in China: Rapid industrialization, robust automotive manufacturing, expanding renewable energy infrastructure, and government initiatives promoting technological advancement.
- Key Drivers in India: Expanding healthcare sector, robust government support for infrastructure and technological development, and increasing adoption of smart city technologies.
- Dominant Segment: Automotive (Estimate xx% market share in 2024 – requires updated market research data), followed by Industrial Automation and Process Control.
APAC Pressure Sensors Market Product Landscape
The APAC pressure sensor market presents a diverse array of technologies, including piezoresistive, capacitive, optical, and MEMS (Microelectromechanical Systems) sensors. These sensors cater to a wide range of pressure measurement needs, differing in pressure range, accuracy, response time, and interface compatibility. Current product innovations focus on miniaturization for space-constrained applications, improved accuracy and precision, enhanced durability and reliability in harsh environments, and seamless integration with wireless communication protocols (e.g., IoT platforms). Key features driving market competition include enhanced signal-to-noise ratio, increased sensitivity, superior temperature compensation, and robust calibration methods.
Key Drivers, Barriers & Challenges in APAP Pressure Sensors Market
Key Drivers:
- Growing demand for automation in various industries.
- Increasing adoption of advanced driver-assistance systems (ADAS) in vehicles.
- Rising adoption of sophisticated medical devices requiring precise pressure sensing.
- Government initiatives promoting industrial automation and technological advancements.
Key Challenges & Restraints:
- High initial investment costs for advanced sensor technologies.
- Concerns about sensor accuracy and reliability in harsh environments.
- Supply chain disruptions impacting production and delivery.
- Stringent regulatory compliance requirements.
Emerging Opportunities in APAC Pressure Sensors Market
- Internet of Things (IoT) Integration: Growing demand for IoT-enabled pressure sensors in smart homes, smart cities, and industrial automation for real-time monitoring and data analytics.
- Wearable Technology and Healthcare: Increasing applications in wearable health monitoring devices, offering continuous physiological data acquisition for personalized healthcare solutions.
- Aerospace and Defense: Expanding opportunities driven by the adoption of advanced pressure sensors for flight control systems, aircraft safety mechanisms, and unmanned aerial vehicles (UAVs).
- Renewable Energy: Increased demand for pressure sensors in renewable energy applications, including wind turbine monitoring, solar power systems, and energy storage solutions.
- Advanced Materials and Manufacturing: Development of novel sensor materials (e.g., graphene, nanomaterials) and advanced manufacturing techniques leading to improved sensor performance and cost reduction.
Growth Accelerators in the APAC Pressure Sensors Market Industry
Technological breakthroughs in miniaturization, enhanced accuracy, and improved power efficiency are significantly accelerating market growth. Strategic partnerships and collaborations between sensor manufacturers and end-users are facilitating the development of customized solutions. Market expansion into emerging economies presents lucrative opportunities for sustained growth.
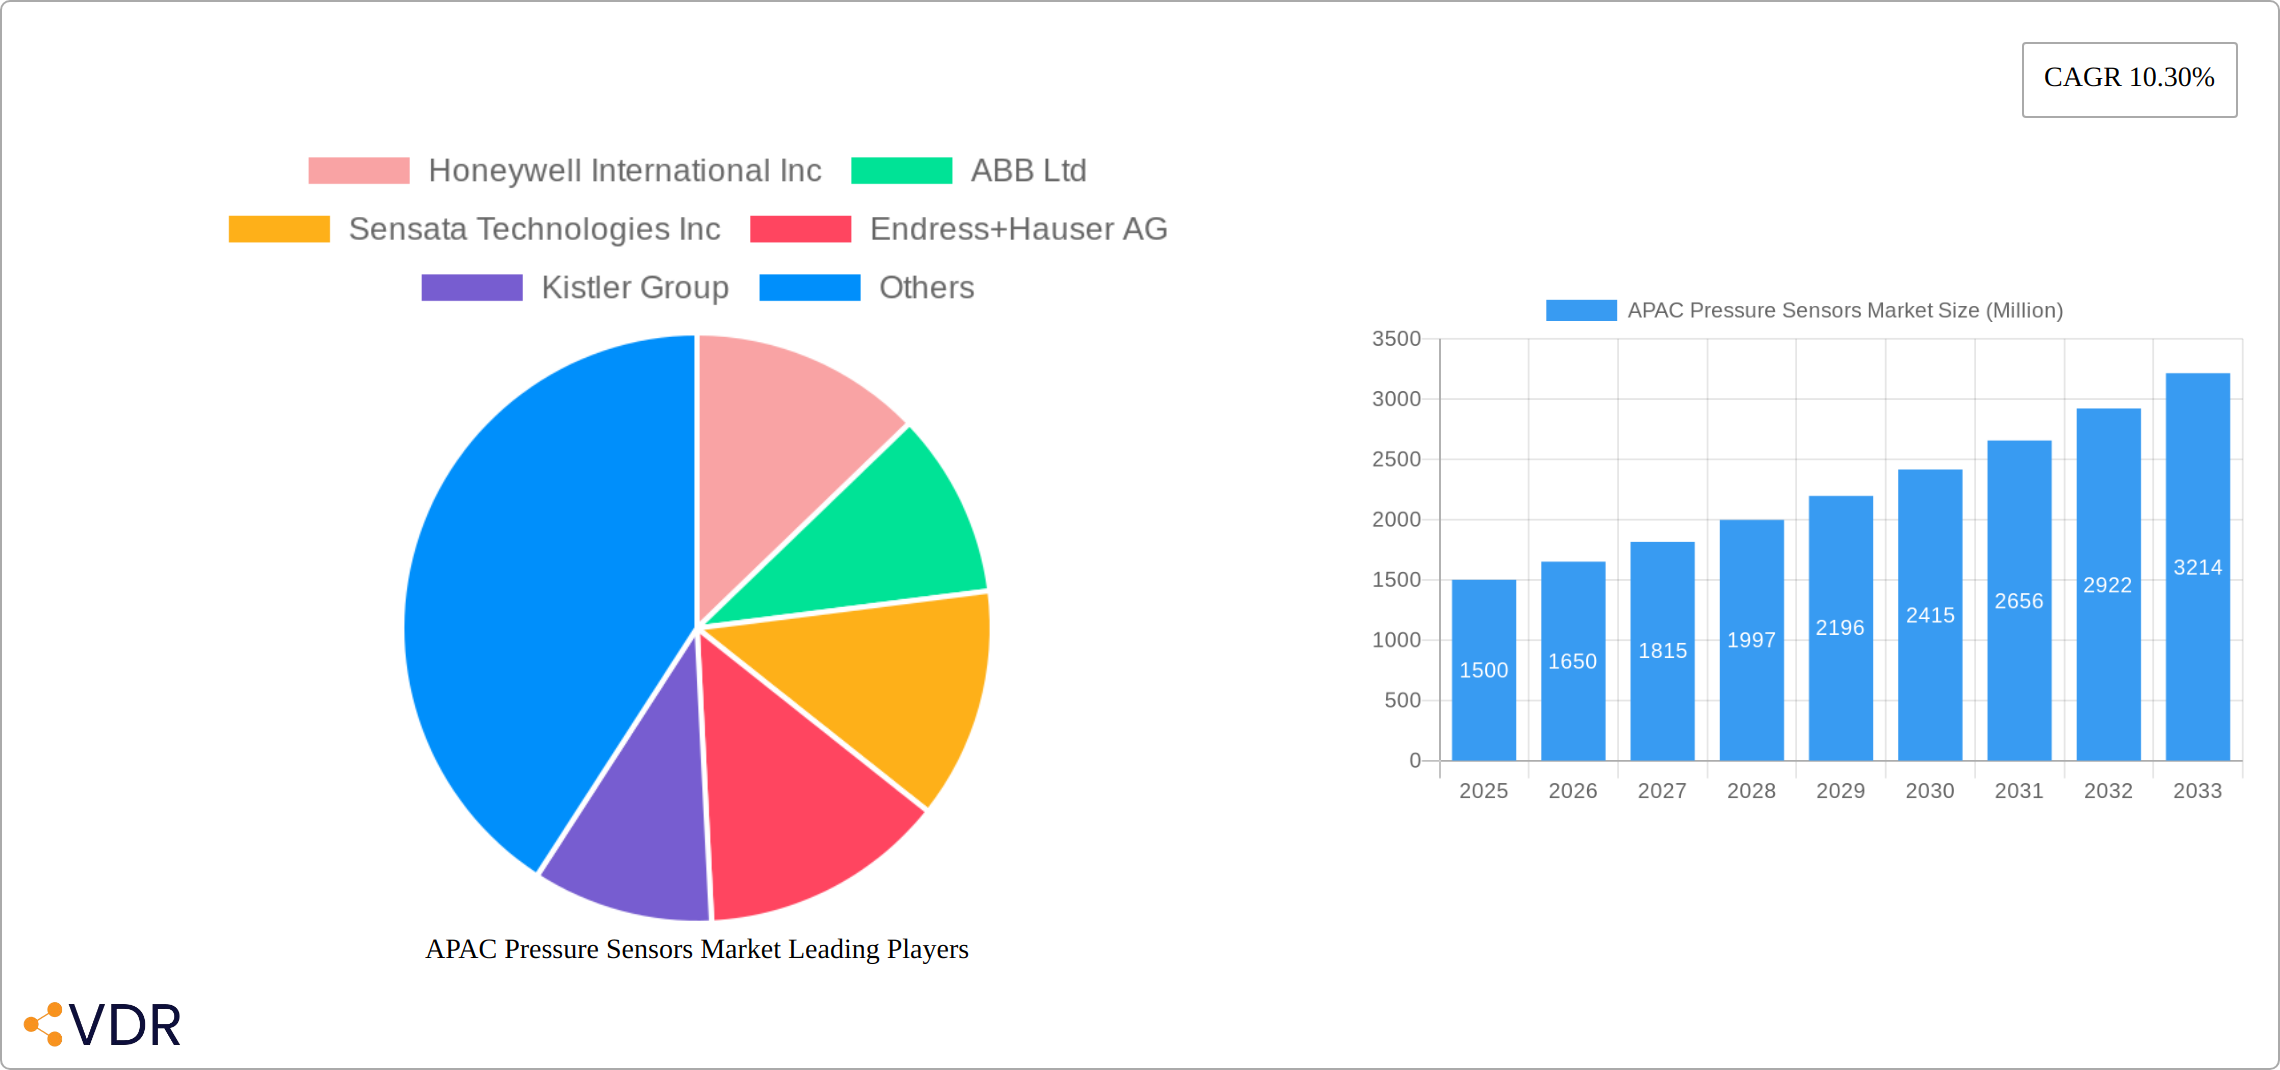
Key Players Shaping the APAC Pressure Sensors Market Market
- Honeywell International Inc
- ABB Ltd
- Sensata Technologies Inc
- Endress+Hauser AG
- Kistler Group
- Bosch Sensortec GmbH
- Siemens AG
- Yokogawa Corporation
- Invensys Ltd
- Rockwell Automation Inc
- All Sensors Corporation
- GMS Instruments BV
- Rosemount Inc (Emerson Electric Company)
Notable Milestones in APAC Pressure Sensors Market Sector
- January 2020: JK Tyre introduces a Tire Pressure Monitoring System (TPMS) via TREEL mobility Solutions.
- June 2021: Hong Kong Polytechnic University creates optical fiber sensors with health monitoring capabilities.
In-Depth APAC Pressure Sensors Market Outlook
The APAC pressure sensor market is poised for continued robust growth, driven by technological innovations, expanding applications across diverse sectors, and favorable government policies. Strategic partnerships, focused R&D, and market expansion into untapped segments will present significant opportunities for key players. The long-term outlook remains positive, with substantial market potential in emerging economies.
APAC Pressure Sensors Market Segmentation
-
1. By Application
- 1.1. Automotive
- 1.2. Medical
- 1.3. Consumer Electronics
- 1.4. Industrial
- 1.5. Aerospace and Defence
- 1.6. Food and Beverage
- 1.7. HVAC
-
2. By Type
- 2.1. Piezoresistive Pressure Sensors
- 2.2. Capacitive Pressure Sensors
- 2.3. Optical Pressure Sensors
- 2.4. Resonant Pressure Sensors
- 2.5. Thermal Pressure Sensors
APAC Pressure Sensors Market Segmentation By Geography
-
1. Asia Pacific
- 1.1. China
- 1.2. India
- 1.3. Japan
- 1.4. South Korea
- 1.5. ASEAN
- 1.6. Oceania
- 1.7. Rest of Asia Pacific
APAC Pressure Sensors Market REPORT HIGHLIGHTS
| Aspects | Details |
|---|---|
| Study Period | 2019-2033 |
| Base Year | 2024 |
| Estimated Year | 2025 |
| Forecast Period | 2025-2033 |
| Historical Period | 2019-2024 |
| Growth Rate | CAGR of 10.30% from 2019-2033 |
| Segmentation |
|
Table of Contents
- 1. Introduction
- 1.1. Research Scope
- 1.2. Market Segmentation
- 1.3. Research Methodology
- 1.4. Definitions and Assumptions
- 2. Executive Summary
- 2.1. Introduction
- 3. Market Dynamics
- 3.1. Introduction
- 3.2. Market Drivers
- 3.2.1 Growth Of End-user Verticals
- 3.2.2 such as Automotive and Healthcare; Increasing Adoption of MEMS and NEMS Systems in the Industry
- 3.3. Market Restrains
- 3.3.1. High Costs Associated with Sensing Products
- 3.4. Market Trends
- 3.4.1. Automotive Industry to Show Significant Growth
- 4. Market Factor Analysis
- 4.1. Porters Five Forces
- 4.2. Supply/Value Chain
- 4.3. PESTEL analysis
- 4.4. Market Entropy
- 4.5. Patent/Trademark Analysis
- 5. Global APAC Pressure Sensors Market Analysis, Insights and Forecast, 2019-2031
- 5.1. Market Analysis, Insights and Forecast - by By Application
- 5.1.1. Automotive
- 5.1.2. Medical
- 5.1.3. Consumer Electronics
- 5.1.4. Industrial
- 5.1.5. Aerospace and Defence
- 5.1.6. Food and Beverage
- 5.1.7. HVAC
- 5.2. Market Analysis, Insights and Forecast - by By Type
- 5.2.1. Piezoresistive Pressure Sensors
- 5.2.2. Capacitive Pressure Sensors
- 5.2.3. Optical Pressure Sensors
- 5.2.4. Resonant Pressure Sensors
- 5.2.5. Thermal Pressure Sensors
- 5.3. Market Analysis, Insights and Forecast - by Region
- 5.3.1. Asia Pacific
- 5.1. Market Analysis, Insights and Forecast - by By Application
- 6. North America APAC Pressure Sensors Market Analysis, Insights and Forecast, 2019-2031
- 6.1. Market Analysis, Insights and Forecast - By Country/Sub-region
- 6.1.1.
- 7. Europe APAC Pressure Sensors Market Analysis, Insights and Forecast, 2019-2031
- 7.1. Market Analysis, Insights and Forecast - By Country/Sub-region
- 7.1.1.
- 8. Asia Pacific APAC Pressure Sensors Market Analysis, Insights and Forecast, 2019-2031
- 8.1. Market Analysis, Insights and Forecast - By Country/Sub-region
- 8.1.1.
- 9. Latin America APAC Pressure Sensors Market Analysis, Insights and Forecast, 2019-2031
- 9.1. Market Analysis, Insights and Forecast - By Country/Sub-region
- 9.1.1.
- 10. Middle East APAC Pressure Sensors Market Analysis, Insights and Forecast, 2019-2031
- 10.1. Market Analysis, Insights and Forecast - By Country/Sub-region
- 10.1.1.
- 11. Competitive Analysis
- 11.1. Global Market Share Analysis 2024
- 11.2. Company Profiles
- 11.2.1 Honeywell International Inc
- 11.2.1.1. Overview
- 11.2.1.2. Products
- 11.2.1.3. SWOT Analysis
- 11.2.1.4. Recent Developments
- 11.2.1.5. Financials (Based on Availability)
- 11.2.2 ABB Ltd
- 11.2.2.1. Overview
- 11.2.2.2. Products
- 11.2.2.3. SWOT Analysis
- 11.2.2.4. Recent Developments
- 11.2.2.5. Financials (Based on Availability)
- 11.2.3 Sensata Technologies Inc
- 11.2.3.1. Overview
- 11.2.3.2. Products
- 11.2.3.3. SWOT Analysis
- 11.2.3.4. Recent Developments
- 11.2.3.5. Financials (Based on Availability)
- 11.2.4 Endress+Hauser AG
- 11.2.4.1. Overview
- 11.2.4.2. Products
- 11.2.4.3. SWOT Analysis
- 11.2.4.4. Recent Developments
- 11.2.4.5. Financials (Based on Availability)
- 11.2.5 Kistler Group
- 11.2.5.1. Overview
- 11.2.5.2. Products
- 11.2.5.3. SWOT Analysis
- 11.2.5.4. Recent Developments
- 11.2.5.5. Financials (Based on Availability)
- 11.2.6 Bosch Sensortec GmbH
- 11.2.6.1. Overview
- 11.2.6.2. Products
- 11.2.6.3. SWOT Analysis
- 11.2.6.4. Recent Developments
- 11.2.6.5. Financials (Based on Availability)
- 11.2.7 Siemens AG
- 11.2.7.1. Overview
- 11.2.7.2. Products
- 11.2.7.3. SWOT Analysis
- 11.2.7.4. Recent Developments
- 11.2.7.5. Financials (Based on Availability)
- 11.2.8 Yokogawa Corporation
- 11.2.8.1. Overview
- 11.2.8.2. Products
- 11.2.8.3. SWOT Analysis
- 11.2.8.4. Recent Developments
- 11.2.8.5. Financials (Based on Availability)
- 11.2.9 Invensys Ltd
- 11.2.9.1. Overview
- 11.2.9.2. Products
- 11.2.9.3. SWOT Analysis
- 11.2.9.4. Recent Developments
- 11.2.9.5. Financials (Based on Availability)
- 11.2.10 Rockwell Automation Inc
- 11.2.10.1. Overview
- 11.2.10.2. Products
- 11.2.10.3. SWOT Analysis
- 11.2.10.4. Recent Developments
- 11.2.10.5. Financials (Based on Availability)
- 11.2.11 All Sensors Corporation
- 11.2.11.1. Overview
- 11.2.11.2. Products
- 11.2.11.3. SWOT Analysis
- 11.2.11.4. Recent Developments
- 11.2.11.5. Financials (Based on Availability)
- 11.2.12 GMS Instruments BV
- 11.2.12.1. Overview
- 11.2.12.2. Products
- 11.2.12.3. SWOT Analysis
- 11.2.12.4. Recent Developments
- 11.2.12.5. Financials (Based on Availability)
- 11.2.13 Rosemount Inc (Emerson Electric Company)
- 11.2.13.1. Overview
- 11.2.13.2. Products
- 11.2.13.3. SWOT Analysis
- 11.2.13.4. Recent Developments
- 11.2.13.5. Financials (Based on Availability)
- 11.2.1 Honeywell International Inc
List of Figures
- Figure 1: Global APAC Pressure Sensors Market Revenue Breakdown (Million, %) by Region 2024 & 2032
- Figure 2: North America APAC Pressure Sensors Market Revenue (Million), by Country 2024 & 2032
- Figure 3: North America APAC Pressure Sensors Market Revenue Share (%), by Country 2024 & 2032
- Figure 4: Europe APAC Pressure Sensors Market Revenue (Million), by Country 2024 & 2032
- Figure 5: Europe APAC Pressure Sensors Market Revenue Share (%), by Country 2024 & 2032
- Figure 6: Asia Pacific APAC Pressure Sensors Market Revenue (Million), by Country 2024 & 2032
- Figure 7: Asia Pacific APAC Pressure Sensors Market Revenue Share (%), by Country 2024 & 2032
- Figure 8: Latin America APAC Pressure Sensors Market Revenue (Million), by Country 2024 & 2032
- Figure 9: Latin America APAC Pressure Sensors Market Revenue Share (%), by Country 2024 & 2032
- Figure 10: Middle East APAC Pressure Sensors Market Revenue (Million), by Country 2024 & 2032
- Figure 11: Middle East APAC Pressure Sensors Market Revenue Share (%), by Country 2024 & 2032
- Figure 12: Asia Pacific APAC Pressure Sensors Market Revenue (Million), by By Application 2024 & 2032
- Figure 13: Asia Pacific APAC Pressure Sensors Market Revenue Share (%), by By Application 2024 & 2032
- Figure 14: Asia Pacific APAC Pressure Sensors Market Revenue (Million), by By Type 2024 & 2032
- Figure 15: Asia Pacific APAC Pressure Sensors Market Revenue Share (%), by By Type 2024 & 2032
- Figure 16: Asia Pacific APAC Pressure Sensors Market Revenue (Million), by Country 2024 & 2032
- Figure 17: Asia Pacific APAC Pressure Sensors Market Revenue Share (%), by Country 2024 & 2032
List of Tables
- Table 1: Global APAC Pressure Sensors Market Revenue Million Forecast, by Region 2019 & 2032
- Table 2: Global APAC Pressure Sensors Market Revenue Million Forecast, by By Application 2019 & 2032
- Table 3: Global APAC Pressure Sensors Market Revenue Million Forecast, by By Type 2019 & 2032
- Table 4: Global APAC Pressure Sensors Market Revenue Million Forecast, by Region 2019 & 2032
- Table 5: Global APAC Pressure Sensors Market Revenue Million Forecast, by Country 2019 & 2032
- Table 6: APAC Pressure Sensors Market Revenue (Million) Forecast, by Application 2019 & 2032
- Table 7: Global APAC Pressure Sensors Market Revenue Million Forecast, by Country 2019 & 2032
- Table 8: APAC Pressure Sensors Market Revenue (Million) Forecast, by Application 2019 & 2032
- Table 9: Global APAC Pressure Sensors Market Revenue Million Forecast, by Country 2019 & 2032
- Table 10: APAC Pressure Sensors Market Revenue (Million) Forecast, by Application 2019 & 2032
- Table 11: Global APAC Pressure Sensors Market Revenue Million Forecast, by Country 2019 & 2032
- Table 12: APAC Pressure Sensors Market Revenue (Million) Forecast, by Application 2019 & 2032
- Table 13: Global APAC Pressure Sensors Market Revenue Million Forecast, by Country 2019 & 2032
- Table 14: APAC Pressure Sensors Market Revenue (Million) Forecast, by Application 2019 & 2032
- Table 15: Global APAC Pressure Sensors Market Revenue Million Forecast, by By Application 2019 & 2032
- Table 16: Global APAC Pressure Sensors Market Revenue Million Forecast, by By Type 2019 & 2032
- Table 17: Global APAC Pressure Sensors Market Revenue Million Forecast, by Country 2019 & 2032
- Table 18: China APAC Pressure Sensors Market Revenue (Million) Forecast, by Application 2019 & 2032
- Table 19: India APAC Pressure Sensors Market Revenue (Million) Forecast, by Application 2019 & 2032
- Table 20: Japan APAC Pressure Sensors Market Revenue (Million) Forecast, by Application 2019 & 2032
- Table 21: South Korea APAC Pressure Sensors Market Revenue (Million) Forecast, by Application 2019 & 2032
- Table 22: ASEAN APAC Pressure Sensors Market Revenue (Million) Forecast, by Application 2019 & 2032
- Table 23: Oceania APAC Pressure Sensors Market Revenue (Million) Forecast, by Application 2019 & 2032
- Table 24: Rest of Asia Pacific APAC Pressure Sensors Market Revenue (Million) Forecast, by Application 2019 & 2032
Frequently Asked Questions
1. What is the projected Compound Annual Growth Rate (CAGR) of the APAC Pressure Sensors Market?
The projected CAGR is approximately 10.30%.
2. Which companies are prominent players in the APAC Pressure Sensors Market?
Key companies in the market include Honeywell International Inc, ABB Ltd, Sensata Technologies Inc, Endress+Hauser AG, Kistler Group, Bosch Sensortec GmbH, Siemens AG, Yokogawa Corporation, Invensys Ltd, Rockwell Automation Inc, All Sensors Corporation, GMS Instruments BV, Rosemount Inc (Emerson Electric Company).
3. What are the main segments of the APAC Pressure Sensors Market?
The market segments include By Application, By Type.
4. Can you provide details about the market size?
The market size is estimated to be USD XX Million as of 2022.
5. What are some drivers contributing to market growth?
Growth Of End-user Verticals. such as Automotive and Healthcare; Increasing Adoption of MEMS and NEMS Systems in the Industry.
6. What are the notable trends driving market growth?
Automotive Industry to Show Significant Growth.
7. Are there any restraints impacting market growth?
High Costs Associated with Sensing Products.
8. Can you provide examples of recent developments in the market?
January 2020 - JK Tyre, an Indian tire manufacturer, introduced a Tire Pressure Monitoring System (TPMS) via previously acquired TREEL mobility Solutions, TREEL Sensors, which monitor the tyre's vital statistics, including pressure and temperature.
9. What pricing options are available for accessing the report?
Pricing options include single-user, multi-user, and enterprise licenses priced at USD 4750, USD 4950, and USD 6800 respectively.
10. Is the market size provided in terms of value or volume?
The market size is provided in terms of value, measured in Million.
11. Are there any specific market keywords associated with the report?
Yes, the market keyword associated with the report is "APAC Pressure Sensors Market," which aids in identifying and referencing the specific market segment covered.
12. How do I determine which pricing option suits my needs best?
The pricing options vary based on user requirements and access needs. Individual users may opt for single-user licenses, while businesses requiring broader access may choose multi-user or enterprise licenses for cost-effective access to the report.
13. Are there any additional resources or data provided in the APAC Pressure Sensors Market report?
While the report offers comprehensive insights, it's advisable to review the specific contents or supplementary materials provided to ascertain if additional resources or data are available.
14. How can I stay updated on further developments or reports in the APAC Pressure Sensors Market?
To stay informed about further developments, trends, and reports in the APAC Pressure Sensors Market, consider subscribing to industry newsletters, following relevant companies and organizations, or regularly checking reputable industry news sources and publications.
Methodology
Step 1 - Identification of Relevant Samples Size from Population Database


Step 2 - Approaches for Defining Global Market Size (Value, Volume* & Price*)

Note*: In applicable scenarios
Step 3 - Data Sources
Primary Research
- Web Analytics
- Survey Reports
- Research Institute
- Latest Research Reports
- Opinion Leaders
Secondary Research
- Annual Reports
- White Paper
- Latest Press Release
- Industry Association
- Paid Database
- Investor Presentations

Step 4 - Data Triangulation
Involves using different sources of information in order to increase the validity of a study
These sources are likely to be stakeholders in a program - participants, other researchers, program staff, other community members, and so on.
Then we put all data in single framework & apply various statistical tools to find out the dynamic on the market.
During the analysis stage, feedback from the stakeholder groups would be compared to determine areas of agreement as well as areas of divergence


