
Key Insights
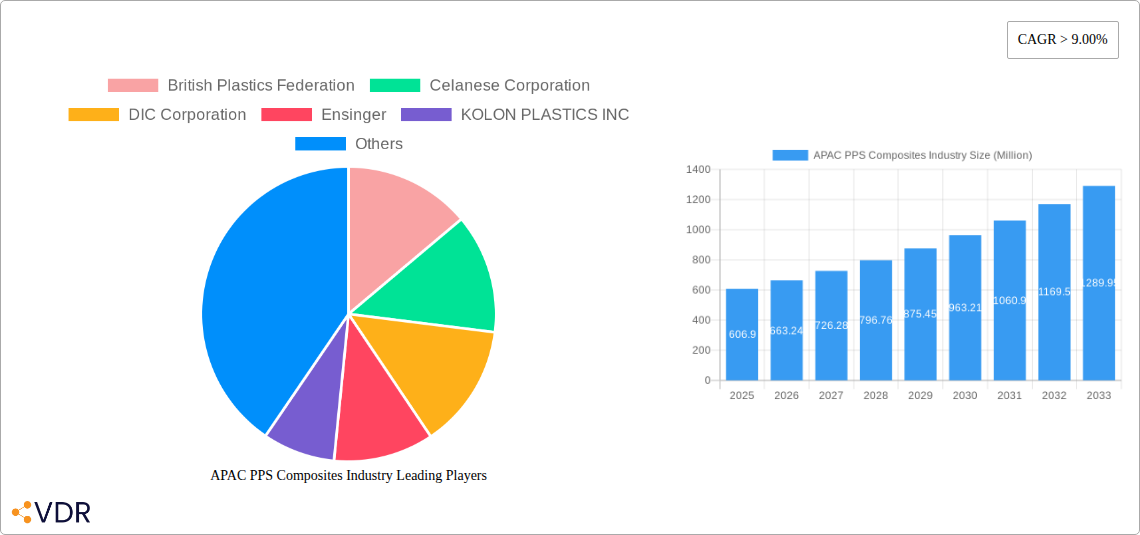
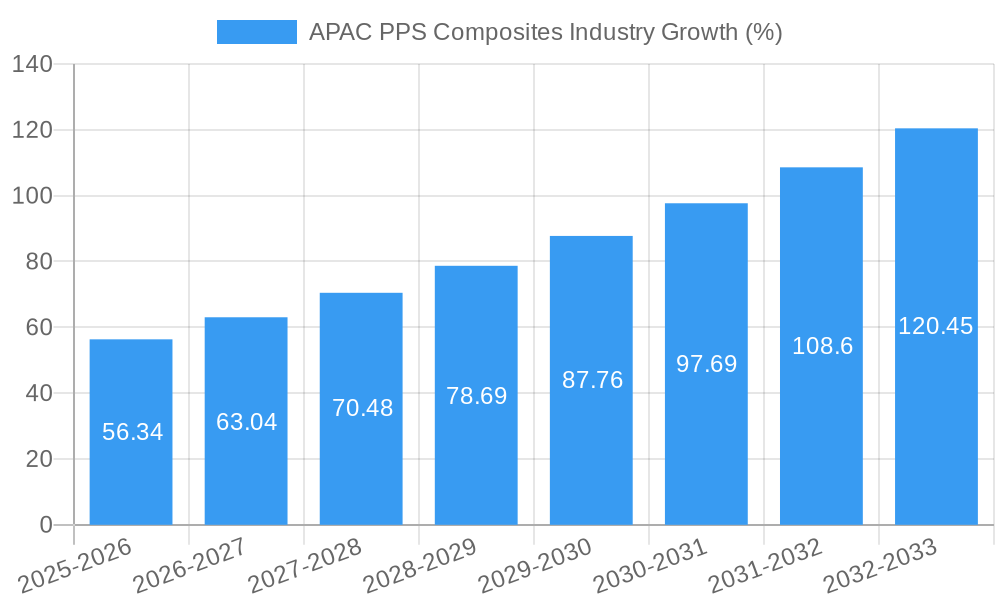
The APAC PPS Composites market, valued at $606.90 million in 2025, is projected for robust growth, exhibiting a Compound Annual Growth Rate (CAGR) exceeding 9.00% from 2025 to 2033. This expansion is fueled by several key factors. The increasing demand for lightweight yet high-performance materials across diverse sectors, including automotive, electronics, and aerospace, is a primary driver. Advancements in manufacturing technologies enabling the production of more complex and intricate PPS composite parts further contribute to market growth. Stringent government regulations promoting fuel efficiency and reduced emissions in the automotive industry are also boosting demand for lighter materials like PPS composites. Furthermore, the expanding electronics industry in the APAC region, particularly in countries like China, South Korea, and Japan, necessitates robust and thermally stable materials for advanced electronic components, fueling demand for PPS composites.
Growth within specific segments is anticipated to vary. The automotive segment is likely to dominate, driven by the increasing adoption of electric vehicles and hybrid vehicles requiring lightweight and durable components. The electronics segment is also expected to exhibit significant growth, driven by the continuous miniaturization and increasing performance demands of electronic devices. However, challenges remain. The relatively high cost of PPS composites compared to alternative materials could restrain market expansion. Fluctuations in raw material prices and supply chain disruptions pose potential risks. Nonetheless, the long-term outlook for the APAC PPS Composites market remains positive, driven by technological advancements, increasing industry demand, and supportive government policies. Companies such as British Plastics Federation, Celanese Corporation, and others are key players shaping this dynamic landscape.
APAC PPS Composites Industry Market Report: 2019-2033
This comprehensive report provides a detailed analysis of the Asia-Pacific (APAC) Polyphenylene Sulfide (PPS) Composites market, offering invaluable insights for industry professionals, investors, and strategic decision-makers. The study covers the period from 2019 to 2033, with a focus on the forecast period from 2025 to 2033, and a base year of 2025. We examine market dynamics, growth trends, leading players, and future opportunities within the broader APAC engineering plastics and high-performance materials sectors.
Study Period: 2019-2033 Base Year: 2025 Estimated Year: 2025 Forecast Period: 2025-2033 Historical Period: 2019-2024
APAC PPS Composites Industry Market Dynamics & Structure
The APAC PPS composites market exhibits a moderately concentrated structure, with several multinational corporations and regional players dominating the landscape. Market share is currently estimated at xx Million units, with the top five players holding approximately xx% of the market. Technological innovation, particularly in high-temperature resistance and chemical resistance, is a key driver, while stringent regulatory frameworks related to environmental sustainability and material safety are shaping market dynamics. The market faces competition from alternative materials like PEEK and PEI, but PPS composites maintain an advantage in specific niche applications due to their superior performance characteristics. M&A activity has been moderate in recent years, with xx major deals recorded between 2019 and 2024, largely focused on expanding production capacity and geographical reach.
- Market Concentration: Moderately concentrated, top 5 players holding approximately xx% market share (2024).
- Technological Innovation: Focus on improving high-temperature and chemical resistance.
- Regulatory Landscape: Stringent environmental and safety regulations impacting material choices.
- Competitive Substitutes: PEEK, PEI, other high-performance polymers.
- End-User Demographics: Primarily automotive, electronics, and industrial sectors.
- M&A Activity: xx major deals (2019-2024), focused on capacity expansion and geographic reach.
- Innovation Barriers: High R&D costs, stringent regulatory approvals.
APAC PPS Composites Industry Growth Trends & Insights
The APAC PPS composites market experienced significant growth during the historical period (2019-2024), with a CAGR of xx%. This growth is attributed to increasing demand from key end-use sectors, particularly the automotive and electronics industries, driven by the need for lightweight, high-performance materials. Technological advancements, including the development of fiber-reinforced PPS composites and nanocomposites, are further fueling market expansion. Consumer behavior shifts towards sustainable and durable products also contribute to the rising adoption rates. The market is projected to continue its growth trajectory in the forecast period (2025-2033), with a projected CAGR of xx%, reaching an estimated market size of xx Million units by 2033. Market penetration is expected to increase significantly in emerging economies within the APAC region.
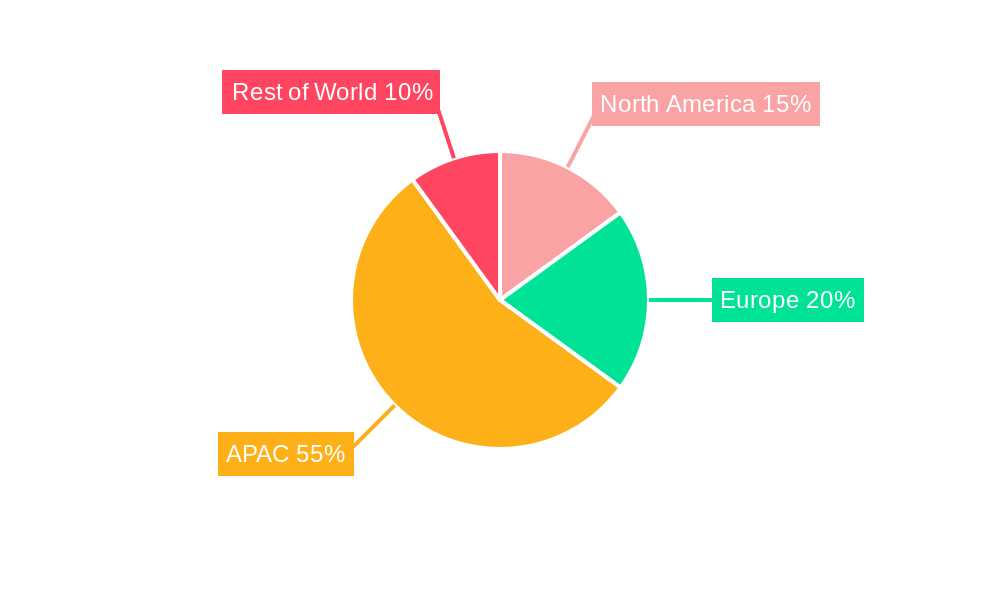
Dominant Regions, Countries, or Segments in APAC PPS Composites Industry
China holds the dominant position in the APAC PPS composites market, accounting for approximately xx% of the total market share in 2024. This dominance is primarily driven by robust economic growth, rapid industrialization, and a large automotive manufacturing base. Other key contributors include Japan, South Korea, and India. The automotive segment is the largest end-use sector, followed by electronics and industrial applications.
- Key Drivers in China: Robust economic growth, large automotive industry, expanding electronics sector.
- Key Drivers in Japan: Advanced manufacturing capabilities, strong R&D investments.
- Key Drivers in South Korea: Focus on high-tech industries, strong electronics manufacturing base.
- Key Drivers in India: Growing automotive and industrial sectors, government initiatives promoting manufacturing.
- Dominance Factors: Strong manufacturing base, favorable economic policies, growing demand from end-use sectors.
APAC PPS Composites Industry Product Landscape
The APAC PPS composites market offers a diverse range of products, including fiber-reinforced composites, nanocomposites, and blends. These materials are characterized by their high-temperature resistance, chemical resistance, and mechanical strength. Recent innovations focus on improved processability, enhanced thermal conductivity, and tailored material properties for specific applications. Unique selling propositions include superior performance characteristics compared to other engineering plastics, and advancements like carbon fiber reinforcement further enhance product capabilities.
Key Drivers, Barriers & Challenges in APAP PPS Composites Industry
Key Drivers:
- Growing demand from automotive and electronics sectors for lightweight, high-performance materials.
- Technological advancements, including the development of high-performance PPS composites.
- Government initiatives promoting the adoption of advanced materials in various industries.
Key Challenges and Restraints:
- High material costs compared to alternative polymers.
- Potential supply chain disruptions due to geopolitical factors.
- Stringent regulatory requirements for material safety and environmental impact. These regulatory hurdles increase production costs by an estimated xx% (2024).
Emerging Opportunities in APAC PPS Composites Industry
- Expanding applications in renewable energy technologies, such as wind turbine components.
- Growth in the aerospace and defense industries, where high-performance materials are critical.
- Development of novel PPS composites with enhanced properties for specific applications.
Growth Accelerators in the APAC PPS Composites Industry
Technological breakthroughs in material science, strategic collaborations between material suppliers and end-users, and aggressive market expansion strategies by major players are key catalysts accelerating long-term growth within the APAC PPS composites market. These synergistic efforts are expected to unlock substantial untapped market potential and solidify the sector’s position within the broader advanced materials landscape.
Key Players Shaping the APAC PPS Composites Industry Market
- British Plastics Federation
- Celanese Corporation
- DIC Corporation
- Ensinger
- KOLON PLASTICS INC
- KUREHA CORPORATION
- Polyplastics Co Ltd
- RTP Company
- SABIC
- SGL Carbon
- Solvay
- STARCHEM LLC
- Teijin Limited
- Tosoh Corporation
- Xiamen LFT Composite Plastic Co Ltd
- *List Not Exhaustive
Notable Milestones in APAC PPS Composites Industry Sector
- November 2022: Polyplastics Co., Ltd. expanded its PPS resin production capacity at its Nantong, China plant, increasing annual production from 9,000 to 21,400 tons. This expansion will significantly increase global supply and meet growing demand, with full operation commencing January 2025.
- April 2022: SABIC launched LNP THERMOCOMP OFC08V, a glass fiber-reinforced PPS compound designed for 5G base station dipole antennas and other electrical and electronic applications. This new product caters to the increasing demand for high-performance materials in the telecommunications sector.
In-Depth APAC PPS Composites Industry Market Outlook
The APAC PPS composites market is poised for robust growth over the forecast period, driven by technological advancements, increasing demand from key end-use sectors, and supportive government policies. Strategic partnerships, investments in R&D, and expansion into new applications will unlock significant opportunities for both established players and emerging companies. This presents a promising landscape for businesses seeking to capitalize on the escalating demand for advanced materials within the dynamic APAC region.
APAC PPS Composites Industry Segmentation
-
1. Type
- 1.1. Carbon Fiber-Reinforced Composites
- 1.2. Glass Fiber-Reinforced Composites
- 1.3. Other Ty
-
2. End-user Industry
- 2.1. Aerospace and Defense
- 2.2. Automotive
- 2.3. Oil and Gas
- 2.4. Electrical and Electronics
- 2.5. Industrial
- 2.6. Other En
-
3. Geography
- 3.1. China
- 3.2. India
- 3.3. Japan
- 3.4. South Korea
- 3.5. ASEAN Countries
- 3.6. Rest of Asia-Pacific
APAC PPS Composites Industry Segmentation By Geography
- 1. China
- 2. India
- 3. Japan
- 4. South Korea
- 5. ASEAN Countries
- 6. Rest of Asia Pacific
APAC PPS Composites Industry REPORT HIGHLIGHTS
| Aspects | Details |
|---|---|
| Study Period | 2019-2033 |
| Base Year | 2024 |
| Estimated Year | 2025 |
| Forecast Period | 2025-2033 |
| Historical Period | 2019-2024 |
| Growth Rate | CAGR of > 9.00% from 2019-2033 |
| Segmentation |
|
Table of Contents
- 1. Introduction
- 1.1. Research Scope
- 1.2. Market Segmentation
- 1.3. Research Methodology
- 1.4. Definitions and Assumptions
- 2. Executive Summary
- 2.1. Introduction
- 3. Market Dynamics
- 3.1. Introduction
- 3.2. Market Drivers
- 3.2.1. Rising Demand from Aerospace and Defense; Increasing Demand from Oil and Gas Sector; Other Drivers
- 3.3. Market Restrains
- 3.3.1. Rising Demand from Aerospace and Defense; Increasing Demand from Oil and Gas Sector; Other Drivers
- 3.4. Market Trends
- 3.4.1. Aerospace and Defense Sector to Drive the Polyphenylene Sulfide (PPS) Composites Market
- 4. Market Factor Analysis
- 4.1. Porters Five Forces
- 4.2. Supply/Value Chain
- 4.3. PESTEL analysis
- 4.4. Market Entropy
- 4.5. Patent/Trademark Analysis
- 5. Global APAC PPS Composites Industry Analysis, Insights and Forecast, 2019-2031
- 5.1. Market Analysis, Insights and Forecast - by Type
- 5.1.1. Carbon Fiber-Reinforced Composites
- 5.1.2. Glass Fiber-Reinforced Composites
- 5.1.3. Other Ty
- 5.2. Market Analysis, Insights and Forecast - by End-user Industry
- 5.2.1. Aerospace and Defense
- 5.2.2. Automotive
- 5.2.3. Oil and Gas
- 5.2.4. Electrical and Electronics
- 5.2.5. Industrial
- 5.2.6. Other En
- 5.3. Market Analysis, Insights and Forecast - by Geography
- 5.3.1. China
- 5.3.2. India
- 5.3.3. Japan
- 5.3.4. South Korea
- 5.3.5. ASEAN Countries
- 5.3.6. Rest of Asia-Pacific
- 5.4. Market Analysis, Insights and Forecast - by Region
- 5.4.1. China
- 5.4.2. India
- 5.4.3. Japan
- 5.4.4. South Korea
- 5.4.5. ASEAN Countries
- 5.4.6. Rest of Asia Pacific
- 5.1. Market Analysis, Insights and Forecast - by Type
- 6. China APAC PPS Composites Industry Analysis, Insights and Forecast, 2019-2031
- 6.1. Market Analysis, Insights and Forecast - by Type
- 6.1.1. Carbon Fiber-Reinforced Composites
- 6.1.2. Glass Fiber-Reinforced Composites
- 6.1.3. Other Ty
- 6.2. Market Analysis, Insights and Forecast - by End-user Industry
- 6.2.1. Aerospace and Defense
- 6.2.2. Automotive
- 6.2.3. Oil and Gas
- 6.2.4. Electrical and Electronics
- 6.2.5. Industrial
- 6.2.6. Other En
- 6.3. Market Analysis, Insights and Forecast - by Geography
- 6.3.1. China
- 6.3.2. India
- 6.3.3. Japan
- 6.3.4. South Korea
- 6.3.5. ASEAN Countries
- 6.3.6. Rest of Asia-Pacific
- 6.1. Market Analysis, Insights and Forecast - by Type
- 7. India APAC PPS Composites Industry Analysis, Insights and Forecast, 2019-2031
- 7.1. Market Analysis, Insights and Forecast - by Type
- 7.1.1. Carbon Fiber-Reinforced Composites
- 7.1.2. Glass Fiber-Reinforced Composites
- 7.1.3. Other Ty
- 7.2. Market Analysis, Insights and Forecast - by End-user Industry
- 7.2.1. Aerospace and Defense
- 7.2.2. Automotive
- 7.2.3. Oil and Gas
- 7.2.4. Electrical and Electronics
- 7.2.5. Industrial
- 7.2.6. Other En
- 7.3. Market Analysis, Insights and Forecast - by Geography
- 7.3.1. China
- 7.3.2. India
- 7.3.3. Japan
- 7.3.4. South Korea
- 7.3.5. ASEAN Countries
- 7.3.6. Rest of Asia-Pacific
- 7.1. Market Analysis, Insights and Forecast - by Type
- 8. Japan APAC PPS Composites Industry Analysis, Insights and Forecast, 2019-2031
- 8.1. Market Analysis, Insights and Forecast - by Type
- 8.1.1. Carbon Fiber-Reinforced Composites
- 8.1.2. Glass Fiber-Reinforced Composites
- 8.1.3. Other Ty
- 8.2. Market Analysis, Insights and Forecast - by End-user Industry
- 8.2.1. Aerospace and Defense
- 8.2.2. Automotive
- 8.2.3. Oil and Gas
- 8.2.4. Electrical and Electronics
- 8.2.5. Industrial
- 8.2.6. Other En
- 8.3. Market Analysis, Insights and Forecast - by Geography
- 8.3.1. China
- 8.3.2. India
- 8.3.3. Japan
- 8.3.4. South Korea
- 8.3.5. ASEAN Countries
- 8.3.6. Rest of Asia-Pacific
- 8.1. Market Analysis, Insights and Forecast - by Type
- 9. South Korea APAC PPS Composites Industry Analysis, Insights and Forecast, 2019-2031
- 9.1. Market Analysis, Insights and Forecast - by Type
- 9.1.1. Carbon Fiber-Reinforced Composites
- 9.1.2. Glass Fiber-Reinforced Composites
- 9.1.3. Other Ty
- 9.2. Market Analysis, Insights and Forecast - by End-user Industry
- 9.2.1. Aerospace and Defense
- 9.2.2. Automotive
- 9.2.3. Oil and Gas
- 9.2.4. Electrical and Electronics
- 9.2.5. Industrial
- 9.2.6. Other En
- 9.3. Market Analysis, Insights and Forecast - by Geography
- 9.3.1. China
- 9.3.2. India
- 9.3.3. Japan
- 9.3.4. South Korea
- 9.3.5. ASEAN Countries
- 9.3.6. Rest of Asia-Pacific
- 9.1. Market Analysis, Insights and Forecast - by Type
- 10. ASEAN Countries APAC PPS Composites Industry Analysis, Insights and Forecast, 2019-2031
- 10.1. Market Analysis, Insights and Forecast - by Type
- 10.1.1. Carbon Fiber-Reinforced Composites
- 10.1.2. Glass Fiber-Reinforced Composites
- 10.1.3. Other Ty
- 10.2. Market Analysis, Insights and Forecast - by End-user Industry
- 10.2.1. Aerospace and Defense
- 10.2.2. Automotive
- 10.2.3. Oil and Gas
- 10.2.4. Electrical and Electronics
- 10.2.5. Industrial
- 10.2.6. Other En
- 10.3. Market Analysis, Insights and Forecast - by Geography
- 10.3.1. China
- 10.3.2. India
- 10.3.3. Japan
- 10.3.4. South Korea
- 10.3.5. ASEAN Countries
- 10.3.6. Rest of Asia-Pacific
- 10.1. Market Analysis, Insights and Forecast - by Type
- 11. Rest of Asia Pacific APAC PPS Composites Industry Analysis, Insights and Forecast, 2019-2031
- 11.1. Market Analysis, Insights and Forecast - by Type
- 11.1.1. Carbon Fiber-Reinforced Composites
- 11.1.2. Glass Fiber-Reinforced Composites
- 11.1.3. Other Ty
- 11.2. Market Analysis, Insights and Forecast - by End-user Industry
- 11.2.1. Aerospace and Defense
- 11.2.2. Automotive
- 11.2.3. Oil and Gas
- 11.2.4. Electrical and Electronics
- 11.2.5. Industrial
- 11.2.6. Other En
- 11.3. Market Analysis, Insights and Forecast - by Geography
- 11.3.1. China
- 11.3.2. India
- 11.3.3. Japan
- 11.3.4. South Korea
- 11.3.5. ASEAN Countries
- 11.3.6. Rest of Asia-Pacific
- 11.1. Market Analysis, Insights and Forecast - by Type
- 12. Competitive Analysis
- 12.1. Global Market Share Analysis 2024
- 12.2. Company Profiles
- 12.2.1 British Plastics Federation
- 12.2.1.1. Overview
- 12.2.1.2. Products
- 12.2.1.3. SWOT Analysis
- 12.2.1.4. Recent Developments
- 12.2.1.5. Financials (Based on Availability)
- 12.2.2 Celanese Corporation
- 12.2.2.1. Overview
- 12.2.2.2. Products
- 12.2.2.3. SWOT Analysis
- 12.2.2.4. Recent Developments
- 12.2.2.5. Financials (Based on Availability)
- 12.2.3 DIC Corporation
- 12.2.3.1. Overview
- 12.2.3.2. Products
- 12.2.3.3. SWOT Analysis
- 12.2.3.4. Recent Developments
- 12.2.3.5. Financials (Based on Availability)
- 12.2.4 Ensinger
- 12.2.4.1. Overview
- 12.2.4.2. Products
- 12.2.4.3. SWOT Analysis
- 12.2.4.4. Recent Developments
- 12.2.4.5. Financials (Based on Availability)
- 12.2.5 KOLON PLASTICS INC
- 12.2.5.1. Overview
- 12.2.5.2. Products
- 12.2.5.3. SWOT Analysis
- 12.2.5.4. Recent Developments
- 12.2.5.5. Financials (Based on Availability)
- 12.2.6 KUREHA CORPORATION
- 12.2.6.1. Overview
- 12.2.6.2. Products
- 12.2.6.3. SWOT Analysis
- 12.2.6.4. Recent Developments
- 12.2.6.5. Financials (Based on Availability)
- 12.2.7 Polyplastics Co Ltd
- 12.2.7.1. Overview
- 12.2.7.2. Products
- 12.2.7.3. SWOT Analysis
- 12.2.7.4. Recent Developments
- 12.2.7.5. Financials (Based on Availability)
- 12.2.8 RTP Company
- 12.2.8.1. Overview
- 12.2.8.2. Products
- 12.2.8.3. SWOT Analysis
- 12.2.8.4. Recent Developments
- 12.2.8.5. Financials (Based on Availability)
- 12.2.9 SABIC
- 12.2.9.1. Overview
- 12.2.9.2. Products
- 12.2.9.3. SWOT Analysis
- 12.2.9.4. Recent Developments
- 12.2.9.5. Financials (Based on Availability)
- 12.2.10 SGL Carbon
- 12.2.10.1. Overview
- 12.2.10.2. Products
- 12.2.10.3. SWOT Analysis
- 12.2.10.4. Recent Developments
- 12.2.10.5. Financials (Based on Availability)
- 12.2.11 Solvay
- 12.2.11.1. Overview
- 12.2.11.2. Products
- 12.2.11.3. SWOT Analysis
- 12.2.11.4. Recent Developments
- 12.2.11.5. Financials (Based on Availability)
- 12.2.12 STARCHEM LLC
- 12.2.12.1. Overview
- 12.2.12.2. Products
- 12.2.12.3. SWOT Analysis
- 12.2.12.4. Recent Developments
- 12.2.12.5. Financials (Based on Availability)
- 12.2.13 Teijin Limited
- 12.2.13.1. Overview
- 12.2.13.2. Products
- 12.2.13.3. SWOT Analysis
- 12.2.13.4. Recent Developments
- 12.2.13.5. Financials (Based on Availability)
- 12.2.14 Tosoh Corporation
- 12.2.14.1. Overview
- 12.2.14.2. Products
- 12.2.14.3. SWOT Analysis
- 12.2.14.4. Recent Developments
- 12.2.14.5. Financials (Based on Availability)
- 12.2.15 Xiamen LFT Composite Plastic Co Ltd*List Not Exhaustive
- 12.2.15.1. Overview
- 12.2.15.2. Products
- 12.2.15.3. SWOT Analysis
- 12.2.15.4. Recent Developments
- 12.2.15.5. Financials (Based on Availability)
- 12.2.1 British Plastics Federation
List of Figures
- Figure 1: Global APAC PPS Composites Industry Revenue Breakdown (Million, %) by Region 2024 & 2032
- Figure 2: Global APAC PPS Composites Industry Volume Breakdown (Million, %) by Region 2024 & 2032
- Figure 3: China APAC PPS Composites Industry Revenue (Million), by Type 2024 & 2032
- Figure 4: China APAC PPS Composites Industry Volume (Million), by Type 2024 & 2032
- Figure 5: China APAC PPS Composites Industry Revenue Share (%), by Type 2024 & 2032
- Figure 6: China APAC PPS Composites Industry Volume Share (%), by Type 2024 & 2032
- Figure 7: China APAC PPS Composites Industry Revenue (Million), by End-user Industry 2024 & 2032
- Figure 8: China APAC PPS Composites Industry Volume (Million), by End-user Industry 2024 & 2032
- Figure 9: China APAC PPS Composites Industry Revenue Share (%), by End-user Industry 2024 & 2032
- Figure 10: China APAC PPS Composites Industry Volume Share (%), by End-user Industry 2024 & 2032
- Figure 11: China APAC PPS Composites Industry Revenue (Million), by Geography 2024 & 2032
- Figure 12: China APAC PPS Composites Industry Volume (Million), by Geography 2024 & 2032
- Figure 13: China APAC PPS Composites Industry Revenue Share (%), by Geography 2024 & 2032
- Figure 14: China APAC PPS Composites Industry Volume Share (%), by Geography 2024 & 2032
- Figure 15: China APAC PPS Composites Industry Revenue (Million), by Country 2024 & 2032
- Figure 16: China APAC PPS Composites Industry Volume (Million), by Country 2024 & 2032
- Figure 17: China APAC PPS Composites Industry Revenue Share (%), by Country 2024 & 2032
- Figure 18: China APAC PPS Composites Industry Volume Share (%), by Country 2024 & 2032
- Figure 19: India APAC PPS Composites Industry Revenue (Million), by Type 2024 & 2032
- Figure 20: India APAC PPS Composites Industry Volume (Million), by Type 2024 & 2032
- Figure 21: India APAC PPS Composites Industry Revenue Share (%), by Type 2024 & 2032
- Figure 22: India APAC PPS Composites Industry Volume Share (%), by Type 2024 & 2032
- Figure 23: India APAC PPS Composites Industry Revenue (Million), by End-user Industry 2024 & 2032
- Figure 24: India APAC PPS Composites Industry Volume (Million), by End-user Industry 2024 & 2032
- Figure 25: India APAC PPS Composites Industry Revenue Share (%), by End-user Industry 2024 & 2032
- Figure 26: India APAC PPS Composites Industry Volume Share (%), by End-user Industry 2024 & 2032
- Figure 27: India APAC PPS Composites Industry Revenue (Million), by Geography 2024 & 2032
- Figure 28: India APAC PPS Composites Industry Volume (Million), by Geography 2024 & 2032
- Figure 29: India APAC PPS Composites Industry Revenue Share (%), by Geography 2024 & 2032
- Figure 30: India APAC PPS Composites Industry Volume Share (%), by Geography 2024 & 2032
- Figure 31: India APAC PPS Composites Industry Revenue (Million), by Country 2024 & 2032
- Figure 32: India APAC PPS Composites Industry Volume (Million), by Country 2024 & 2032
- Figure 33: India APAC PPS Composites Industry Revenue Share (%), by Country 2024 & 2032
- Figure 34: India APAC PPS Composites Industry Volume Share (%), by Country 2024 & 2032
- Figure 35: Japan APAC PPS Composites Industry Revenue (Million), by Type 2024 & 2032
- Figure 36: Japan APAC PPS Composites Industry Volume (Million), by Type 2024 & 2032
- Figure 37: Japan APAC PPS Composites Industry Revenue Share (%), by Type 2024 & 2032
- Figure 38: Japan APAC PPS Composites Industry Volume Share (%), by Type 2024 & 2032
- Figure 39: Japan APAC PPS Composites Industry Revenue (Million), by End-user Industry 2024 & 2032
- Figure 40: Japan APAC PPS Composites Industry Volume (Million), by End-user Industry 2024 & 2032
- Figure 41: Japan APAC PPS Composites Industry Revenue Share (%), by End-user Industry 2024 & 2032
- Figure 42: Japan APAC PPS Composites Industry Volume Share (%), by End-user Industry 2024 & 2032
- Figure 43: Japan APAC PPS Composites Industry Revenue (Million), by Geography 2024 & 2032
- Figure 44: Japan APAC PPS Composites Industry Volume (Million), by Geography 2024 & 2032
- Figure 45: Japan APAC PPS Composites Industry Revenue Share (%), by Geography 2024 & 2032
- Figure 46: Japan APAC PPS Composites Industry Volume Share (%), by Geography 2024 & 2032
- Figure 47: Japan APAC PPS Composites Industry Revenue (Million), by Country 2024 & 2032
- Figure 48: Japan APAC PPS Composites Industry Volume (Million), by Country 2024 & 2032
- Figure 49: Japan APAC PPS Composites Industry Revenue Share (%), by Country 2024 & 2032
- Figure 50: Japan APAC PPS Composites Industry Volume Share (%), by Country 2024 & 2032
- Figure 51: South Korea APAC PPS Composites Industry Revenue (Million), by Type 2024 & 2032
- Figure 52: South Korea APAC PPS Composites Industry Volume (Million), by Type 2024 & 2032
- Figure 53: South Korea APAC PPS Composites Industry Revenue Share (%), by Type 2024 & 2032
- Figure 54: South Korea APAC PPS Composites Industry Volume Share (%), by Type 2024 & 2032
- Figure 55: South Korea APAC PPS Composites Industry Revenue (Million), by End-user Industry 2024 & 2032
- Figure 56: South Korea APAC PPS Composites Industry Volume (Million), by End-user Industry 2024 & 2032
- Figure 57: South Korea APAC PPS Composites Industry Revenue Share (%), by End-user Industry 2024 & 2032
- Figure 58: South Korea APAC PPS Composites Industry Volume Share (%), by End-user Industry 2024 & 2032
- Figure 59: South Korea APAC PPS Composites Industry Revenue (Million), by Geography 2024 & 2032
- Figure 60: South Korea APAC PPS Composites Industry Volume (Million), by Geography 2024 & 2032
- Figure 61: South Korea APAC PPS Composites Industry Revenue Share (%), by Geography 2024 & 2032
- Figure 62: South Korea APAC PPS Composites Industry Volume Share (%), by Geography 2024 & 2032
- Figure 63: South Korea APAC PPS Composites Industry Revenue (Million), by Country 2024 & 2032
- Figure 64: South Korea APAC PPS Composites Industry Volume (Million), by Country 2024 & 2032
- Figure 65: South Korea APAC PPS Composites Industry Revenue Share (%), by Country 2024 & 2032
- Figure 66: South Korea APAC PPS Composites Industry Volume Share (%), by Country 2024 & 2032
- Figure 67: ASEAN Countries APAC PPS Composites Industry Revenue (Million), by Type 2024 & 2032
- Figure 68: ASEAN Countries APAC PPS Composites Industry Volume (Million), by Type 2024 & 2032
- Figure 69: ASEAN Countries APAC PPS Composites Industry Revenue Share (%), by Type 2024 & 2032
- Figure 70: ASEAN Countries APAC PPS Composites Industry Volume Share (%), by Type 2024 & 2032
- Figure 71: ASEAN Countries APAC PPS Composites Industry Revenue (Million), by End-user Industry 2024 & 2032
- Figure 72: ASEAN Countries APAC PPS Composites Industry Volume (Million), by End-user Industry 2024 & 2032
- Figure 73: ASEAN Countries APAC PPS Composites Industry Revenue Share (%), by End-user Industry 2024 & 2032
- Figure 74: ASEAN Countries APAC PPS Composites Industry Volume Share (%), by End-user Industry 2024 & 2032
- Figure 75: ASEAN Countries APAC PPS Composites Industry Revenue (Million), by Geography 2024 & 2032
- Figure 76: ASEAN Countries APAC PPS Composites Industry Volume (Million), by Geography 2024 & 2032
- Figure 77: ASEAN Countries APAC PPS Composites Industry Revenue Share (%), by Geography 2024 & 2032
- Figure 78: ASEAN Countries APAC PPS Composites Industry Volume Share (%), by Geography 2024 & 2032
- Figure 79: ASEAN Countries APAC PPS Composites Industry Revenue (Million), by Country 2024 & 2032
- Figure 80: ASEAN Countries APAC PPS Composites Industry Volume (Million), by Country 2024 & 2032
- Figure 81: ASEAN Countries APAC PPS Composites Industry Revenue Share (%), by Country 2024 & 2032
- Figure 82: ASEAN Countries APAC PPS Composites Industry Volume Share (%), by Country 2024 & 2032
- Figure 83: Rest of Asia Pacific APAC PPS Composites Industry Revenue (Million), by Type 2024 & 2032
- Figure 84: Rest of Asia Pacific APAC PPS Composites Industry Volume (Million), by Type 2024 & 2032
- Figure 85: Rest of Asia Pacific APAC PPS Composites Industry Revenue Share (%), by Type 2024 & 2032
- Figure 86: Rest of Asia Pacific APAC PPS Composites Industry Volume Share (%), by Type 2024 & 2032
- Figure 87: Rest of Asia Pacific APAC PPS Composites Industry Revenue (Million), by End-user Industry 2024 & 2032
- Figure 88: Rest of Asia Pacific APAC PPS Composites Industry Volume (Million), by End-user Industry 2024 & 2032
- Figure 89: Rest of Asia Pacific APAC PPS Composites Industry Revenue Share (%), by End-user Industry 2024 & 2032
- Figure 90: Rest of Asia Pacific APAC PPS Composites Industry Volume Share (%), by End-user Industry 2024 & 2032
- Figure 91: Rest of Asia Pacific APAC PPS Composites Industry Revenue (Million), by Geography 2024 & 2032
- Figure 92: Rest of Asia Pacific APAC PPS Composites Industry Volume (Million), by Geography 2024 & 2032
- Figure 93: Rest of Asia Pacific APAC PPS Composites Industry Revenue Share (%), by Geography 2024 & 2032
- Figure 94: Rest of Asia Pacific APAC PPS Composites Industry Volume Share (%), by Geography 2024 & 2032
- Figure 95: Rest of Asia Pacific APAC PPS Composites Industry Revenue (Million), by Country 2024 & 2032
- Figure 96: Rest of Asia Pacific APAC PPS Composites Industry Volume (Million), by Country 2024 & 2032
- Figure 97: Rest of Asia Pacific APAC PPS Composites Industry Revenue Share (%), by Country 2024 & 2032
- Figure 98: Rest of Asia Pacific APAC PPS Composites Industry Volume Share (%), by Country 2024 & 2032
List of Tables
- Table 1: Global APAC PPS Composites Industry Revenue Million Forecast, by Region 2019 & 2032
- Table 2: Global APAC PPS Composites Industry Volume Million Forecast, by Region 2019 & 2032
- Table 3: Global APAC PPS Composites Industry Revenue Million Forecast, by Type 2019 & 2032
- Table 4: Global APAC PPS Composites Industry Volume Million Forecast, by Type 2019 & 2032
- Table 5: Global APAC PPS Composites Industry Revenue Million Forecast, by End-user Industry 2019 & 2032
- Table 6: Global APAC PPS Composites Industry Volume Million Forecast, by End-user Industry 2019 & 2032
- Table 7: Global APAC PPS Composites Industry Revenue Million Forecast, by Geography 2019 & 2032
- Table 8: Global APAC PPS Composites Industry Volume Million Forecast, by Geography 2019 & 2032
- Table 9: Global APAC PPS Composites Industry Revenue Million Forecast, by Region 2019 & 2032
- Table 10: Global APAC PPS Composites Industry Volume Million Forecast, by Region 2019 & 2032
- Table 11: Global APAC PPS Composites Industry Revenue Million Forecast, by Type 2019 & 2032
- Table 12: Global APAC PPS Composites Industry Volume Million Forecast, by Type 2019 & 2032
- Table 13: Global APAC PPS Composites Industry Revenue Million Forecast, by End-user Industry 2019 & 2032
- Table 14: Global APAC PPS Composites Industry Volume Million Forecast, by End-user Industry 2019 & 2032
- Table 15: Global APAC PPS Composites Industry Revenue Million Forecast, by Geography 2019 & 2032
- Table 16: Global APAC PPS Composites Industry Volume Million Forecast, by Geography 2019 & 2032
- Table 17: Global APAC PPS Composites Industry Revenue Million Forecast, by Country 2019 & 2032
- Table 18: Global APAC PPS Composites Industry Volume Million Forecast, by Country 2019 & 2032
- Table 19: Global APAC PPS Composites Industry Revenue Million Forecast, by Type 2019 & 2032
- Table 20: Global APAC PPS Composites Industry Volume Million Forecast, by Type 2019 & 2032
- Table 21: Global APAC PPS Composites Industry Revenue Million Forecast, by End-user Industry 2019 & 2032
- Table 22: Global APAC PPS Composites Industry Volume Million Forecast, by End-user Industry 2019 & 2032
- Table 23: Global APAC PPS Composites Industry Revenue Million Forecast, by Geography 2019 & 2032
- Table 24: Global APAC PPS Composites Industry Volume Million Forecast, by Geography 2019 & 2032
- Table 25: Global APAC PPS Composites Industry Revenue Million Forecast, by Country 2019 & 2032
- Table 26: Global APAC PPS Composites Industry Volume Million Forecast, by Country 2019 & 2032
- Table 27: Global APAC PPS Composites Industry Revenue Million Forecast, by Type 2019 & 2032
- Table 28: Global APAC PPS Composites Industry Volume Million Forecast, by Type 2019 & 2032
- Table 29: Global APAC PPS Composites Industry Revenue Million Forecast, by End-user Industry 2019 & 2032
- Table 30: Global APAC PPS Composites Industry Volume Million Forecast, by End-user Industry 2019 & 2032
- Table 31: Global APAC PPS Composites Industry Revenue Million Forecast, by Geography 2019 & 2032
- Table 32: Global APAC PPS Composites Industry Volume Million Forecast, by Geography 2019 & 2032
- Table 33: Global APAC PPS Composites Industry Revenue Million Forecast, by Country 2019 & 2032
- Table 34: Global APAC PPS Composites Industry Volume Million Forecast, by Country 2019 & 2032
- Table 35: Global APAC PPS Composites Industry Revenue Million Forecast, by Type 2019 & 2032
- Table 36: Global APAC PPS Composites Industry Volume Million Forecast, by Type 2019 & 2032
- Table 37: Global APAC PPS Composites Industry Revenue Million Forecast, by End-user Industry 2019 & 2032
- Table 38: Global APAC PPS Composites Industry Volume Million Forecast, by End-user Industry 2019 & 2032
- Table 39: Global APAC PPS Composites Industry Revenue Million Forecast, by Geography 2019 & 2032
- Table 40: Global APAC PPS Composites Industry Volume Million Forecast, by Geography 2019 & 2032
- Table 41: Global APAC PPS Composites Industry Revenue Million Forecast, by Country 2019 & 2032
- Table 42: Global APAC PPS Composites Industry Volume Million Forecast, by Country 2019 & 2032
- Table 43: Global APAC PPS Composites Industry Revenue Million Forecast, by Type 2019 & 2032
- Table 44: Global APAC PPS Composites Industry Volume Million Forecast, by Type 2019 & 2032
- Table 45: Global APAC PPS Composites Industry Revenue Million Forecast, by End-user Industry 2019 & 2032
- Table 46: Global APAC PPS Composites Industry Volume Million Forecast, by End-user Industry 2019 & 2032
- Table 47: Global APAC PPS Composites Industry Revenue Million Forecast, by Geography 2019 & 2032
- Table 48: Global APAC PPS Composites Industry Volume Million Forecast, by Geography 2019 & 2032
- Table 49: Global APAC PPS Composites Industry Revenue Million Forecast, by Country 2019 & 2032
- Table 50: Global APAC PPS Composites Industry Volume Million Forecast, by Country 2019 & 2032
- Table 51: Global APAC PPS Composites Industry Revenue Million Forecast, by Type 2019 & 2032
- Table 52: Global APAC PPS Composites Industry Volume Million Forecast, by Type 2019 & 2032
- Table 53: Global APAC PPS Composites Industry Revenue Million Forecast, by End-user Industry 2019 & 2032
- Table 54: Global APAC PPS Composites Industry Volume Million Forecast, by End-user Industry 2019 & 2032
- Table 55: Global APAC PPS Composites Industry Revenue Million Forecast, by Geography 2019 & 2032
- Table 56: Global APAC PPS Composites Industry Volume Million Forecast, by Geography 2019 & 2032
- Table 57: Global APAC PPS Composites Industry Revenue Million Forecast, by Country 2019 & 2032
- Table 58: Global APAC PPS Composites Industry Volume Million Forecast, by Country 2019 & 2032
Frequently Asked Questions
1. What is the projected Compound Annual Growth Rate (CAGR) of the APAC PPS Composites Industry?
The projected CAGR is approximately > 9.00%.
2. Which companies are prominent players in the APAC PPS Composites Industry?
Key companies in the market include British Plastics Federation, Celanese Corporation, DIC Corporation, Ensinger, KOLON PLASTICS INC, KUREHA CORPORATION, Polyplastics Co Ltd, RTP Company, SABIC, SGL Carbon, Solvay, STARCHEM LLC, Teijin Limited, Tosoh Corporation, Xiamen LFT Composite Plastic Co Ltd*List Not Exhaustive.
3. What are the main segments of the APAC PPS Composites Industry?
The market segments include Type, End-user Industry, Geography.
4. Can you provide details about the market size?
The market size is estimated to be USD 606.90 Million as of 2022.
5. What are some drivers contributing to market growth?
Rising Demand from Aerospace and Defense; Increasing Demand from Oil and Gas Sector; Other Drivers.
6. What are the notable trends driving market growth?
Aerospace and Defense Sector to Drive the Polyphenylene Sulfide (PPS) Composites Market.
7. Are there any restraints impacting market growth?
Rising Demand from Aerospace and Defense; Increasing Demand from Oil and Gas Sector; Other Drivers.
8. Can you provide examples of recent developments in the market?
November 2022: Polyplastics Co., Ltd. expanded its compound capacity of (Nantong) Ltd., the PPS resin production plant. The newly expanded capacity will meet the demand for engineering plastics worldwide and increase the annual production capacity from 9,000 to 21,400 tons. The new manufacturing plant will be in operation from January 2025.
9. What pricing options are available for accessing the report?
Pricing options include single-user, multi-user, and enterprise licenses priced at USD 4750, USD 5250, and USD 8750 respectively.
10. Is the market size provided in terms of value or volume?
The market size is provided in terms of value, measured in Million and volume, measured in Million.
11. Are there any specific market keywords associated with the report?
Yes, the market keyword associated with the report is "APAC PPS Composites Industry," which aids in identifying and referencing the specific market segment covered.
12. How do I determine which pricing option suits my needs best?
The pricing options vary based on user requirements and access needs. Individual users may opt for single-user licenses, while businesses requiring broader access may choose multi-user or enterprise licenses for cost-effective access to the report.
13. Are there any additional resources or data provided in the APAC PPS Composites Industry report?
While the report offers comprehensive insights, it's advisable to review the specific contents or supplementary materials provided to ascertain if additional resources or data are available.
14. How can I stay updated on further developments or reports in the APAC PPS Composites Industry?
To stay informed about further developments, trends, and reports in the APAC PPS Composites Industry, consider subscribing to industry newsletters, following relevant companies and organizations, or regularly checking reputable industry news sources and publications.
Methodology
Step 1 - Identification of Relevant Samples Size from Population Database


Step 2 - Approaches for Defining Global Market Size (Value, Volume* & Price*)

Note*: In applicable scenarios
Step 3 - Data Sources
Primary Research
- Web Analytics
- Survey Reports
- Research Institute
- Latest Research Reports
- Opinion Leaders
Secondary Research
- Annual Reports
- White Paper
- Latest Press Release
- Industry Association
- Paid Database
- Investor Presentations

Step 4 - Data Triangulation
Involves using different sources of information in order to increase the validity of a study
These sources are likely to be stakeholders in a program - participants, other researchers, program staff, other community members, and so on.
Then we put all data in single framework & apply various statistical tools to find out the dynamic on the market.
During the analysis stage, feedback from the stakeholder groups would be compared to determine areas of agreement as well as areas of divergence


