
Key Insights
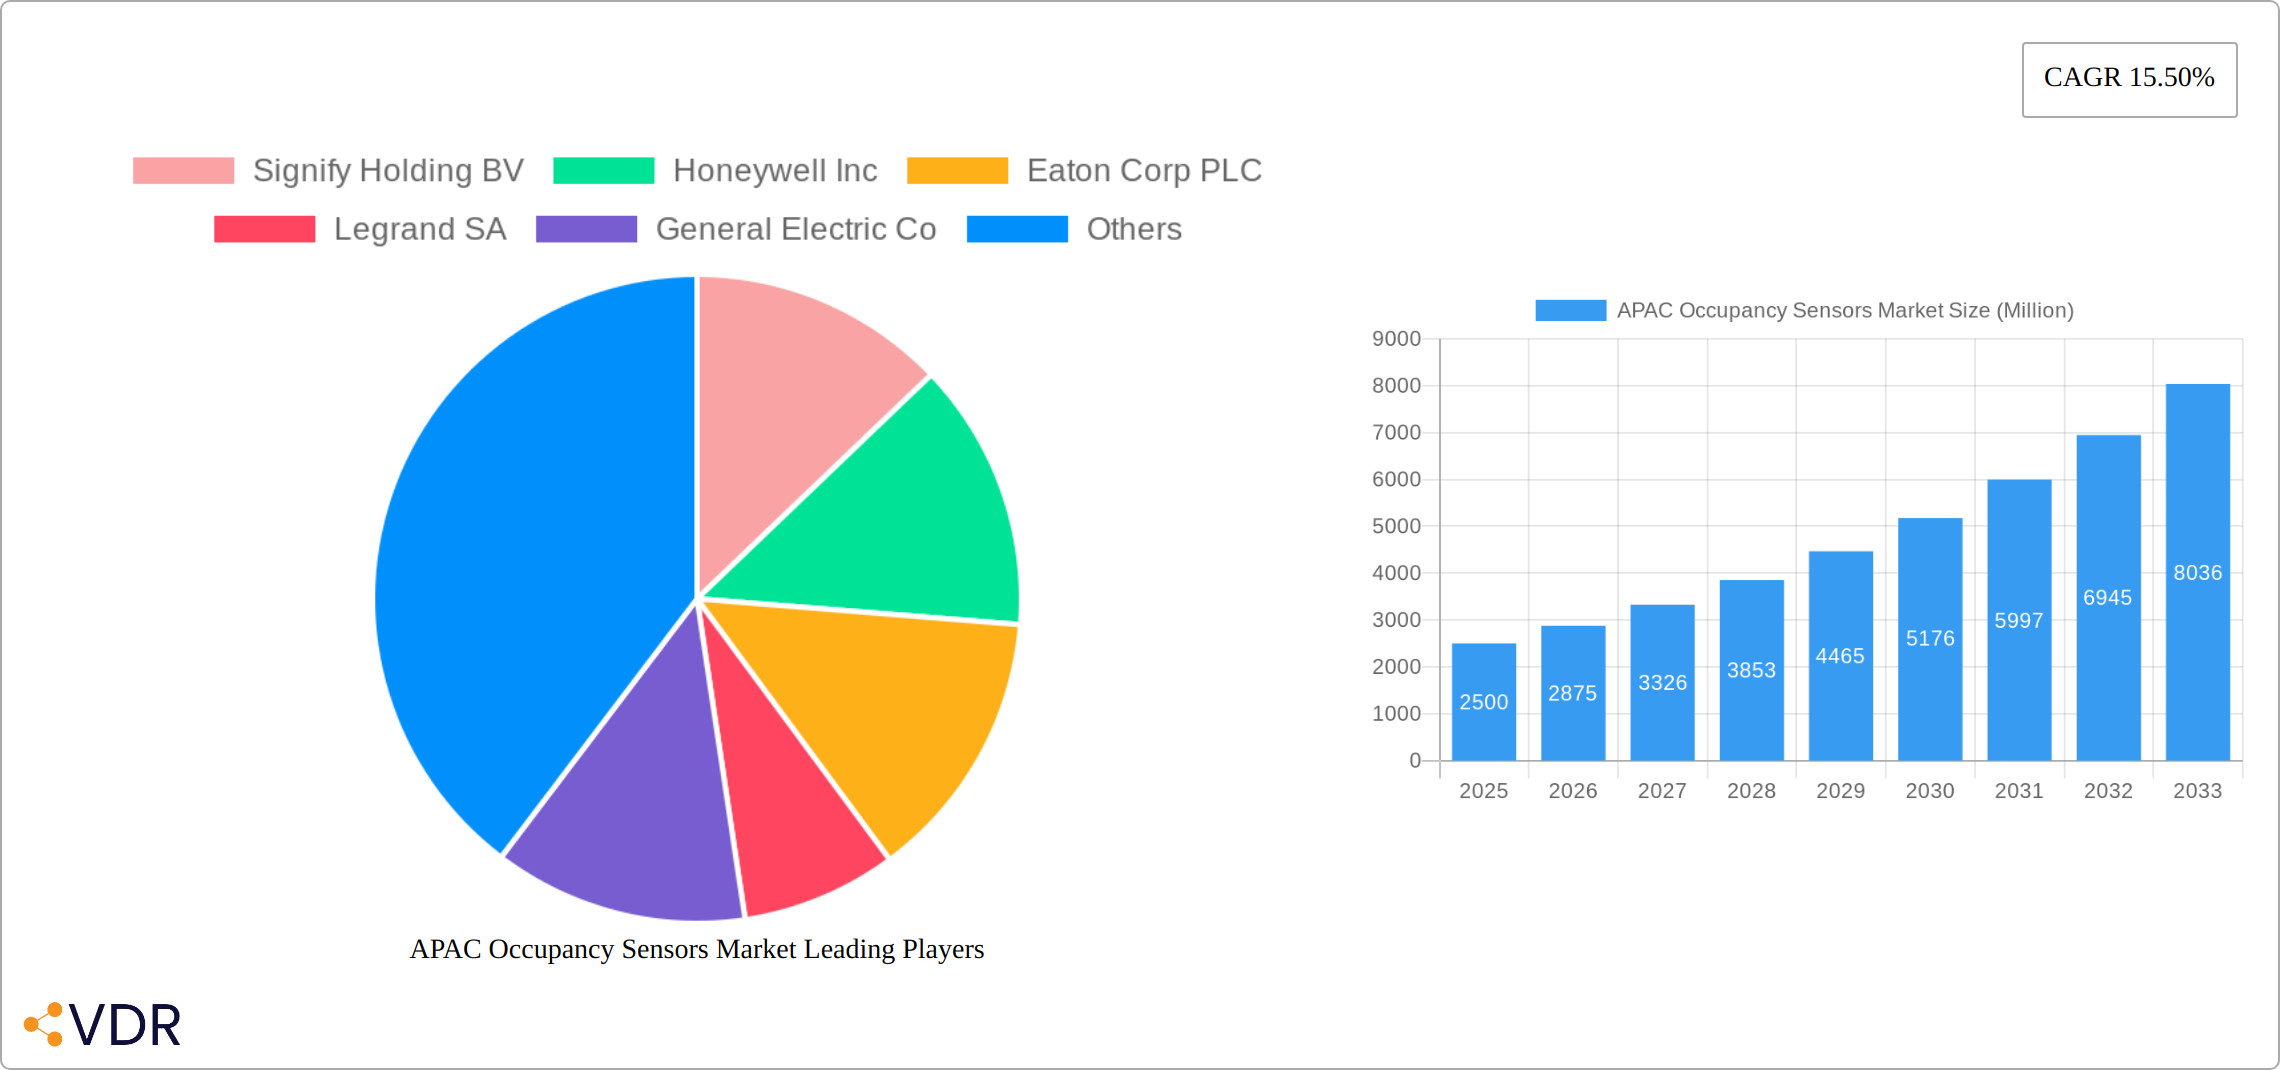
The Asia-Pacific (APAC) occupancy sensor market is experiencing robust growth, driven by increasing automation in commercial and residential buildings, rising energy efficiency concerns, and the growing adoption of smart building technologies. The market's Compound Annual Growth Rate (CAGR) of 15.50% from 2019 to 2024 suggests a significant expansion, and this momentum is expected to continue through 2033. Key drivers include the increasing demand for energy-efficient solutions, stringent government regulations promoting sustainable building practices, and the rising adoption of smart home and building automation systems across the region. China, Japan, and India are the major contributors to this growth, reflecting their large construction sectors and expanding middle classes. The wireless segment is witnessing particularly strong growth due to its ease of installation and flexibility compared to wired systems. Within technologies, passive infrared (PIR) sensors dominate due to their cost-effectiveness and reliability, while ultrasonic and microwave sensors are finding niche applications. The market segmentation reveals significant opportunities across various applications, including lighting control, HVAC systems, and security and surveillance, with the commercial sector leading the demand. However, factors like high initial investment costs for sensor installations and potential privacy concerns could act as market restraints.
Looking ahead, the APAC occupancy sensor market is poised for considerable expansion. Continued urbanization, smart city initiatives, and the increasing adoption of IoT (Internet of Things) technologies will further fuel market growth. The focus is shifting towards advanced sensor technologies with enhanced features like occupancy detection accuracy, integration capabilities, and data analytics. Companies are increasingly focusing on developing innovative and cost-effective solutions tailored to the specific needs of different market segments. Competition is intense, with established players like Signify, Honeywell, and Schneider Electric facing competition from emerging technology providers offering specialized and innovative sensor technologies. This competitive landscape fosters innovation and drives down prices, ultimately benefitting end-users. The integration of AI and machine learning in occupancy sensors is an emerging trend, promising improved accuracy and energy efficiency in the years to come.
APAC Occupancy Sensors Market: A Comprehensive Market Report (2019-2033)
This comprehensive report provides an in-depth analysis of the Asia-Pacific (APAC) Occupancy Sensors Market, offering valuable insights for industry professionals, investors, and strategic decision-makers. The study covers the period from 2019 to 2033, with a focus on the forecast period of 2025-2033 and a base year of 2025. The market is segmented by network type (wired, wireless), technology (ultrasonic, passive infrared, microwave), application (lighting control, HVAC, security and surveillance), building type (residential, commercial), and country (China, Japan, India, Rest of Asia Pacific). Key players analyzed include Signify Holding BV, Honeywell Inc, Eaton Corp PLC, Legrand SA, General Electric Co, Dwyer Instruments Inc, Schneider Electric SE, Johnson Controls Inc, Analog Devices Inc, and Texas Instruments Inc. The report presents data in million units.
APAC Occupancy Sensors Market Dynamics & Structure
The APAC occupancy sensors market exhibits a moderately concentrated structure, with several large multinational corporations and regional players vying for market share. Technological innovation, particularly in IoT integration and AI-powered analytics, is a key driver. Stringent energy efficiency regulations across various APAC countries are further propelling market growth. Competition from alternative technologies like manual controls is minimal due to the clear benefits of automated occupancy detection. The end-user demographics are expanding rapidly, fueled by rising urbanization and increasing adoption of smart building technologies across commercial and residential sectors. Mergers and acquisitions (M&A) activity has been moderate, primarily focused on consolidating technological capabilities and expanding geographical reach.
- Market Concentration: Moderately concentrated, with top 5 players holding xx% market share in 2024.
- Innovation Drivers: IoT integration, AI-powered analytics, energy efficiency regulations.
- Regulatory Landscape: Favorable regulations promoting energy efficiency in several APAC countries.
- Competitive Substitutes: Minimal threat from manual controls.
- M&A Activity: Moderate activity focusing on technological and geographic expansion; xx deals in the past five years.
- Innovation Barriers: High initial investment costs for advanced sensor technologies can hinder adoption in certain segments.
APAC Occupancy Sensors Market Growth Trends & Insights
The APAC occupancy sensors market has witnessed significant growth over the historical period (2019-2024), driven by factors such as increasing awareness of energy efficiency, rising construction activity, and the growing adoption of smart building technologies. The market size is estimated at xx million units in 2025 and is projected to reach xx million units by 2033, exhibiting a CAGR of xx% during the forecast period. This growth is attributed to increased adoption rates in both commercial and residential buildings, technological advancements leading to enhanced performance and functionalities, and shifting consumer behavior towards energy-efficient solutions. Specific trends include a strong preference for wireless solutions and increasing demand for sophisticated features like room-level occupancy monitoring and integration with building management systems (BMS).
- Market Size Evolution: xx million units (2025) to xx million units (2033)
- Adoption Rates: xx% penetration in commercial buildings (2025), projected to reach xx% by 2033.
- Technological Disruptions: Rise of IoT-enabled sensors with advanced analytics capabilities.
- Consumer Behavior Shifts: Increased demand for energy-efficient and smart building solutions.

Dominant Regions, Countries, or Segments in APAC Occupancy Sensors Market
China dominates the APAC occupancy sensors market, accounting for xx% of the total market share in 2025, followed by Japan and India. This dominance is attributed to factors like rapid urbanization, significant construction activity, and supportive government policies promoting energy efficiency. Within the segments, the wireless network type and passive infrared technology dominate, owing to their cost-effectiveness and ease of installation. The commercial building segment shows the highest adoption rate, driven by the need for optimized energy management in large-scale facilities. Lighting control remains the dominant application segment, followed by HVAC and security & surveillance.
- Dominant Region: China, driven by rapid urbanization, construction activity, and governmental support.
- Key Country Drivers:
- China: Massive construction projects and government initiatives towards smart cities.
- Japan: High adoption of advanced building technologies and emphasis on energy efficiency.
- India: Growing urbanization and increasing investment in commercial infrastructure.
- Dominant Segment: Wireless network type and Passive Infrared technology; Commercial buildings; Lighting control applications.
- Growth Potential: High growth potential in the Rest of Asia Pacific region due to increasing infrastructure development.
APAP Occupancy Sensors Market Product Landscape
The APAC occupancy sensors market showcases a wide array of products, ranging from basic occupancy detectors to sophisticated IoT-enabled sensors capable of collecting comprehensive environmental data. Product innovation focuses on enhancing accuracy, reliability, and integration capabilities. Key advancements include miniaturization, improved energy efficiency, and enhanced data analytics functionalities, enabling seamless integration with Building Management Systems (BMS). Many sensors offer unique selling propositions such as extended battery life, versatile mounting options, and advanced reporting features.
Key Drivers, Barriers & Challenges in APAC Occupancy Sensors Market
Key Drivers: Rising energy costs, stringent government regulations promoting energy efficiency, increasing adoption of smart building technologies, growing demand for enhanced security and surveillance systems, and technological advancements leading to improved product performance and features.
Key Challenges & Restraints: High initial investment costs can hinder adoption, especially in smaller projects or residential settings. Interoperability issues between different sensor technologies and BMS systems can create integration challenges. The complexities of large-scale deployments can impact adoption in commercial settings. Concerns around data privacy and security related to the collection and transmission of occupancy data can present a barrier.
Emerging Opportunities in APAP Occupancy Sensors Market
The market presents significant opportunities in untapped markets within the Rest of Asia Pacific region, particularly in Southeast Asia and South Asia. Innovative applications of occupancy sensors, such as integrating them with AI-powered systems for predictive maintenance and enhanced building automation, present strong growth potential. Evolving consumer preferences towards sustainable and smart homes are driving demand for energy-efficient solutions in the residential segment. Expansion into niche applications like smart healthcare and smart retail offers additional prospects.
Growth Accelerators in the APAC Occupancy Sensors Market Industry
Technological breakthroughs, especially in low-power wide-area networks (LPWAN) technology for wireless sensors, and development of advanced analytics capabilities for real-time data processing, will significantly accelerate market growth. Strategic partnerships between sensor manufacturers and building automation companies facilitate the integration of occupancy sensors into comprehensive smart building solutions. Market expansion strategies focusing on emerging markets and increasing product awareness through targeted marketing campaigns will be crucial for continued market growth.
Key Players Shaping the APAC Occupancy Sensors Market Market
- Signify Holding BV
- Honeywell Inc
- Eaton Corp PLC
- Legrand SA
- General Electric Co
- Dwyer Instruments Inc
- Schneider Electric SE
- Johnson Controls Inc
- Analog Devices Inc
- Texas Instruments Inc
- *List Not Exhaustive
Notable Milestones in APAC Occupancy Sensors Market Sector
- March 2020: Signify introduced new Philips IoT sensor packages that gather and deliver data via the Interact Office connected lighting system and environmental monitoring APIs. These bundles observe occupancy, the number of people in a room, temperature (room and desk level), noise levels, daylight levels, relative humidity, and are Bluetooth enabled, allowing for indoor positioning and navigation. This launch significantly boosted the adoption of advanced IoT-integrated occupancy sensors.
In-Depth APAC Occupancy Sensors Market Outlook
The APAC occupancy sensors market is poised for significant growth over the forecast period, driven by sustained investments in smart building infrastructure, increasing demand for energy-efficient solutions, and technological advancements. Strategic opportunities exist in expanding into untapped markets, developing innovative sensor applications, and fostering strategic partnerships to create comprehensive smart building ecosystems. The market’s future potential is substantial, presenting significant opportunities for both established players and new entrants.
APAC Occupancy Sensors Market Segmentation
-
1. Network Type
- 1.1. Wired
- 1.2. Wireless
-
2. Technology
- 2.1. Ultrasonic
- 2.2. Passive Infrared
- 2.3. Microwave
-
3. Application
- 3.1. Lighting Control
- 3.2. HVAC
- 3.3. Security and Surveillance
-
4. Building Type
- 4.1. Residential
- 4.2. Commercial
APAC Occupancy Sensors Market Segmentation By Geography
-
1. North America
- 1.1. United States
- 1.2. Canada
- 1.3. Mexico
-
2. South America
- 2.1. Brazil
- 2.2. Argentina
- 2.3. Rest of South America
-
3. Europe
- 3.1. United Kingdom
- 3.2. Germany
- 3.3. France
- 3.4. Italy
- 3.5. Spain
- 3.6. Russia
- 3.7. Benelux
- 3.8. Nordics
- 3.9. Rest of Europe
-
4. Middle East & Africa
- 4.1. Turkey
- 4.2. Israel
- 4.3. GCC
- 4.4. North Africa
- 4.5. South Africa
- 4.6. Rest of Middle East & Africa
-
5. Asia Pacific
- 5.1. China
- 5.2. India
- 5.3. Japan
- 5.4. South Korea
- 5.5. ASEAN
- 5.6. Oceania
- 5.7. Rest of Asia Pacific

APAC Occupancy Sensors Market REPORT HIGHLIGHTS
| Aspects | Details |
|---|---|
| Study Period | 2019-2033 |
| Base Year | 2024 |
| Estimated Year | 2025 |
| Forecast Period | 2025-2033 |
| Historical Period | 2019-2024 |
| Growth Rate | CAGR of 15.50% from 2019-2033 |
| Segmentation |
|
Table of Contents
- 1. Introduction
- 1.1. Research Scope
- 1.2. Market Segmentation
- 1.3. Research Methodology
- 1.4. Definitions and Assumptions
- 2. Executive Summary
- 2.1. Introduction
- 3. Market Dynamics
- 3.1. Introduction
- 3.2. Market Drivers
- 3.2.1. Rising Demand for Energy Efficient Devices; Demand for Passive Infrared Due to Low Cost and High Energy Efficiency
- 3.3. Market Restrains
- 3.3.1. Cryptojacking Threats
- 3.4. Market Trends
- 3.4.1. Residential Expected to Witness Significant Growth
- 4. Market Factor Analysis
- 4.1. Porters Five Forces
- 4.2. Supply/Value Chain
- 4.3. PESTEL analysis
- 4.4. Market Entropy
- 4.5. Patent/Trademark Analysis
- 5. Global APAC Occupancy Sensors Market Analysis, Insights and Forecast, 2019-2031
- 5.1. Market Analysis, Insights and Forecast - by Network Type
- 5.1.1. Wired
- 5.1.2. Wireless
- 5.2. Market Analysis, Insights and Forecast - by Technology
- 5.2.1. Ultrasonic
- 5.2.2. Passive Infrared
- 5.2.3. Microwave
- 5.3. Market Analysis, Insights and Forecast - by Application
- 5.3.1. Lighting Control
- 5.3.2. HVAC
- 5.3.3. Security and Surveillance
- 5.4. Market Analysis, Insights and Forecast - by Building Type
- 5.4.1. Residential
- 5.4.2. Commercial
- 5.5. Market Analysis, Insights and Forecast - by Region
- 5.5.1. North America
- 5.5.2. South America
- 5.5.3. Europe
- 5.5.4. Middle East & Africa
- 5.5.5. Asia Pacific
- 5.1. Market Analysis, Insights and Forecast - by Network Type
- 6. North America APAC Occupancy Sensors Market Analysis, Insights and Forecast, 2019-2031
- 6.1. Market Analysis, Insights and Forecast - by Network Type
- 6.1.1. Wired
- 6.1.2. Wireless
- 6.2. Market Analysis, Insights and Forecast - by Technology
- 6.2.1. Ultrasonic
- 6.2.2. Passive Infrared
- 6.2.3. Microwave
- 6.3. Market Analysis, Insights and Forecast - by Application
- 6.3.1. Lighting Control
- 6.3.2. HVAC
- 6.3.3. Security and Surveillance
- 6.4. Market Analysis, Insights and Forecast - by Building Type
- 6.4.1. Residential
- 6.4.2. Commercial
- 6.1. Market Analysis, Insights and Forecast - by Network Type
- 7. South America APAC Occupancy Sensors Market Analysis, Insights and Forecast, 2019-2031
- 7.1. Market Analysis, Insights and Forecast - by Network Type
- 7.1.1. Wired
- 7.1.2. Wireless
- 7.2. Market Analysis, Insights and Forecast - by Technology
- 7.2.1. Ultrasonic
- 7.2.2. Passive Infrared
- 7.2.3. Microwave
- 7.3. Market Analysis, Insights and Forecast - by Application
- 7.3.1. Lighting Control
- 7.3.2. HVAC
- 7.3.3. Security and Surveillance
- 7.4. Market Analysis, Insights and Forecast - by Building Type
- 7.4.1. Residential
- 7.4.2. Commercial
- 7.1. Market Analysis, Insights and Forecast - by Network Type
- 8. Europe APAC Occupancy Sensors Market Analysis, Insights and Forecast, 2019-2031
- 8.1. Market Analysis, Insights and Forecast - by Network Type
- 8.1.1. Wired
- 8.1.2. Wireless
- 8.2. Market Analysis, Insights and Forecast - by Technology
- 8.2.1. Ultrasonic
- 8.2.2. Passive Infrared
- 8.2.3. Microwave
- 8.3. Market Analysis, Insights and Forecast - by Application
- 8.3.1. Lighting Control
- 8.3.2. HVAC
- 8.3.3. Security and Surveillance
- 8.4. Market Analysis, Insights and Forecast - by Building Type
- 8.4.1. Residential
- 8.4.2. Commercial
- 8.1. Market Analysis, Insights and Forecast - by Network Type
- 9. Middle East & Africa APAC Occupancy Sensors Market Analysis, Insights and Forecast, 2019-2031
- 9.1. Market Analysis, Insights and Forecast - by Network Type
- 9.1.1. Wired
- 9.1.2. Wireless
- 9.2. Market Analysis, Insights and Forecast - by Technology
- 9.2.1. Ultrasonic
- 9.2.2. Passive Infrared
- 9.2.3. Microwave
- 9.3. Market Analysis, Insights and Forecast - by Application
- 9.3.1. Lighting Control
- 9.3.2. HVAC
- 9.3.3. Security and Surveillance
- 9.4. Market Analysis, Insights and Forecast - by Building Type
- 9.4.1. Residential
- 9.4.2. Commercial
- 9.1. Market Analysis, Insights and Forecast - by Network Type
- 10. Asia Pacific APAC Occupancy Sensors Market Analysis, Insights and Forecast, 2019-2031
- 10.1. Market Analysis, Insights and Forecast - by Network Type
- 10.1.1. Wired
- 10.1.2. Wireless
- 10.2. Market Analysis, Insights and Forecast - by Technology
- 10.2.1. Ultrasonic
- 10.2.2. Passive Infrared
- 10.2.3. Microwave
- 10.3. Market Analysis, Insights and Forecast - by Application
- 10.3.1. Lighting Control
- 10.3.2. HVAC
- 10.3.3. Security and Surveillance
- 10.4. Market Analysis, Insights and Forecast - by Building Type
- 10.4.1. Residential
- 10.4.2. Commercial
- 10.1. Market Analysis, Insights and Forecast - by Network Type
- 11. North America APAC Occupancy Sensors Market Analysis, Insights and Forecast, 2019-2031
- 11.1. Market Analysis, Insights and Forecast - By Country/Sub-region
- 11.1.1.
- 12. Europe APAC Occupancy Sensors Market Analysis, Insights and Forecast, 2019-2031
- 12.1. Market Analysis, Insights and Forecast - By Country/Sub-region
- 12.1.1.
- 13. Asia Pacific APAC Occupancy Sensors Market Analysis, Insights and Forecast, 2019-2031
- 13.1. Market Analysis, Insights and Forecast - By Country/Sub-region
- 13.1.1.
- 14. Latin America APAC Occupancy Sensors Market Analysis, Insights and Forecast, 2019-2031
- 14.1. Market Analysis, Insights and Forecast - By Country/Sub-region
- 14.1.1.
- 15. Middle East and Africa APAC Occupancy Sensors Market Analysis, Insights and Forecast, 2019-2031
- 15.1. Market Analysis, Insights and Forecast - By Country/Sub-region
- 15.1.1.
- 16. Competitive Analysis
- 16.1. Global Market Share Analysis 2024
- 16.2. Company Profiles
- 16.2.1 Signify Holding BV
- 16.2.1.1. Overview
- 16.2.1.2. Products
- 16.2.1.3. SWOT Analysis
- 16.2.1.4. Recent Developments
- 16.2.1.5. Financials (Based on Availability)
- 16.2.2 Honeywell Inc
- 16.2.2.1. Overview
- 16.2.2.2. Products
- 16.2.2.3. SWOT Analysis
- 16.2.2.4. Recent Developments
- 16.2.2.5. Financials (Based on Availability)
- 16.2.3 Eaton Corp PLC
- 16.2.3.1. Overview
- 16.2.3.2. Products
- 16.2.3.3. SWOT Analysis
- 16.2.3.4. Recent Developments
- 16.2.3.5. Financials (Based on Availability)
- 16.2.4 Legrand SA
- 16.2.4.1. Overview
- 16.2.4.2. Products
- 16.2.4.3. SWOT Analysis
- 16.2.4.4. Recent Developments
- 16.2.4.5. Financials (Based on Availability)
- 16.2.5 General Electric Co
- 16.2.5.1. Overview
- 16.2.5.2. Products
- 16.2.5.3. SWOT Analysis
- 16.2.5.4. Recent Developments
- 16.2.5.5. Financials (Based on Availability)
- 16.2.6 Dwyer Instruments Inc
- 16.2.6.1. Overview
- 16.2.6.2. Products
- 16.2.6.3. SWOT Analysis
- 16.2.6.4. Recent Developments
- 16.2.6.5. Financials (Based on Availability)
- 16.2.7 Schneider Electric SE
- 16.2.7.1. Overview
- 16.2.7.2. Products
- 16.2.7.3. SWOT Analysis
- 16.2.7.4. Recent Developments
- 16.2.7.5. Financials (Based on Availability)
- 16.2.8 Johnson Controls Inc
- 16.2.8.1. Overview
- 16.2.8.2. Products
- 16.2.8.3. SWOT Analysis
- 16.2.8.4. Recent Developments
- 16.2.8.5. Financials (Based on Availability)
- 16.2.9 Analog Devices Inc
- 16.2.9.1. Overview
- 16.2.9.2. Products
- 16.2.9.3. SWOT Analysis
- 16.2.9.4. Recent Developments
- 16.2.9.5. Financials (Based on Availability)
- 16.2.10 Texas Instruments Inc*List Not Exhaustive
- 16.2.10.1. Overview
- 16.2.10.2. Products
- 16.2.10.3. SWOT Analysis
- 16.2.10.4. Recent Developments
- 16.2.10.5. Financials (Based on Availability)
- 16.2.1 Signify Holding BV
List of Figures
- Figure 1: Global APAC Occupancy Sensors Market Revenue Breakdown (Million, %) by Region 2024 & 2032
- Figure 2: North America APAC Occupancy Sensors Market Revenue (Million), by Country 2024 & 2032
- Figure 3: North America APAC Occupancy Sensors Market Revenue Share (%), by Country 2024 & 2032
- Figure 4: Europe APAC Occupancy Sensors Market Revenue (Million), by Country 2024 & 2032
- Figure 5: Europe APAC Occupancy Sensors Market Revenue Share (%), by Country 2024 & 2032
- Figure 6: Asia Pacific APAC Occupancy Sensors Market Revenue (Million), by Country 2024 & 2032
- Figure 7: Asia Pacific APAC Occupancy Sensors Market Revenue Share (%), by Country 2024 & 2032
- Figure 8: Latin America APAC Occupancy Sensors Market Revenue (Million), by Country 2024 & 2032
- Figure 9: Latin America APAC Occupancy Sensors Market Revenue Share (%), by Country 2024 & 2032
- Figure 10: Middle East and Africa APAC Occupancy Sensors Market Revenue (Million), by Country 2024 & 2032
- Figure 11: Middle East and Africa APAC Occupancy Sensors Market Revenue Share (%), by Country 2024 & 2032
- Figure 12: North America APAC Occupancy Sensors Market Revenue (Million), by Network Type 2024 & 2032
- Figure 13: North America APAC Occupancy Sensors Market Revenue Share (%), by Network Type 2024 & 2032
- Figure 14: North America APAC Occupancy Sensors Market Revenue (Million), by Technology 2024 & 2032
- Figure 15: North America APAC Occupancy Sensors Market Revenue Share (%), by Technology 2024 & 2032
- Figure 16: North America APAC Occupancy Sensors Market Revenue (Million), by Application 2024 & 2032
- Figure 17: North America APAC Occupancy Sensors Market Revenue Share (%), by Application 2024 & 2032
- Figure 18: North America APAC Occupancy Sensors Market Revenue (Million), by Building Type 2024 & 2032
- Figure 19: North America APAC Occupancy Sensors Market Revenue Share (%), by Building Type 2024 & 2032
- Figure 20: North America APAC Occupancy Sensors Market Revenue (Million), by Country 2024 & 2032
- Figure 21: North America APAC Occupancy Sensors Market Revenue Share (%), by Country 2024 & 2032
- Figure 22: South America APAC Occupancy Sensors Market Revenue (Million), by Network Type 2024 & 2032
- Figure 23: South America APAC Occupancy Sensors Market Revenue Share (%), by Network Type 2024 & 2032
- Figure 24: South America APAC Occupancy Sensors Market Revenue (Million), by Technology 2024 & 2032
- Figure 25: South America APAC Occupancy Sensors Market Revenue Share (%), by Technology 2024 & 2032
- Figure 26: South America APAC Occupancy Sensors Market Revenue (Million), by Application 2024 & 2032
- Figure 27: South America APAC Occupancy Sensors Market Revenue Share (%), by Application 2024 & 2032
- Figure 28: South America APAC Occupancy Sensors Market Revenue (Million), by Building Type 2024 & 2032
- Figure 29: South America APAC Occupancy Sensors Market Revenue Share (%), by Building Type 2024 & 2032
- Figure 30: South America APAC Occupancy Sensors Market Revenue (Million), by Country 2024 & 2032
- Figure 31: South America APAC Occupancy Sensors Market Revenue Share (%), by Country 2024 & 2032
- Figure 32: Europe APAC Occupancy Sensors Market Revenue (Million), by Network Type 2024 & 2032
- Figure 33: Europe APAC Occupancy Sensors Market Revenue Share (%), by Network Type 2024 & 2032
- Figure 34: Europe APAC Occupancy Sensors Market Revenue (Million), by Technology 2024 & 2032
- Figure 35: Europe APAC Occupancy Sensors Market Revenue Share (%), by Technology 2024 & 2032
- Figure 36: Europe APAC Occupancy Sensors Market Revenue (Million), by Application 2024 & 2032
- Figure 37: Europe APAC Occupancy Sensors Market Revenue Share (%), by Application 2024 & 2032
- Figure 38: Europe APAC Occupancy Sensors Market Revenue (Million), by Building Type 2024 & 2032
- Figure 39: Europe APAC Occupancy Sensors Market Revenue Share (%), by Building Type 2024 & 2032
- Figure 40: Europe APAC Occupancy Sensors Market Revenue (Million), by Country 2024 & 2032
- Figure 41: Europe APAC Occupancy Sensors Market Revenue Share (%), by Country 2024 & 2032
- Figure 42: Middle East & Africa APAC Occupancy Sensors Market Revenue (Million), by Network Type 2024 & 2032
- Figure 43: Middle East & Africa APAC Occupancy Sensors Market Revenue Share (%), by Network Type 2024 & 2032
- Figure 44: Middle East & Africa APAC Occupancy Sensors Market Revenue (Million), by Technology 2024 & 2032
- Figure 45: Middle East & Africa APAC Occupancy Sensors Market Revenue Share (%), by Technology 2024 & 2032
- Figure 46: Middle East & Africa APAC Occupancy Sensors Market Revenue (Million), by Application 2024 & 2032
- Figure 47: Middle East & Africa APAC Occupancy Sensors Market Revenue Share (%), by Application 2024 & 2032
- Figure 48: Middle East & Africa APAC Occupancy Sensors Market Revenue (Million), by Building Type 2024 & 2032
- Figure 49: Middle East & Africa APAC Occupancy Sensors Market Revenue Share (%), by Building Type 2024 & 2032
- Figure 50: Middle East & Africa APAC Occupancy Sensors Market Revenue (Million), by Country 2024 & 2032
- Figure 51: Middle East & Africa APAC Occupancy Sensors Market Revenue Share (%), by Country 2024 & 2032
- Figure 52: Asia Pacific APAC Occupancy Sensors Market Revenue (Million), by Network Type 2024 & 2032
- Figure 53: Asia Pacific APAC Occupancy Sensors Market Revenue Share (%), by Network Type 2024 & 2032
- Figure 54: Asia Pacific APAC Occupancy Sensors Market Revenue (Million), by Technology 2024 & 2032
- Figure 55: Asia Pacific APAC Occupancy Sensors Market Revenue Share (%), by Technology 2024 & 2032
- Figure 56: Asia Pacific APAC Occupancy Sensors Market Revenue (Million), by Application 2024 & 2032
- Figure 57: Asia Pacific APAC Occupancy Sensors Market Revenue Share (%), by Application 2024 & 2032
- Figure 58: Asia Pacific APAC Occupancy Sensors Market Revenue (Million), by Building Type 2024 & 2032
- Figure 59: Asia Pacific APAC Occupancy Sensors Market Revenue Share (%), by Building Type 2024 & 2032
- Figure 60: Asia Pacific APAC Occupancy Sensors Market Revenue (Million), by Country 2024 & 2032
- Figure 61: Asia Pacific APAC Occupancy Sensors Market Revenue Share (%), by Country 2024 & 2032
List of Tables
- Table 1: Global APAC Occupancy Sensors Market Revenue Million Forecast, by Region 2019 & 2032
- Table 2: Global APAC Occupancy Sensors Market Revenue Million Forecast, by Network Type 2019 & 2032
- Table 3: Global APAC Occupancy Sensors Market Revenue Million Forecast, by Technology 2019 & 2032
- Table 4: Global APAC Occupancy Sensors Market Revenue Million Forecast, by Application 2019 & 2032
- Table 5: Global APAC Occupancy Sensors Market Revenue Million Forecast, by Building Type 2019 & 2032
- Table 6: Global APAC Occupancy Sensors Market Revenue Million Forecast, by Region 2019 & 2032
- Table 7: Global APAC Occupancy Sensors Market Revenue Million Forecast, by Country 2019 & 2032
- Table 8: APAC Occupancy Sensors Market Revenue (Million) Forecast, by Application 2019 & 2032
- Table 9: Global APAC Occupancy Sensors Market Revenue Million Forecast, by Country 2019 & 2032
- Table 10: APAC Occupancy Sensors Market Revenue (Million) Forecast, by Application 2019 & 2032
- Table 11: Global APAC Occupancy Sensors Market Revenue Million Forecast, by Country 2019 & 2032
- Table 12: APAC Occupancy Sensors Market Revenue (Million) Forecast, by Application 2019 & 2032
- Table 13: Global APAC Occupancy Sensors Market Revenue Million Forecast, by Country 2019 & 2032
- Table 14: APAC Occupancy Sensors Market Revenue (Million) Forecast, by Application 2019 & 2032
- Table 15: Global APAC Occupancy Sensors Market Revenue Million Forecast, by Country 2019 & 2032
- Table 16: APAC Occupancy Sensors Market Revenue (Million) Forecast, by Application 2019 & 2032
- Table 17: Global APAC Occupancy Sensors Market Revenue Million Forecast, by Network Type 2019 & 2032
- Table 18: Global APAC Occupancy Sensors Market Revenue Million Forecast, by Technology 2019 & 2032
- Table 19: Global APAC Occupancy Sensors Market Revenue Million Forecast, by Application 2019 & 2032
- Table 20: Global APAC Occupancy Sensors Market Revenue Million Forecast, by Building Type 2019 & 2032
- Table 21: Global APAC Occupancy Sensors Market Revenue Million Forecast, by Country 2019 & 2032
- Table 22: United States APAC Occupancy Sensors Market Revenue (Million) Forecast, by Application 2019 & 2032
- Table 23: Canada APAC Occupancy Sensors Market Revenue (Million) Forecast, by Application 2019 & 2032
- Table 24: Mexico APAC Occupancy Sensors Market Revenue (Million) Forecast, by Application 2019 & 2032
- Table 25: Global APAC Occupancy Sensors Market Revenue Million Forecast, by Network Type 2019 & 2032
- Table 26: Global APAC Occupancy Sensors Market Revenue Million Forecast, by Technology 2019 & 2032
- Table 27: Global APAC Occupancy Sensors Market Revenue Million Forecast, by Application 2019 & 2032
- Table 28: Global APAC Occupancy Sensors Market Revenue Million Forecast, by Building Type 2019 & 2032
- Table 29: Global APAC Occupancy Sensors Market Revenue Million Forecast, by Country 2019 & 2032
- Table 30: Brazil APAC Occupancy Sensors Market Revenue (Million) Forecast, by Application 2019 & 2032
- Table 31: Argentina APAC Occupancy Sensors Market Revenue (Million) Forecast, by Application 2019 & 2032
- Table 32: Rest of South America APAC Occupancy Sensors Market Revenue (Million) Forecast, by Application 2019 & 2032
- Table 33: Global APAC Occupancy Sensors Market Revenue Million Forecast, by Network Type 2019 & 2032
- Table 34: Global APAC Occupancy Sensors Market Revenue Million Forecast, by Technology 2019 & 2032
- Table 35: Global APAC Occupancy Sensors Market Revenue Million Forecast, by Application 2019 & 2032
- Table 36: Global APAC Occupancy Sensors Market Revenue Million Forecast, by Building Type 2019 & 2032
- Table 37: Global APAC Occupancy Sensors Market Revenue Million Forecast, by Country 2019 & 2032
- Table 38: United Kingdom APAC Occupancy Sensors Market Revenue (Million) Forecast, by Application 2019 & 2032
- Table 39: Germany APAC Occupancy Sensors Market Revenue (Million) Forecast, by Application 2019 & 2032
- Table 40: France APAC Occupancy Sensors Market Revenue (Million) Forecast, by Application 2019 & 2032
- Table 41: Italy APAC Occupancy Sensors Market Revenue (Million) Forecast, by Application 2019 & 2032
- Table 42: Spain APAC Occupancy Sensors Market Revenue (Million) Forecast, by Application 2019 & 2032
- Table 43: Russia APAC Occupancy Sensors Market Revenue (Million) Forecast, by Application 2019 & 2032
- Table 44: Benelux APAC Occupancy Sensors Market Revenue (Million) Forecast, by Application 2019 & 2032
- Table 45: Nordics APAC Occupancy Sensors Market Revenue (Million) Forecast, by Application 2019 & 2032
- Table 46: Rest of Europe APAC Occupancy Sensors Market Revenue (Million) Forecast, by Application 2019 & 2032
- Table 47: Global APAC Occupancy Sensors Market Revenue Million Forecast, by Network Type 2019 & 2032
- Table 48: Global APAC Occupancy Sensors Market Revenue Million Forecast, by Technology 2019 & 2032
- Table 49: Global APAC Occupancy Sensors Market Revenue Million Forecast, by Application 2019 & 2032
- Table 50: Global APAC Occupancy Sensors Market Revenue Million Forecast, by Building Type 2019 & 2032
- Table 51: Global APAC Occupancy Sensors Market Revenue Million Forecast, by Country 2019 & 2032
- Table 52: Turkey APAC Occupancy Sensors Market Revenue (Million) Forecast, by Application 2019 & 2032
- Table 53: Israel APAC Occupancy Sensors Market Revenue (Million) Forecast, by Application 2019 & 2032
- Table 54: GCC APAC Occupancy Sensors Market Revenue (Million) Forecast, by Application 2019 & 2032
- Table 55: North Africa APAC Occupancy Sensors Market Revenue (Million) Forecast, by Application 2019 & 2032
- Table 56: South Africa APAC Occupancy Sensors Market Revenue (Million) Forecast, by Application 2019 & 2032
- Table 57: Rest of Middle East & Africa APAC Occupancy Sensors Market Revenue (Million) Forecast, by Application 2019 & 2032
- Table 58: Global APAC Occupancy Sensors Market Revenue Million Forecast, by Network Type 2019 & 2032
- Table 59: Global APAC Occupancy Sensors Market Revenue Million Forecast, by Technology 2019 & 2032
- Table 60: Global APAC Occupancy Sensors Market Revenue Million Forecast, by Application 2019 & 2032
- Table 61: Global APAC Occupancy Sensors Market Revenue Million Forecast, by Building Type 2019 & 2032
- Table 62: Global APAC Occupancy Sensors Market Revenue Million Forecast, by Country 2019 & 2032
- Table 63: China APAC Occupancy Sensors Market Revenue (Million) Forecast, by Application 2019 & 2032
- Table 64: India APAC Occupancy Sensors Market Revenue (Million) Forecast, by Application 2019 & 2032
- Table 65: Japan APAC Occupancy Sensors Market Revenue (Million) Forecast, by Application 2019 & 2032
- Table 66: South Korea APAC Occupancy Sensors Market Revenue (Million) Forecast, by Application 2019 & 2032
- Table 67: ASEAN APAC Occupancy Sensors Market Revenue (Million) Forecast, by Application 2019 & 2032
- Table 68: Oceania APAC Occupancy Sensors Market Revenue (Million) Forecast, by Application 2019 & 2032
- Table 69: Rest of Asia Pacific APAC Occupancy Sensors Market Revenue (Million) Forecast, by Application 2019 & 2032
Frequently Asked Questions
1. What is the projected Compound Annual Growth Rate (CAGR) of the APAC Occupancy Sensors Market?
The projected CAGR is approximately 15.50%.
2. Which companies are prominent players in the APAC Occupancy Sensors Market?
Key companies in the market include Signify Holding BV, Honeywell Inc, Eaton Corp PLC, Legrand SA, General Electric Co, Dwyer Instruments Inc, Schneider Electric SE, Johnson Controls Inc, Analog Devices Inc, Texas Instruments Inc*List Not Exhaustive.
3. What are the main segments of the APAC Occupancy Sensors Market?
The market segments include Network Type, Technology, Application, Building Type.
4. Can you provide details about the market size?
The market size is estimated to be USD XX Million as of 2022.
5. What are some drivers contributing to market growth?
Rising Demand for Energy Efficient Devices; Demand for Passive Infrared Due to Low Cost and High Energy Efficiency.
6. What are the notable trends driving market growth?
Residential Expected to Witness Significant Growth.
7. Are there any restraints impacting market growth?
Cryptojacking Threats.
8. Can you provide examples of recent developments in the market?
March 2020 - Signify introduced new Philips IoT sensor packages that gather and deliver data via the Interact Office connected lighting system and environmental monitoring APIs. The sensor bundles can observe occupancy, the total of people in the room, temperature (at the room and desk level), noise levels, daylight levels, relative humidity, and are Bluetooth enabled, allowing for indoor positioning and navigation.
9. What pricing options are available for accessing the report?
Pricing options include single-user, multi-user, and enterprise licenses priced at USD 4750, USD 4950, and USD 6800 respectively.
10. Is the market size provided in terms of value or volume?
The market size is provided in terms of value, measured in Million.
11. Are there any specific market keywords associated with the report?
Yes, the market keyword associated with the report is "APAC Occupancy Sensors Market," which aids in identifying and referencing the specific market segment covered.
12. How do I determine which pricing option suits my needs best?
The pricing options vary based on user requirements and access needs. Individual users may opt for single-user licenses, while businesses requiring broader access may choose multi-user or enterprise licenses for cost-effective access to the report.
13. Are there any additional resources or data provided in the APAC Occupancy Sensors Market report?
While the report offers comprehensive insights, it's advisable to review the specific contents or supplementary materials provided to ascertain if additional resources or data are available.
14. How can I stay updated on further developments or reports in the APAC Occupancy Sensors Market?
To stay informed about further developments, trends, and reports in the APAC Occupancy Sensors Market, consider subscribing to industry newsletters, following relevant companies and organizations, or regularly checking reputable industry news sources and publications.
Methodology
Step 1 - Identification of Relevant Samples Size from Population Database


Step 2 - Approaches for Defining Global Market Size (Value, Volume* & Price*)

Note*: In applicable scenarios
Step 3 - Data Sources
Primary Research
- Web Analytics
- Survey Reports
- Research Institute
- Latest Research Reports
- Opinion Leaders
Secondary Research
- Annual Reports
- White Paper
- Latest Press Release
- Industry Association
- Paid Database
- Investor Presentations

Step 4 - Data Triangulation
Involves using different sources of information in order to increase the validity of a study
These sources are likely to be stakeholders in a program - participants, other researchers, program staff, other community members, and so on.
Then we put all data in single framework & apply various statistical tools to find out the dynamic on the market.
During the analysis stage, feedback from the stakeholder groups would be compared to determine areas of agreement as well as areas of divergence


