
Key Insights
The Asia-Pacific (APAC) lubricants market is experiencing robust growth, driven by the expanding automotive sector, particularly in rapidly developing economies like India, China, and Indonesia. The increasing demand for passenger vehicles and commercial transportation fuels this expansion. Furthermore, the industrial sector's growth, encompassing manufacturing, construction, and energy, contributes significantly to lubricant consumption. Stringent emission regulations are also impacting the market, driving demand for higher-quality, environmentally friendly lubricants. While fluctuating crude oil prices pose a challenge, the long-term outlook remains positive due to rising infrastructure development and industrialization across the APAC region. Technological advancements in lubricant formulations, such as the development of energy-efficient and biodegradable lubricants, are shaping the market landscape. Competitive pressures among major players like BP, ExxonMobil, and Shell, alongside regional players, lead to innovative product development and strategic partnerships to expand market share.
The market's growth trajectory is projected to remain strong throughout the forecast period (2025-2033), although the precise CAGR will depend on macroeconomic factors and the pace of technological innovation. The segmentation of the market reflects the diverse applications of lubricants, ranging from automotive engine oils and industrial greases to specialized lubricants for aviation and marine applications. Regional variations within APAC are substantial, with China and India currently dominating the market due to their vast automotive and industrial sectors. However, other countries in Southeast Asia are also showing significant growth potential, representing attractive opportunities for both established and emerging lubricant manufacturers. The market is characterized by a blend of international and local players, with the former leveraging their brand recognition and technological capabilities, while the latter benefit from understanding regional market specifics and maintaining cost-effective production.
APAC Lubricants Industry Market Report: 2019-2033
This comprehensive report provides an in-depth analysis of the Asia-Pacific (APAC) lubricants industry, covering market dynamics, growth trends, key players, and future outlook. The study period spans from 2019 to 2033, with 2025 serving as the base and estimated year. The report is crucial for industry professionals, investors, and strategists seeking to navigate this dynamic market. This report analyzes the parent market of Industrial Lubricants and its child markets, including Automotive Lubricants and Specialty Lubricants.
Study Period: 2019–2033 Base Year: 2025 Estimated Year: 2025 Forecast Period: 2025–2033 Historical Period: 2019–2024
APAC Lubricants Industry Market Dynamics & Structure
The APAC lubricants market is characterized by a moderately concentrated landscape, with a few dominant players and several regional competitors. Technological innovation, particularly in synthetic lubricants and environmentally friendly formulations, is a major driver. Stringent environmental regulations, varying across countries, influence product development and adoption. Competitive pressures from substitute products, such as biodegradable lubricants, are also intensifying. The end-user demographics are diverse, encompassing automotive, industrial, and marine sectors. M&A activity has been moderate, with larger players seeking to expand their market share and product portfolios.
- Market Concentration: The top five players hold approximately xx% market share in 2025.
- Technological Innovation: Focus on energy efficiency, improved performance, and reduced environmental impact.
- Regulatory Framework: Varying emission standards and environmental regulations across APAC countries.
- Competitive Substitutes: Bio-based and biodegradable lubricants pose a growing threat.
- End-User Demographics: Automotive segment dominates, followed by industrial and marine sectors.
- M&A Trends: Consolidation expected to continue, driven by economies of scale and product diversification. The volume of M&A deals in the last five years was approximately xx deals.
APAC Lubricants Industry Growth Trends & Insights
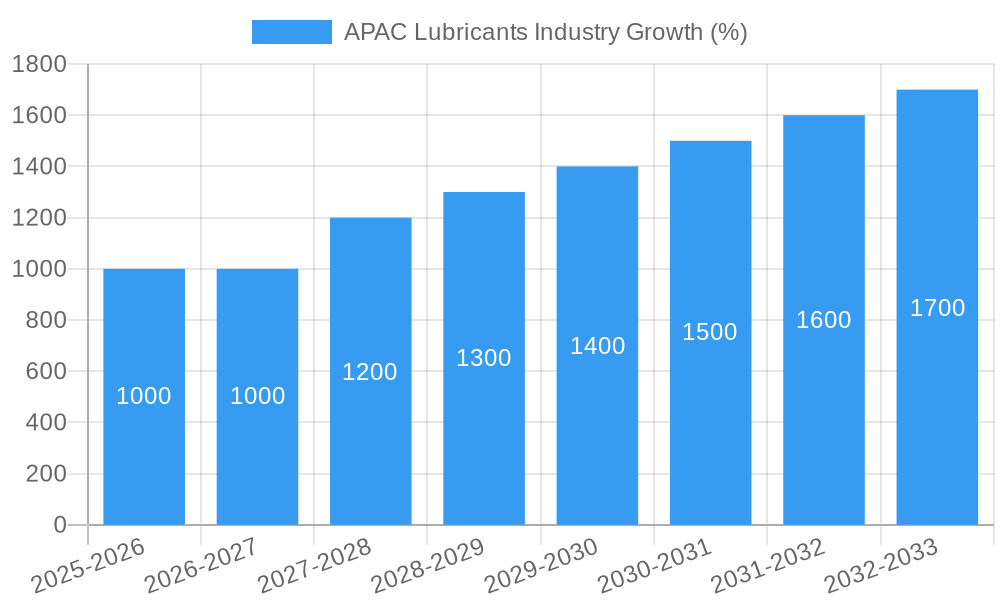
The APAC lubricants market experienced significant growth during the historical period (2019-2024), driven by industrialization, urbanization, and rising vehicle ownership. The market is projected to maintain a robust CAGR of xx% during the forecast period (2025-2033), reaching a market size of xx Million units by 2033. Technological disruptions, such as the adoption of electric vehicles (EVs) and the rise of specialized lubricants for renewable energy applications, are reshaping the market. Consumer behavior is shifting towards premium and eco-friendly products, driving demand for higher-performance and sustainable lubricants. Market penetration of synthetic lubricants continues to increase, driven by performance advantages.
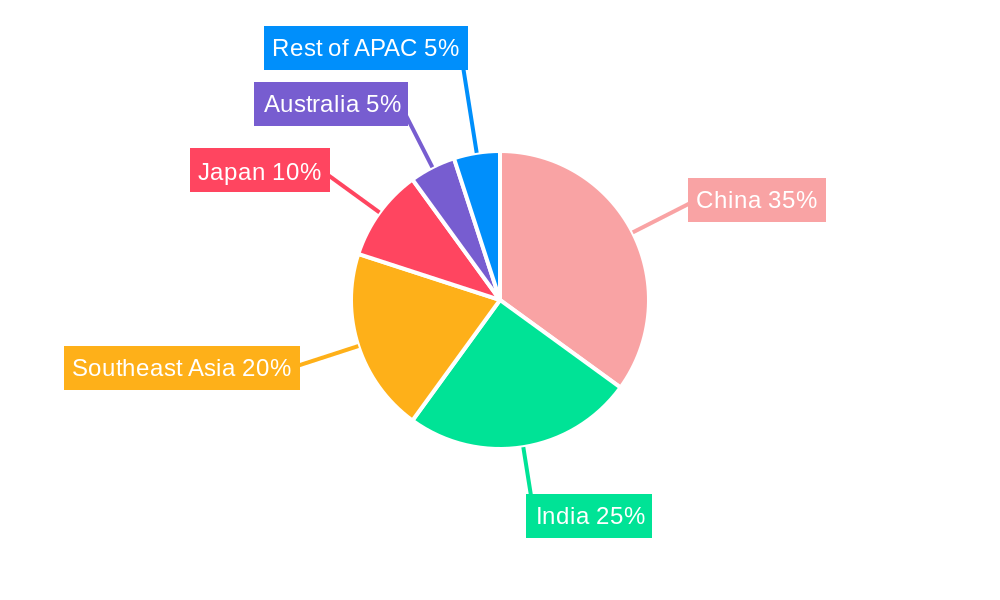
Dominant Regions, Countries, or Segments in APAC Lubricants Industry
China and India are the dominant markets in the APAC lubricants industry, contributing a combined xx% of the total market size in 2025. Strong economic growth, expanding industrial sectors, and increasing vehicle ownership in these countries are key drivers. Other significant markets include Japan, South Korea, and Australia. The automotive segment holds the largest market share, reflecting the high rate of vehicle sales and usage.
- Key Drivers in China: Rapid industrialization, substantial infrastructure development, and a large automotive market.
- Key Drivers in India: Growing middle class, increasing vehicle ownership, and a developing industrial sector.
- Market Share: China holds approximately xx% market share, India approximately xx%.
- Growth Potential: Southeast Asia presents significant untapped potential due to rising urbanization and industrialization.
APAC Lubricants Industry Product Landscape
The APAC lubricants market offers a wide range of products, including mineral-based, semi-synthetic, and fully synthetic oils. Innovations focus on improving energy efficiency, extending oil life, and enhancing performance under extreme conditions. Engine oils are the leading product category, followed by industrial lubricants and greases. Unique selling propositions include enhanced fuel economy, improved engine protection, and environmentally friendly formulations. Technological advancements are driving the development of advanced lubricant formulations with tailored properties for specific applications.
Key Drivers, Barriers & Challenges in APAP Lubricants Industry
Key Drivers:
- Increasing industrialization and urbanization across APAC.
- Growing automotive sector and rising vehicle ownership.
- Expanding renewable energy sector requiring specialized lubricants.
- Government initiatives promoting energy efficiency and environmental protection.
Key Challenges:
- Fluctuations in crude oil prices impacting raw material costs.
- Stringent environmental regulations impacting product formulation.
- Intense competition from established and emerging players.
- Supply chain disruptions and logistical challenges. Estimated impact on market growth is xx% in 2025.
Emerging Opportunities in APAC Lubricants Industry
- Growing demand for eco-friendly and biodegradable lubricants.
- Increasing adoption of electric vehicles and hybrid vehicles creating demand for new lubricants.
- Untapped potential in smaller and emerging economies in Southeast Asia.
- Expanding applications in renewable energy and other specialized sectors.
Growth Accelerators in the APAC Lubricants Industry
Technological advancements in lubricant formulations are driving market growth, offering improved performance and efficiency. Strategic partnerships and collaborations among key players are enhancing market reach and product development. Expansion into new markets and applications, especially in the renewable energy sector, presents significant opportunities.
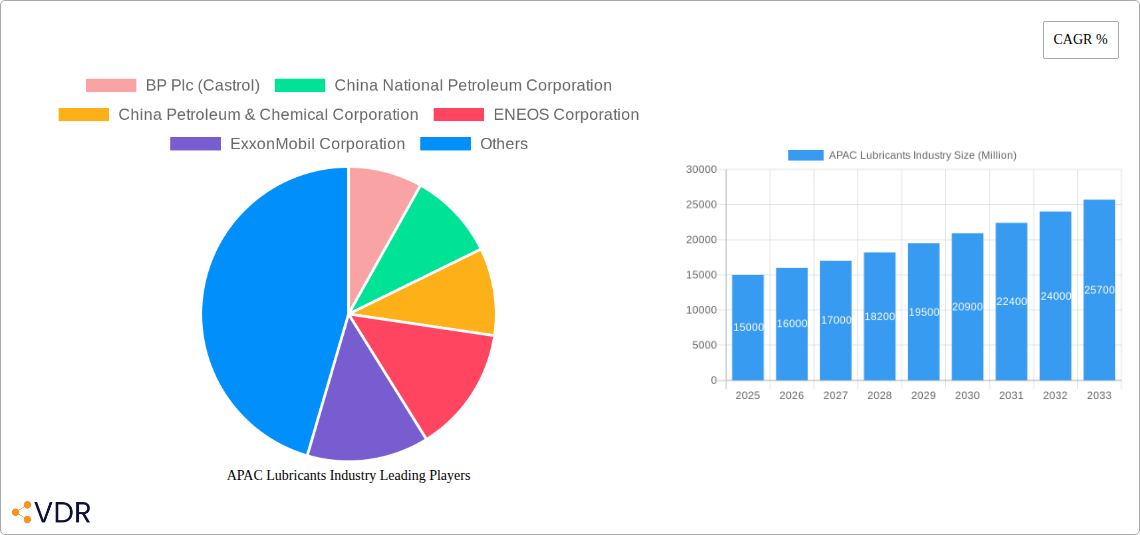
Key Players Shaping the APAC Lubricants Industry Market
- BP Plc (Castrol)
- China National Petroleum Corporation
- China Petroleum & Chemical Corporation (Sinopec)
- ENEOS Corporation
- ExxonMobil Corporation
- GS Caltex
- Idemitsu Kosan Co Ltd
- Indian Oil Corporation Limited
- Royal Dutch Shell Plc
- TotalEnergies
Notable Milestones in APAC Lubricants Industry Sector
- May 2022: TotalEnergies and NEXUS Automotive extend their strategic partnership for five years, expanding into the N! community (EUR 35 billion market in 2021).
- March 2022: ExxonMobil appoints Jay Hooley as lead managing director.
- January 2022: ExxonMobil reorganizes into three business lines: Upstream Company, Product Solutions, and Low Carbon Solutions.
In-Depth APAC Lubricants Industry Market Outlook
The APAC lubricants market is poised for sustained growth, driven by ongoing industrialization, urbanization, and technological advancements. Strategic investments in research and development, focused on sustainable and high-performance lubricants, will be critical for success. Companies that can effectively navigate evolving regulations and meet changing consumer preferences will capture significant market share. The long-term potential is substantial, particularly in emerging markets and specialized applications.
APAC Lubricants Industry Segmentation
-
1. End User
- 1.1. Automotive
- 1.2. Heavy Equipment
- 1.3. Metallurgy & Metalworking
- 1.4. Power Generation
- 1.5. Other End-user Industries
-
2. Product Type
- 2.1. Engine Oils
- 2.2. Greases
- 2.3. Hydraulic Fluids
- 2.4. Metalworking Fluids
- 2.5. Transmission & Gear Oils
- 2.6. Other Product Types
APAC Lubricants Industry Segmentation By Geography
-
1. North America
- 1.1. United States
- 1.2. Canada
- 1.3. Mexico
-
2. South America
- 2.1. Brazil
- 2.2. Argentina
- 2.3. Rest of South America
-
3. Europe
- 3.1. United Kingdom
- 3.2. Germany
- 3.3. France
- 3.4. Italy
- 3.5. Spain
- 3.6. Russia
- 3.7. Benelux
- 3.8. Nordics
- 3.9. Rest of Europe
-
4. Middle East & Africa
- 4.1. Turkey
- 4.2. Israel
- 4.3. GCC
- 4.4. North Africa
- 4.5. South Africa
- 4.6. Rest of Middle East & Africa
-
5. Asia Pacific
- 5.1. China
- 5.2. India
- 5.3. Japan
- 5.4. South Korea
- 5.5. ASEAN
- 5.6. Oceania
- 5.7. Rest of Asia Pacific
APAC Lubricants Industry REPORT HIGHLIGHTS
| Aspects | Details |
|---|---|
| Study Period | 2019-2033 |
| Base Year | 2024 |
| Estimated Year | 2025 |
| Forecast Period | 2025-2033 |
| Historical Period | 2019-2024 |
| Growth Rate | CAGR of % from 2019-2033 |
| Segmentation |
|
Table of Contents
- 1. Introduction
- 1.1. Research Scope
- 1.2. Market Segmentation
- 1.3. Research Methodology
- 1.4. Definitions and Assumptions
- 2. Executive Summary
- 2.1. Introduction
- 3. Market Dynamics
- 3.1. Introduction
- 3.2. Market Drivers
- 3.3. Market Restrains
- 3.4. Market Trends
- 3.4.1. Largest Segment By End User
- 4. Market Factor Analysis
- 4.1. Porters Five Forces
- 4.2. Supply/Value Chain
- 4.3. PESTEL analysis
- 4.4. Market Entropy
- 4.5. Patent/Trademark Analysis
- 5. Global APAC Lubricants Industry Analysis, Insights and Forecast, 2019-2031
- 5.1. Market Analysis, Insights and Forecast - by End User
- 5.1.1. Automotive
- 5.1.2. Heavy Equipment
- 5.1.3. Metallurgy & Metalworking
- 5.1.4. Power Generation
- 5.1.5. Other End-user Industries
- 5.2. Market Analysis, Insights and Forecast - by Product Type
- 5.2.1. Engine Oils
- 5.2.2. Greases
- 5.2.3. Hydraulic Fluids
- 5.2.4. Metalworking Fluids
- 5.2.5. Transmission & Gear Oils
- 5.2.6. Other Product Types
- 5.3. Market Analysis, Insights and Forecast - by Region
- 5.3.1. North America
- 5.3.2. South America
- 5.3.3. Europe
- 5.3.4. Middle East & Africa
- 5.3.5. Asia Pacific
- 5.1. Market Analysis, Insights and Forecast - by End User
- 6. North America APAC Lubricants Industry Analysis, Insights and Forecast, 2019-2031
- 6.1. Market Analysis, Insights and Forecast - by End User
- 6.1.1. Automotive
- 6.1.2. Heavy Equipment
- 6.1.3. Metallurgy & Metalworking
- 6.1.4. Power Generation
- 6.1.5. Other End-user Industries
- 6.2. Market Analysis, Insights and Forecast - by Product Type
- 6.2.1. Engine Oils
- 6.2.2. Greases
- 6.2.3. Hydraulic Fluids
- 6.2.4. Metalworking Fluids
- 6.2.5. Transmission & Gear Oils
- 6.2.6. Other Product Types
- 6.1. Market Analysis, Insights and Forecast - by End User
- 7. South America APAC Lubricants Industry Analysis, Insights and Forecast, 2019-2031
- 7.1. Market Analysis, Insights and Forecast - by End User
- 7.1.1. Automotive
- 7.1.2. Heavy Equipment
- 7.1.3. Metallurgy & Metalworking
- 7.1.4. Power Generation
- 7.1.5. Other End-user Industries
- 7.2. Market Analysis, Insights and Forecast - by Product Type
- 7.2.1. Engine Oils
- 7.2.2. Greases
- 7.2.3. Hydraulic Fluids
- 7.2.4. Metalworking Fluids
- 7.2.5. Transmission & Gear Oils
- 7.2.6. Other Product Types
- 7.1. Market Analysis, Insights and Forecast - by End User
- 8. Europe APAC Lubricants Industry Analysis, Insights and Forecast, 2019-2031
- 8.1. Market Analysis, Insights and Forecast - by End User
- 8.1.1. Automotive
- 8.1.2. Heavy Equipment
- 8.1.3. Metallurgy & Metalworking
- 8.1.4. Power Generation
- 8.1.5. Other End-user Industries
- 8.2. Market Analysis, Insights and Forecast - by Product Type
- 8.2.1. Engine Oils
- 8.2.2. Greases
- 8.2.3. Hydraulic Fluids
- 8.2.4. Metalworking Fluids
- 8.2.5. Transmission & Gear Oils
- 8.2.6. Other Product Types
- 8.1. Market Analysis, Insights and Forecast - by End User
- 9. Middle East & Africa APAC Lubricants Industry Analysis, Insights and Forecast, 2019-2031
- 9.1. Market Analysis, Insights and Forecast - by End User
- 9.1.1. Automotive
- 9.1.2. Heavy Equipment
- 9.1.3. Metallurgy & Metalworking
- 9.1.4. Power Generation
- 9.1.5. Other End-user Industries
- 9.2. Market Analysis, Insights and Forecast - by Product Type
- 9.2.1. Engine Oils
- 9.2.2. Greases
- 9.2.3. Hydraulic Fluids
- 9.2.4. Metalworking Fluids
- 9.2.5. Transmission & Gear Oils
- 9.2.6. Other Product Types
- 9.1. Market Analysis, Insights and Forecast - by End User
- 10. Asia Pacific APAC Lubricants Industry Analysis, Insights and Forecast, 2019-2031
- 10.1. Market Analysis, Insights and Forecast - by End User
- 10.1.1. Automotive
- 10.1.2. Heavy Equipment
- 10.1.3. Metallurgy & Metalworking
- 10.1.4. Power Generation
- 10.1.5. Other End-user Industries
- 10.2. Market Analysis, Insights and Forecast - by Product Type
- 10.2.1. Engine Oils
- 10.2.2. Greases
- 10.2.3. Hydraulic Fluids
- 10.2.4. Metalworking Fluids
- 10.2.5. Transmission & Gear Oils
- 10.2.6. Other Product Types
- 10.1. Market Analysis, Insights and Forecast - by End User
- 11. Competitive Analysis
- 11.1. Global Market Share Analysis 2024
- 11.2. Company Profiles
- 11.2.1 BP Plc (Castrol)
- 11.2.1.1. Overview
- 11.2.1.2. Products
- 11.2.1.3. SWOT Analysis
- 11.2.1.4. Recent Developments
- 11.2.1.5. Financials (Based on Availability)
- 11.2.2 China National Petroleum Corporation
- 11.2.2.1. Overview
- 11.2.2.2. Products
- 11.2.2.3. SWOT Analysis
- 11.2.2.4. Recent Developments
- 11.2.2.5. Financials (Based on Availability)
- 11.2.3 China Petroleum & Chemical Corporation
- 11.2.3.1. Overview
- 11.2.3.2. Products
- 11.2.3.3. SWOT Analysis
- 11.2.3.4. Recent Developments
- 11.2.3.5. Financials (Based on Availability)
- 11.2.4 ENEOS Corporation
- 11.2.4.1. Overview
- 11.2.4.2. Products
- 11.2.4.3. SWOT Analysis
- 11.2.4.4. Recent Developments
- 11.2.4.5. Financials (Based on Availability)
- 11.2.5 ExxonMobil Corporation
- 11.2.5.1. Overview
- 11.2.5.2. Products
- 11.2.5.3. SWOT Analysis
- 11.2.5.4. Recent Developments
- 11.2.5.5. Financials (Based on Availability)
- 11.2.6 GS Caltex
- 11.2.6.1. Overview
- 11.2.6.2. Products
- 11.2.6.3. SWOT Analysis
- 11.2.6.4. Recent Developments
- 11.2.6.5. Financials (Based on Availability)
- 11.2.7 Idemitsu Kosan Co Ltd
- 11.2.7.1. Overview
- 11.2.7.2. Products
- 11.2.7.3. SWOT Analysis
- 11.2.7.4. Recent Developments
- 11.2.7.5. Financials (Based on Availability)
- 11.2.8 Indian Oil Corporation Limited
- 11.2.8.1. Overview
- 11.2.8.2. Products
- 11.2.8.3. SWOT Analysis
- 11.2.8.4. Recent Developments
- 11.2.8.5. Financials (Based on Availability)
- 11.2.9 Royal Dutch Shell Plc
- 11.2.9.1. Overview
- 11.2.9.2. Products
- 11.2.9.3. SWOT Analysis
- 11.2.9.4. Recent Developments
- 11.2.9.5. Financials (Based on Availability)
- 11.2.10 TotalEnergie
- 11.2.10.1. Overview
- 11.2.10.2. Products
- 11.2.10.3. SWOT Analysis
- 11.2.10.4. Recent Developments
- 11.2.10.5. Financials (Based on Availability)
- 11.2.1 BP Plc (Castrol)
List of Figures
- Figure 1: Global APAC Lubricants Industry Revenue Breakdown (Million, %) by Region 2024 & 2032
- Figure 2: North America APAC Lubricants Industry Revenue (Million), by End User 2024 & 2032
- Figure 3: North America APAC Lubricants Industry Revenue Share (%), by End User 2024 & 2032
- Figure 4: North America APAC Lubricants Industry Revenue (Million), by Product Type 2024 & 2032
- Figure 5: North America APAC Lubricants Industry Revenue Share (%), by Product Type 2024 & 2032
- Figure 6: North America APAC Lubricants Industry Revenue (Million), by Country 2024 & 2032
- Figure 7: North America APAC Lubricants Industry Revenue Share (%), by Country 2024 & 2032
- Figure 8: South America APAC Lubricants Industry Revenue (Million), by End User 2024 & 2032
- Figure 9: South America APAC Lubricants Industry Revenue Share (%), by End User 2024 & 2032
- Figure 10: South America APAC Lubricants Industry Revenue (Million), by Product Type 2024 & 2032
- Figure 11: South America APAC Lubricants Industry Revenue Share (%), by Product Type 2024 & 2032
- Figure 12: South America APAC Lubricants Industry Revenue (Million), by Country 2024 & 2032
- Figure 13: South America APAC Lubricants Industry Revenue Share (%), by Country 2024 & 2032
- Figure 14: Europe APAC Lubricants Industry Revenue (Million), by End User 2024 & 2032
- Figure 15: Europe APAC Lubricants Industry Revenue Share (%), by End User 2024 & 2032
- Figure 16: Europe APAC Lubricants Industry Revenue (Million), by Product Type 2024 & 2032
- Figure 17: Europe APAC Lubricants Industry Revenue Share (%), by Product Type 2024 & 2032
- Figure 18: Europe APAC Lubricants Industry Revenue (Million), by Country 2024 & 2032
- Figure 19: Europe APAC Lubricants Industry Revenue Share (%), by Country 2024 & 2032
- Figure 20: Middle East & Africa APAC Lubricants Industry Revenue (Million), by End User 2024 & 2032
- Figure 21: Middle East & Africa APAC Lubricants Industry Revenue Share (%), by End User 2024 & 2032
- Figure 22: Middle East & Africa APAC Lubricants Industry Revenue (Million), by Product Type 2024 & 2032
- Figure 23: Middle East & Africa APAC Lubricants Industry Revenue Share (%), by Product Type 2024 & 2032
- Figure 24: Middle East & Africa APAC Lubricants Industry Revenue (Million), by Country 2024 & 2032
- Figure 25: Middle East & Africa APAC Lubricants Industry Revenue Share (%), by Country 2024 & 2032
- Figure 26: Asia Pacific APAC Lubricants Industry Revenue (Million), by End User 2024 & 2032
- Figure 27: Asia Pacific APAC Lubricants Industry Revenue Share (%), by End User 2024 & 2032
- Figure 28: Asia Pacific APAC Lubricants Industry Revenue (Million), by Product Type 2024 & 2032
- Figure 29: Asia Pacific APAC Lubricants Industry Revenue Share (%), by Product Type 2024 & 2032
- Figure 30: Asia Pacific APAC Lubricants Industry Revenue (Million), by Country 2024 & 2032
- Figure 31: Asia Pacific APAC Lubricants Industry Revenue Share (%), by Country 2024 & 2032
List of Tables
- Table 1: Global APAC Lubricants Industry Revenue Million Forecast, by Region 2019 & 2032
- Table 2: Global APAC Lubricants Industry Revenue Million Forecast, by End User 2019 & 2032
- Table 3: Global APAC Lubricants Industry Revenue Million Forecast, by Product Type 2019 & 2032
- Table 4: Global APAC Lubricants Industry Revenue Million Forecast, by Region 2019 & 2032
- Table 5: Global APAC Lubricants Industry Revenue Million Forecast, by End User 2019 & 2032
- Table 6: Global APAC Lubricants Industry Revenue Million Forecast, by Product Type 2019 & 2032
- Table 7: Global APAC Lubricants Industry Revenue Million Forecast, by Country 2019 & 2032
- Table 8: United States APAC Lubricants Industry Revenue (Million) Forecast, by Application 2019 & 2032
- Table 9: Canada APAC Lubricants Industry Revenue (Million) Forecast, by Application 2019 & 2032
- Table 10: Mexico APAC Lubricants Industry Revenue (Million) Forecast, by Application 2019 & 2032
- Table 11: Global APAC Lubricants Industry Revenue Million Forecast, by End User 2019 & 2032
- Table 12: Global APAC Lubricants Industry Revenue Million Forecast, by Product Type 2019 & 2032
- Table 13: Global APAC Lubricants Industry Revenue Million Forecast, by Country 2019 & 2032
- Table 14: Brazil APAC Lubricants Industry Revenue (Million) Forecast, by Application 2019 & 2032
- Table 15: Argentina APAC Lubricants Industry Revenue (Million) Forecast, by Application 2019 & 2032
- Table 16: Rest of South America APAC Lubricants Industry Revenue (Million) Forecast, by Application 2019 & 2032
- Table 17: Global APAC Lubricants Industry Revenue Million Forecast, by End User 2019 & 2032
- Table 18: Global APAC Lubricants Industry Revenue Million Forecast, by Product Type 2019 & 2032
- Table 19: Global APAC Lubricants Industry Revenue Million Forecast, by Country 2019 & 2032
- Table 20: United Kingdom APAC Lubricants Industry Revenue (Million) Forecast, by Application 2019 & 2032
- Table 21: Germany APAC Lubricants Industry Revenue (Million) Forecast, by Application 2019 & 2032
- Table 22: France APAC Lubricants Industry Revenue (Million) Forecast, by Application 2019 & 2032
- Table 23: Italy APAC Lubricants Industry Revenue (Million) Forecast, by Application 2019 & 2032
- Table 24: Spain APAC Lubricants Industry Revenue (Million) Forecast, by Application 2019 & 2032
- Table 25: Russia APAC Lubricants Industry Revenue (Million) Forecast, by Application 2019 & 2032
- Table 26: Benelux APAC Lubricants Industry Revenue (Million) Forecast, by Application 2019 & 2032
- Table 27: Nordics APAC Lubricants Industry Revenue (Million) Forecast, by Application 2019 & 2032
- Table 28: Rest of Europe APAC Lubricants Industry Revenue (Million) Forecast, by Application 2019 & 2032
- Table 29: Global APAC Lubricants Industry Revenue Million Forecast, by End User 2019 & 2032
- Table 30: Global APAC Lubricants Industry Revenue Million Forecast, by Product Type 2019 & 2032
- Table 31: Global APAC Lubricants Industry Revenue Million Forecast, by Country 2019 & 2032
- Table 32: Turkey APAC Lubricants Industry Revenue (Million) Forecast, by Application 2019 & 2032
- Table 33: Israel APAC Lubricants Industry Revenue (Million) Forecast, by Application 2019 & 2032
- Table 34: GCC APAC Lubricants Industry Revenue (Million) Forecast, by Application 2019 & 2032
- Table 35: North Africa APAC Lubricants Industry Revenue (Million) Forecast, by Application 2019 & 2032
- Table 36: South Africa APAC Lubricants Industry Revenue (Million) Forecast, by Application 2019 & 2032
- Table 37: Rest of Middle East & Africa APAC Lubricants Industry Revenue (Million) Forecast, by Application 2019 & 2032
- Table 38: Global APAC Lubricants Industry Revenue Million Forecast, by End User 2019 & 2032
- Table 39: Global APAC Lubricants Industry Revenue Million Forecast, by Product Type 2019 & 2032
- Table 40: Global APAC Lubricants Industry Revenue Million Forecast, by Country 2019 & 2032
- Table 41: China APAC Lubricants Industry Revenue (Million) Forecast, by Application 2019 & 2032
- Table 42: India APAC Lubricants Industry Revenue (Million) Forecast, by Application 2019 & 2032
- Table 43: Japan APAC Lubricants Industry Revenue (Million) Forecast, by Application 2019 & 2032
- Table 44: South Korea APAC Lubricants Industry Revenue (Million) Forecast, by Application 2019 & 2032
- Table 45: ASEAN APAC Lubricants Industry Revenue (Million) Forecast, by Application 2019 & 2032
- Table 46: Oceania APAC Lubricants Industry Revenue (Million) Forecast, by Application 2019 & 2032
- Table 47: Rest of Asia Pacific APAC Lubricants Industry Revenue (Million) Forecast, by Application 2019 & 2032
Frequently Asked Questions
1. What is the projected Compound Annual Growth Rate (CAGR) of the APAC Lubricants Industry?
The projected CAGR is approximately N/A%.
2. Which companies are prominent players in the APAC Lubricants Industry?
Key companies in the market include BP Plc (Castrol), China National Petroleum Corporation, China Petroleum & Chemical Corporation, ENEOS Corporation, ExxonMobil Corporation, GS Caltex, Idemitsu Kosan Co Ltd, Indian Oil Corporation Limited, Royal Dutch Shell Plc, TotalEnergie.
3. What are the main segments of the APAC Lubricants Industry?
The market segments include End User, Product Type.
4. Can you provide details about the market size?
The market size is estimated to be USD XX Million as of 2022.
5. What are some drivers contributing to market growth?
N/A
6. What are the notable trends driving market growth?
Largest Segment By End User : Automotive.
7. Are there any restraints impacting market growth?
N/A
8. Can you provide examples of recent developments in the market?
May 2022: TotalEnergies, NEXUS Automotive Extend Strategic Partnership for a period of five years. As part of this partnership, TotalEnergies Lubricants will be expanding its presence in the burgeoning N! community, which has seen rapid growth in sales from EUR 7.2 billion in 2015 to nearly EUR 35 billion by the end of 2021.March 2022: ExxonMobil Corporation company has appointed Jay Hooley as lead managing director of the company.January 2022: Effective April 1, ExxonMobil Corporation was organized along three business lines - ExxonMobil Upstream Company, ExxonMobil Product Solutions and ExxonMobil Low Carbon Solutions.
9. What pricing options are available for accessing the report?
Pricing options include single-user, multi-user, and enterprise licenses priced at USD 3800, USD 4500, and USD 5800 respectively.
10. Is the market size provided in terms of value or volume?
The market size is provided in terms of value, measured in Million.
11. Are there any specific market keywords associated with the report?
Yes, the market keyword associated with the report is "APAC Lubricants Industry," which aids in identifying and referencing the specific market segment covered.
12. How do I determine which pricing option suits my needs best?
The pricing options vary based on user requirements and access needs. Individual users may opt for single-user licenses, while businesses requiring broader access may choose multi-user or enterprise licenses for cost-effective access to the report.
13. Are there any additional resources or data provided in the APAC Lubricants Industry report?
While the report offers comprehensive insights, it's advisable to review the specific contents or supplementary materials provided to ascertain if additional resources or data are available.
14. How can I stay updated on further developments or reports in the APAC Lubricants Industry?
To stay informed about further developments, trends, and reports in the APAC Lubricants Industry, consider subscribing to industry newsletters, following relevant companies and organizations, or regularly checking reputable industry news sources and publications.
Methodology
Step 1 - Identification of Relevant Samples Size from Population Database


Step 2 - Approaches for Defining Global Market Size (Value, Volume* & Price*)

Note*: In applicable scenarios
Step 3 - Data Sources
Primary Research
- Web Analytics
- Survey Reports
- Research Institute
- Latest Research Reports
- Opinion Leaders
Secondary Research
- Annual Reports
- White Paper
- Latest Press Release
- Industry Association
- Paid Database
- Investor Presentations

Step 4 - Data Triangulation
Involves using different sources of information in order to increase the validity of a study
These sources are likely to be stakeholders in a program - participants, other researchers, program staff, other community members, and so on.
Then we put all data in single framework & apply various statistical tools to find out the dynamic on the market.
During the analysis stage, feedback from the stakeholder groups would be compared to determine areas of agreement as well as areas of divergence


