
Key Insights
The Asia-Pacific (APAC) image sensor market is experiencing robust growth, driven by the increasing adoption of smartphones, advanced driver-assistance systems (ADAS) in automobiles, and the expansion of surveillance and security systems across the region. The market's Compound Annual Growth Rate (CAGR) of 8.60% from 2019-2033 signifies a significant upward trajectory. This growth is fueled by several key factors. Firstly, the burgeoning consumer electronics sector in countries like China and India is a major driver, with demand for high-resolution cameras in smartphones and other portable devices constantly increasing. Secondly, the rapid development of the automotive industry, particularly the integration of ADAS features requiring sophisticated image sensors, significantly contributes to market expansion. Furthermore, government initiatives promoting smart cities and enhanced security measures across the region are boosting demand for image sensors in surveillance applications. The CMOS image sensor segment is expected to dominate the market due to its cost-effectiveness and superior performance compared to CCD sensors. While challenges such as supply chain disruptions and competition among manufacturers exist, the overall market outlook remains positive, with significant potential for growth in the coming years. Specific growth within APAC will likely be concentrated in high-growth economies like India and South East Asia, driven by increasing disposable income and smartphone penetration. The market segmentation by end-user industries (consumer electronics, healthcare, industrial, automotive, etc.) provides opportunities for targeted investments and product development.
The APAC image sensor market presents a compelling investment opportunity. The substantial market size, coupled with the projected CAGR, highlights its significant growth potential. While challenges like geopolitical instability and fluctuations in raw material prices may pose some constraints, the long-term forecast remains optimistic, particularly given the region’s burgeoning technological advancements and rising consumer demand. The key players in the APAC market are actively involved in research and development to improve image sensor technology, further fueling market expansion. This continuous innovation, along with the growing adoption of advanced imaging technologies across various sectors, will contribute significantly to the overall market growth in the forecast period.
This comprehensive report provides an in-depth analysis of the Asia-Pacific (APAC) image sensors market, covering the period 2019-2033. It offers valuable insights into market dynamics, growth trends, key players, and future opportunities, enabling businesses to make informed strategic decisions. The report segments the market by type (CMOS, CCD), end-user industry (Consumer Electronics, Healthcare, Industrial, Security and Surveillance, Automotive and Transportation, Aerospace and Defense, Other), and country (China, India, Japan, Rest of Asia Pacific). The base year for this analysis is 2025, with estimations for 2025 and forecasts extending to 2033. The historical period covered is 2019-2024. This report uses Million units as the measurement for all values.
APAC Image Sensors Industry Market Dynamics & Structure
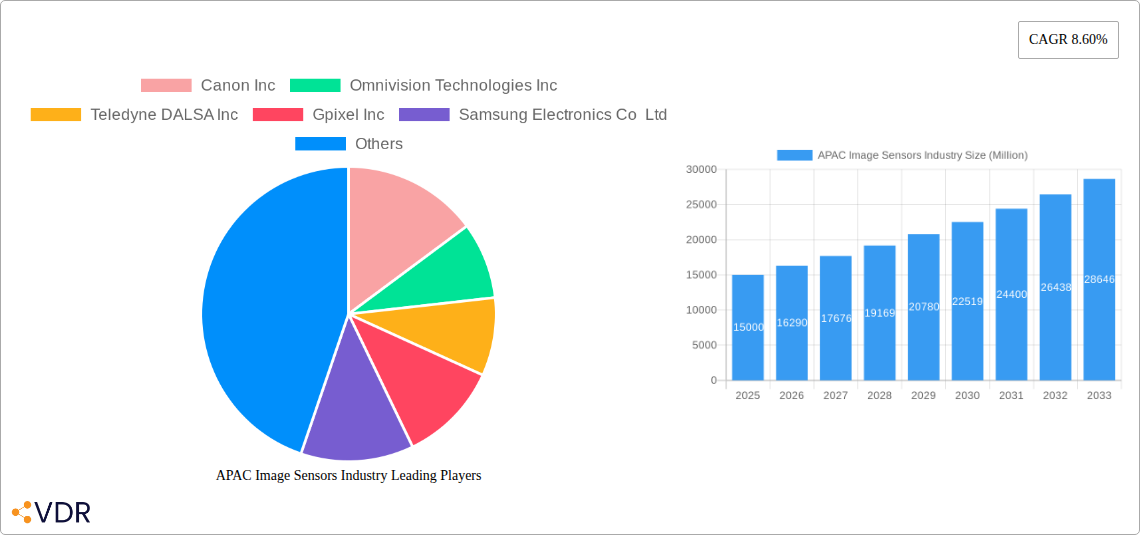
The APAC image sensor market is characterized by a moderately concentrated landscape, with key players holding significant market share. Technological innovation, particularly in CMOS technology, is a primary growth driver. Stringent regulatory frameworks, particularly concerning data privacy and security, influence market development. Competitive substitutes, such as alternative sensing technologies, present challenges. The end-user demographics are diverse, with significant growth driven by rising adoption in consumer electronics and automotive sectors. M&A activity has been moderate, with xx deals recorded between 2019 and 2024, primarily focused on strengthening technological capabilities and expanding market reach.
- Market Concentration: Moderately concentrated, with top 5 players holding approximately xx% market share in 2024.
- Technological Innovation: CMOS image sensors dominate, driven by advancements in resolution, sensitivity, and power efficiency.
- Regulatory Frameworks: Data privacy regulations (e.g., GDPR, CCPA analogs in APAC) influence product development and data handling practices.
- Competitive Substitutes: LiDAR, radar, and other sensing technologies pose limited competitive threats in specific applications.
- End-User Demographics: Rapid growth in consumer electronics (smartphones, wearables) and automotive (ADAS) drives demand.
- M&A Trends: xx M&A deals recorded between 2019 and 2024, focusing on technology and market expansion.
APAC Image Sensors Industry Growth Trends & Insights
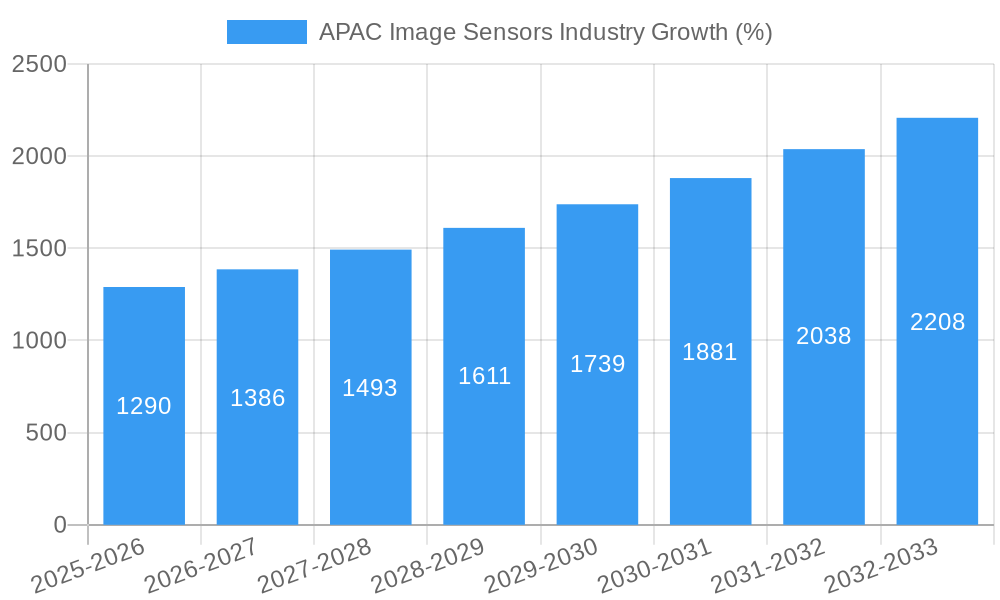
The APAC image sensor market experienced significant growth from 2019 to 2024, reaching xx million units in 2024. This growth is fueled by increasing smartphone penetration, the proliferation of smart devices, and the expansion of automotive applications incorporating Advanced Driver-Assistance Systems (ADAS). The market is expected to maintain a robust Compound Annual Growth Rate (CAGR) of xx% from 2025 to 2033, driven by technological advancements, such as higher resolution sensors, improved low-light performance, and the integration of artificial intelligence (AI) capabilities. Consumer behavior shifts toward higher-quality imaging and increased demand for sophisticated imaging in various applications will continue to drive adoption rates. The market penetration of image sensors in emerging applications such as medical imaging and industrial automation is expected to increase significantly during the forecast period.
Dominant Regions, Countries, or Segments in APAC Image Sensors Industry
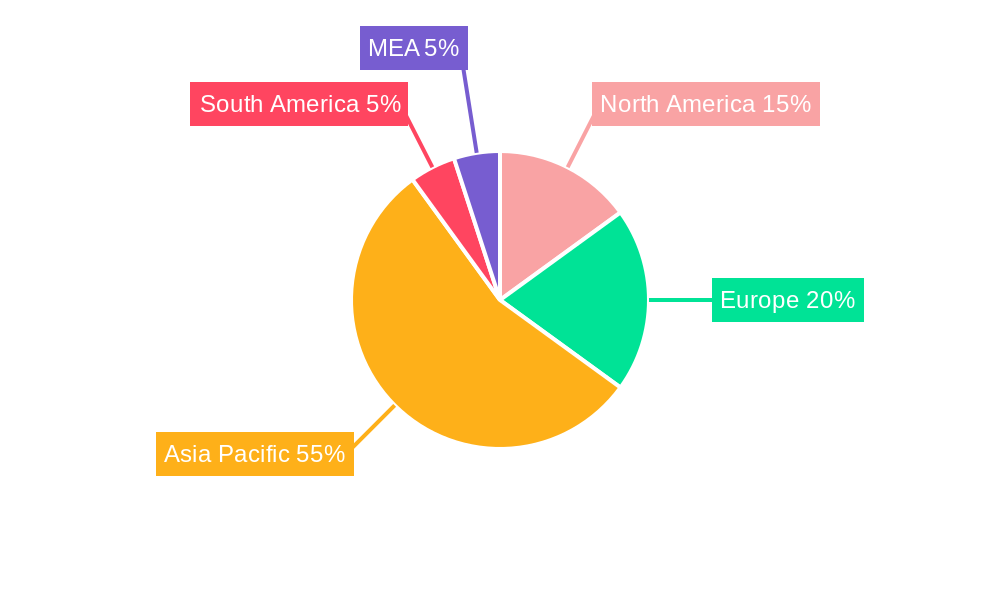
China dominates the APAC image sensor market, accounting for approximately xx% of the total market share in 2024 due to its large consumer electronics manufacturing base and burgeoning automotive sector. India is experiencing rapid growth, driven by increasing smartphone adoption and infrastructure development. Japan maintains a strong presence due to its established technological expertise and presence of major manufacturers. The CMOS segment significantly surpasses the CCD segment, holding over xx% market share, driven by its superior performance and cost-effectiveness. Consumer electronics remains the dominant end-user segment, followed by automotive and security and surveillance.
- Key Drivers in China: Strong domestic manufacturing capabilities, large consumer electronics market, and government support for technological advancements.
- Key Drivers in India: Rising smartphone penetration, expanding surveillance infrastructure, and government initiatives promoting digitalization.
- Key Drivers in Japan: Technological leadership in sensor technology, strong presence of established manufacturers, and a sophisticated consumer market.
- CMOS Dominance: Superior performance, cost-effectiveness, and wider range of applications compared to CCD.
- Consumer Electronics Dominance: High volume demand from smartphones, tablets, and other smart devices.
APAC Image Sensors Industry Product Landscape
The APAC image sensor market offers a wide range of products, from low-resolution sensors for simple applications to high-resolution sensors for advanced imaging tasks. Key product innovations include improved low-light performance, higher dynamic range, faster frame rates, and smaller sensor sizes. These advancements are driven by the increasing demand for better image quality and higher performance in various applications, such as mobile devices, automotive, medical imaging, and security systems. Unique selling propositions include superior image quality, improved power efficiency, advanced features like HDR and AI processing capabilities, and compact form factors.
Key Drivers, Barriers & Challenges in APAP Image Sensors Industry
Key Drivers: Technological advancements (higher resolution, improved low-light performance), increasing demand from consumer electronics and automotive sectors, supportive government policies (e.g., subsidies for semiconductor industries), and growing adoption in emerging applications (e.g., medical imaging, industrial automation).
Key Challenges: Intense competition, supply chain disruptions, high research and development costs, and the need to comply with stringent regulatory requirements related to data privacy and security. These challenges can lead to price pressures and impact profitability for manufacturers. Supply chain disruptions can cause production delays and shortages, impacting market growth.
Emerging Opportunities in APAP Image Sensors Industry
Emerging opportunities lie in the expanding markets for high-resolution sensors in automotive (autonomous driving), medical imaging (advanced diagnostics), and industrial automation (machine vision). The increasing demand for AI-powered image processing will also fuel innovation and growth. Untapped markets in rural areas and developing countries present significant potential for expansion.
Growth Accelerators in the APAC Image Sensors Industry
Technological breakthroughs in sensor technology, including advancements in pixel design, on-chip processing, and integration with AI, will continue to drive growth. Strategic partnerships between sensor manufacturers and end-user companies will accelerate adoption across different industries. Expansion into emerging markets through joint ventures and collaborations will unlock significant growth opportunities.
Key Players Shaping the APAC Image Sensors Industry Market
- Canon Inc
- Omnivision Technologies Inc
- Teledyne DALSA Inc
- Gpixel Inc
- Samsung Electronics Co Ltd
- STMicroelectronics NV
- SmartSens Technology Co Ltd
- ON Semiconductor Corporation
- GalaxyCore Inc
- Hynix Inc
- Ams AG
- Panasonic Corporation
- Sony Corporation
Notable Milestones in APAC Image Sensors Industry Sector
- 2020: Launch of xx-megapixel CMOS sensor by Samsung.
- 2021: Acquisition of xx by xx.
- 2022: Introduction of high-sensitivity CMOS sensor for automotive applications by Sony.
- 2023: Government initiatives in India focused on promoting domestic manufacturing of image sensors.
- 2024: Launch of AI-integrated image sensors by OmniVision.
In-Depth APAC Image Sensors Industry Market Outlook
The APAC image sensor market is poised for robust growth over the forecast period, driven by technological advancements, increasing demand from diverse end-user industries, and expanding adoption in emerging markets. Strategic partnerships, investments in R&D, and proactive market expansion strategies will be key success factors for companies operating in this dynamic market. The continued focus on higher resolution, enhanced low-light performance, and the integration of AI capabilities will position the market for continued expansion in the years ahead, presenting significant opportunities for growth and innovation.
APAC Image Sensors Industry Segmentation
-
1. Type
- 1.1. CMOS
- 1.2. CCD
-
2. End-user Industry
- 2.1. Consumer Electronics
- 2.2. Healthcare
- 2.3. Industrial
- 2.4. Security and Surveillance
- 2.5. Automotive and Transportation
- 2.6. Aerospace and Defense
- 2.7. Other End-user Industries
APAC Image Sensors Industry Segmentation By Geography
-
1. North America
- 1.1. United States
- 1.2. Canada
- 1.3. Mexico
-
2. South America
- 2.1. Brazil
- 2.2. Argentina
- 2.3. Rest of South America
-
3. Europe
- 3.1. United Kingdom
- 3.2. Germany
- 3.3. France
- 3.4. Italy
- 3.5. Spain
- 3.6. Russia
- 3.7. Benelux
- 3.8. Nordics
- 3.9. Rest of Europe
-
4. Middle East & Africa
- 4.1. Turkey
- 4.2. Israel
- 4.3. GCC
- 4.4. North Africa
- 4.5. South Africa
- 4.6. Rest of Middle East & Africa
-
5. Asia Pacific
- 5.1. China
- 5.2. India
- 5.3. Japan
- 5.4. South Korea
- 5.5. ASEAN
- 5.6. Oceania
- 5.7. Rest of Asia Pacific
APAC Image Sensors Industry REPORT HIGHLIGHTS
| Aspects | Details |
|---|---|
| Study Period | 2019-2033 |
| Base Year | 2024 |
| Estimated Year | 2025 |
| Forecast Period | 2025-2033 |
| Historical Period | 2019-2024 |
| Growth Rate | CAGR of 8.60% from 2019-2033 |
| Segmentation |
|
Table of Contents
- 1. Introduction
- 1.1. Research Scope
- 1.2. Market Segmentation
- 1.3. Research Methodology
- 1.4. Definitions and Assumptions
- 2. Executive Summary
- 2.1. Introduction
- 3. Market Dynamics
- 3.1. Introduction
- 3.2. Market Drivers
- 3.2.1. ; Rising popularity of ADAS system is Boosting Image Sensor market demandfrom Automotive Sector.; Ongoing shift to CMOS technology and improvement in image quality favouring image sensor market development.
- 3.3. Market Restrains
- 3.3.1. ; Easy availability of light detection and ranging (LiDAR) solutions.
- 3.4. Market Trends
- 3.4.1. Consumer Electronics to Show Significant Growth
- 4. Market Factor Analysis
- 4.1. Porters Five Forces
- 4.2. Supply/Value Chain
- 4.3. PESTEL analysis
- 4.4. Market Entropy
- 4.5. Patent/Trademark Analysis
- 5. Global APAC Image Sensors Industry Analysis, Insights and Forecast, 2019-2031
- 5.1. Market Analysis, Insights and Forecast - by Type
- 5.1.1. CMOS
- 5.1.2. CCD
- 5.2. Market Analysis, Insights and Forecast - by End-user Industry
- 5.2.1. Consumer Electronics
- 5.2.2. Healthcare
- 5.2.3. Industrial
- 5.2.4. Security and Surveillance
- 5.2.5. Automotive and Transportation
- 5.2.6. Aerospace and Defense
- 5.2.7. Other End-user Industries
- 5.3. Market Analysis, Insights and Forecast - by Region
- 5.3.1. North America
- 5.3.2. South America
- 5.3.3. Europe
- 5.3.4. Middle East & Africa
- 5.3.5. Asia Pacific
- 5.1. Market Analysis, Insights and Forecast - by Type
- 6. North America APAC Image Sensors Industry Analysis, Insights and Forecast, 2019-2031
- 6.1. Market Analysis, Insights and Forecast - by Type
- 6.1.1. CMOS
- 6.1.2. CCD
- 6.2. Market Analysis, Insights and Forecast - by End-user Industry
- 6.2.1. Consumer Electronics
- 6.2.2. Healthcare
- 6.2.3. Industrial
- 6.2.4. Security and Surveillance
- 6.2.5. Automotive and Transportation
- 6.2.6. Aerospace and Defense
- 6.2.7. Other End-user Industries
- 6.1. Market Analysis, Insights and Forecast - by Type
- 7. South America APAC Image Sensors Industry Analysis, Insights and Forecast, 2019-2031
- 7.1. Market Analysis, Insights and Forecast - by Type
- 7.1.1. CMOS
- 7.1.2. CCD
- 7.2. Market Analysis, Insights and Forecast - by End-user Industry
- 7.2.1. Consumer Electronics
- 7.2.2. Healthcare
- 7.2.3. Industrial
- 7.2.4. Security and Surveillance
- 7.2.5. Automotive and Transportation
- 7.2.6. Aerospace and Defense
- 7.2.7. Other End-user Industries
- 7.1. Market Analysis, Insights and Forecast - by Type
- 8. Europe APAC Image Sensors Industry Analysis, Insights and Forecast, 2019-2031
- 8.1. Market Analysis, Insights and Forecast - by Type
- 8.1.1. CMOS
- 8.1.2. CCD
- 8.2. Market Analysis, Insights and Forecast - by End-user Industry
- 8.2.1. Consumer Electronics
- 8.2.2. Healthcare
- 8.2.3. Industrial
- 8.2.4. Security and Surveillance
- 8.2.5. Automotive and Transportation
- 8.2.6. Aerospace and Defense
- 8.2.7. Other End-user Industries
- 8.1. Market Analysis, Insights and Forecast - by Type
- 9. Middle East & Africa APAC Image Sensors Industry Analysis, Insights and Forecast, 2019-2031
- 9.1. Market Analysis, Insights and Forecast - by Type
- 9.1.1. CMOS
- 9.1.2. CCD
- 9.2. Market Analysis, Insights and Forecast - by End-user Industry
- 9.2.1. Consumer Electronics
- 9.2.2. Healthcare
- 9.2.3. Industrial
- 9.2.4. Security and Surveillance
- 9.2.5. Automotive and Transportation
- 9.2.6. Aerospace and Defense
- 9.2.7. Other End-user Industries
- 9.1. Market Analysis, Insights and Forecast - by Type
- 10. Asia Pacific APAC Image Sensors Industry Analysis, Insights and Forecast, 2019-2031
- 10.1. Market Analysis, Insights and Forecast - by Type
- 10.1.1. CMOS
- 10.1.2. CCD
- 10.2. Market Analysis, Insights and Forecast - by End-user Industry
- 10.2.1. Consumer Electronics
- 10.2.2. Healthcare
- 10.2.3. Industrial
- 10.2.4. Security and Surveillance
- 10.2.5. Automotive and Transportation
- 10.2.6. Aerospace and Defense
- 10.2.7. Other End-user Industries
- 10.1. Market Analysis, Insights and Forecast - by Type
- 11. North America APAC Image Sensors Industry Analysis, Insights and Forecast, 2019-2031
- 11.1. Market Analysis, Insights and Forecast - By Country/Sub-region
- 11.1.1 United States
- 11.1.2 Canada
- 11.1.3 Mexico
- 12. Europe APAC Image Sensors Industry Analysis, Insights and Forecast, 2019-2031
- 12.1. Market Analysis, Insights and Forecast - By Country/Sub-region
- 12.1.1 Germany
- 12.1.2 United Kingdom
- 12.1.3 France
- 12.1.4 Spain
- 12.1.5 Italy
- 12.1.6 Spain
- 12.1.7 Belgium
- 12.1.8 Netherland
- 12.1.9 Nordics
- 12.1.10 Rest of Europe
- 13. Asia Pacific APAC Image Sensors Industry Analysis, Insights and Forecast, 2019-2031
- 13.1. Market Analysis, Insights and Forecast - By Country/Sub-region
- 13.1.1 China
- 13.1.2 Japan
- 13.1.3 India
- 13.1.4 South Korea
- 13.1.5 Southeast Asia
- 13.1.6 Australia
- 13.1.7 Indonesia
- 13.1.8 Phillipes
- 13.1.9 Singapore
- 13.1.10 Thailandc
- 13.1.11 Rest of Asia Pacific
- 14. South America APAC Image Sensors Industry Analysis, Insights and Forecast, 2019-2031
- 14.1. Market Analysis, Insights and Forecast - By Country/Sub-region
- 14.1.1 Brazil
- 14.1.2 Argentina
- 14.1.3 Peru
- 14.1.4 Chile
- 14.1.5 Colombia
- 14.1.6 Ecuador
- 14.1.7 Venezuela
- 14.1.8 Rest of South America
- 15. North America APAC Image Sensors Industry Analysis, Insights and Forecast, 2019-2031
- 15.1. Market Analysis, Insights and Forecast - By Country/Sub-region
- 15.1.1 United States
- 15.1.2 Canada
- 15.1.3 Mexico
- 16. MEA APAC Image Sensors Industry Analysis, Insights and Forecast, 2019-2031
- 16.1. Market Analysis, Insights and Forecast - By Country/Sub-region
- 16.1.1 United Arab Emirates
- 16.1.2 Saudi Arabia
- 16.1.3 South Africa
- 16.1.4 Rest of Middle East and Africa
- 17. Competitive Analysis
- 17.1. Global Market Share Analysis 2024
- 17.2. Company Profiles
- 17.2.1 Canon Inc
- 17.2.1.1. Overview
- 17.2.1.2. Products
- 17.2.1.3. SWOT Analysis
- 17.2.1.4. Recent Developments
- 17.2.1.5. Financials (Based on Availability)
- 17.2.2 Omnivision Technologies Inc
- 17.2.2.1. Overview
- 17.2.2.2. Products
- 17.2.2.3. SWOT Analysis
- 17.2.2.4. Recent Developments
- 17.2.2.5. Financials (Based on Availability)
- 17.2.3 Teledyne DALSA Inc
- 17.2.3.1. Overview
- 17.2.3.2. Products
- 17.2.3.3. SWOT Analysis
- 17.2.3.4. Recent Developments
- 17.2.3.5. Financials (Based on Availability)
- 17.2.4 Gpixel Inc
- 17.2.4.1. Overview
- 17.2.4.2. Products
- 17.2.4.3. SWOT Analysis
- 17.2.4.4. Recent Developments
- 17.2.4.5. Financials (Based on Availability)
- 17.2.5 Samsung Electronics Co Ltd
- 17.2.5.1. Overview
- 17.2.5.2. Products
- 17.2.5.3. SWOT Analysis
- 17.2.5.4. Recent Developments
- 17.2.5.5. Financials (Based on Availability)
- 17.2.6 STMicroelectronics NV
- 17.2.6.1. Overview
- 17.2.6.2. Products
- 17.2.6.3. SWOT Analysis
- 17.2.6.4. Recent Developments
- 17.2.6.5. Financials (Based on Availability)
- 17.2.7 SmartSens Technology Co Ltd
- 17.2.7.1. Overview
- 17.2.7.2. Products
- 17.2.7.3. SWOT Analysis
- 17.2.7.4. Recent Developments
- 17.2.7.5. Financials (Based on Availability)
- 17.2.8 ON Semiconductor Corporation
- 17.2.8.1. Overview
- 17.2.8.2. Products
- 17.2.8.3. SWOT Analysis
- 17.2.8.4. Recent Developments
- 17.2.8.5. Financials (Based on Availability)
- 17.2.9 GalaxyCore Inc
- 17.2.9.1. Overview
- 17.2.9.2. Products
- 17.2.9.3. SWOT Analysis
- 17.2.9.4. Recent Developments
- 17.2.9.5. Financials (Based on Availability)
- 17.2.10 Hynix Inc
- 17.2.10.1. Overview
- 17.2.10.2. Products
- 17.2.10.3. SWOT Analysis
- 17.2.10.4. Recent Developments
- 17.2.10.5. Financials (Based on Availability)
- 17.2.11 Ams AG
- 17.2.11.1. Overview
- 17.2.11.2. Products
- 17.2.11.3. SWOT Analysis
- 17.2.11.4. Recent Developments
- 17.2.11.5. Financials (Based on Availability)
- 17.2.12 Panasonic Corporation
- 17.2.12.1. Overview
- 17.2.12.2. Products
- 17.2.12.3. SWOT Analysis
- 17.2.12.4. Recent Developments
- 17.2.12.5. Financials (Based on Availability)
- 17.2.13 Sony Corporation
- 17.2.13.1. Overview
- 17.2.13.2. Products
- 17.2.13.3. SWOT Analysis
- 17.2.13.4. Recent Developments
- 17.2.13.5. Financials (Based on Availability)
- 17.2.1 Canon Inc
List of Figures
- Figure 1: Global APAC Image Sensors Industry Revenue Breakdown (Million, %) by Region 2024 & 2032
- Figure 2: Global APAC Image Sensors Industry Volume Breakdown (K Unit, %) by Region 2024 & 2032
- Figure 3: North America APAC Image Sensors Industry Revenue (Million), by Country 2024 & 2032
- Figure 4: North America APAC Image Sensors Industry Volume (K Unit), by Country 2024 & 2032
- Figure 5: North America APAC Image Sensors Industry Revenue Share (%), by Country 2024 & 2032
- Figure 6: North America APAC Image Sensors Industry Volume Share (%), by Country 2024 & 2032
- Figure 7: Europe APAC Image Sensors Industry Revenue (Million), by Country 2024 & 2032
- Figure 8: Europe APAC Image Sensors Industry Volume (K Unit), by Country 2024 & 2032
- Figure 9: Europe APAC Image Sensors Industry Revenue Share (%), by Country 2024 & 2032
- Figure 10: Europe APAC Image Sensors Industry Volume Share (%), by Country 2024 & 2032
- Figure 11: Asia Pacific APAC Image Sensors Industry Revenue (Million), by Country 2024 & 2032
- Figure 12: Asia Pacific APAC Image Sensors Industry Volume (K Unit), by Country 2024 & 2032
- Figure 13: Asia Pacific APAC Image Sensors Industry Revenue Share (%), by Country 2024 & 2032
- Figure 14: Asia Pacific APAC Image Sensors Industry Volume Share (%), by Country 2024 & 2032
- Figure 15: South America APAC Image Sensors Industry Revenue (Million), by Country 2024 & 2032
- Figure 16: South America APAC Image Sensors Industry Volume (K Unit), by Country 2024 & 2032
- Figure 17: South America APAC Image Sensors Industry Revenue Share (%), by Country 2024 & 2032
- Figure 18: South America APAC Image Sensors Industry Volume Share (%), by Country 2024 & 2032
- Figure 19: North America APAC Image Sensors Industry Revenue (Million), by Country 2024 & 2032
- Figure 20: North America APAC Image Sensors Industry Volume (K Unit), by Country 2024 & 2032
- Figure 21: North America APAC Image Sensors Industry Revenue Share (%), by Country 2024 & 2032
- Figure 22: North America APAC Image Sensors Industry Volume Share (%), by Country 2024 & 2032
- Figure 23: MEA APAC Image Sensors Industry Revenue (Million), by Country 2024 & 2032
- Figure 24: MEA APAC Image Sensors Industry Volume (K Unit), by Country 2024 & 2032
- Figure 25: MEA APAC Image Sensors Industry Revenue Share (%), by Country 2024 & 2032
- Figure 26: MEA APAC Image Sensors Industry Volume Share (%), by Country 2024 & 2032
- Figure 27: North America APAC Image Sensors Industry Revenue (Million), by Type 2024 & 2032
- Figure 28: North America APAC Image Sensors Industry Volume (K Unit), by Type 2024 & 2032
- Figure 29: North America APAC Image Sensors Industry Revenue Share (%), by Type 2024 & 2032
- Figure 30: North America APAC Image Sensors Industry Volume Share (%), by Type 2024 & 2032
- Figure 31: North America APAC Image Sensors Industry Revenue (Million), by End-user Industry 2024 & 2032
- Figure 32: North America APAC Image Sensors Industry Volume (K Unit), by End-user Industry 2024 & 2032
- Figure 33: North America APAC Image Sensors Industry Revenue Share (%), by End-user Industry 2024 & 2032
- Figure 34: North America APAC Image Sensors Industry Volume Share (%), by End-user Industry 2024 & 2032
- Figure 35: North America APAC Image Sensors Industry Revenue (Million), by Country 2024 & 2032
- Figure 36: North America APAC Image Sensors Industry Volume (K Unit), by Country 2024 & 2032
- Figure 37: North America APAC Image Sensors Industry Revenue Share (%), by Country 2024 & 2032
- Figure 38: North America APAC Image Sensors Industry Volume Share (%), by Country 2024 & 2032
- Figure 39: South America APAC Image Sensors Industry Revenue (Million), by Type 2024 & 2032
- Figure 40: South America APAC Image Sensors Industry Volume (K Unit), by Type 2024 & 2032
- Figure 41: South America APAC Image Sensors Industry Revenue Share (%), by Type 2024 & 2032
- Figure 42: South America APAC Image Sensors Industry Volume Share (%), by Type 2024 & 2032
- Figure 43: South America APAC Image Sensors Industry Revenue (Million), by End-user Industry 2024 & 2032
- Figure 44: South America APAC Image Sensors Industry Volume (K Unit), by End-user Industry 2024 & 2032
- Figure 45: South America APAC Image Sensors Industry Revenue Share (%), by End-user Industry 2024 & 2032
- Figure 46: South America APAC Image Sensors Industry Volume Share (%), by End-user Industry 2024 & 2032
- Figure 47: South America APAC Image Sensors Industry Revenue (Million), by Country 2024 & 2032
- Figure 48: South America APAC Image Sensors Industry Volume (K Unit), by Country 2024 & 2032
- Figure 49: South America APAC Image Sensors Industry Revenue Share (%), by Country 2024 & 2032
- Figure 50: South America APAC Image Sensors Industry Volume Share (%), by Country 2024 & 2032
- Figure 51: Europe APAC Image Sensors Industry Revenue (Million), by Type 2024 & 2032
- Figure 52: Europe APAC Image Sensors Industry Volume (K Unit), by Type 2024 & 2032
- Figure 53: Europe APAC Image Sensors Industry Revenue Share (%), by Type 2024 & 2032
- Figure 54: Europe APAC Image Sensors Industry Volume Share (%), by Type 2024 & 2032
- Figure 55: Europe APAC Image Sensors Industry Revenue (Million), by End-user Industry 2024 & 2032
- Figure 56: Europe APAC Image Sensors Industry Volume (K Unit), by End-user Industry 2024 & 2032
- Figure 57: Europe APAC Image Sensors Industry Revenue Share (%), by End-user Industry 2024 & 2032
- Figure 58: Europe APAC Image Sensors Industry Volume Share (%), by End-user Industry 2024 & 2032
- Figure 59: Europe APAC Image Sensors Industry Revenue (Million), by Country 2024 & 2032
- Figure 60: Europe APAC Image Sensors Industry Volume (K Unit), by Country 2024 & 2032
- Figure 61: Europe APAC Image Sensors Industry Revenue Share (%), by Country 2024 & 2032
- Figure 62: Europe APAC Image Sensors Industry Volume Share (%), by Country 2024 & 2032
- Figure 63: Middle East & Africa APAC Image Sensors Industry Revenue (Million), by Type 2024 & 2032
- Figure 64: Middle East & Africa APAC Image Sensors Industry Volume (K Unit), by Type 2024 & 2032
- Figure 65: Middle East & Africa APAC Image Sensors Industry Revenue Share (%), by Type 2024 & 2032
- Figure 66: Middle East & Africa APAC Image Sensors Industry Volume Share (%), by Type 2024 & 2032
- Figure 67: Middle East & Africa APAC Image Sensors Industry Revenue (Million), by End-user Industry 2024 & 2032
- Figure 68: Middle East & Africa APAC Image Sensors Industry Volume (K Unit), by End-user Industry 2024 & 2032
- Figure 69: Middle East & Africa APAC Image Sensors Industry Revenue Share (%), by End-user Industry 2024 & 2032
- Figure 70: Middle East & Africa APAC Image Sensors Industry Volume Share (%), by End-user Industry 2024 & 2032
- Figure 71: Middle East & Africa APAC Image Sensors Industry Revenue (Million), by Country 2024 & 2032
- Figure 72: Middle East & Africa APAC Image Sensors Industry Volume (K Unit), by Country 2024 & 2032
- Figure 73: Middle East & Africa APAC Image Sensors Industry Revenue Share (%), by Country 2024 & 2032
- Figure 74: Middle East & Africa APAC Image Sensors Industry Volume Share (%), by Country 2024 & 2032
- Figure 75: Asia Pacific APAC Image Sensors Industry Revenue (Million), by Type 2024 & 2032
- Figure 76: Asia Pacific APAC Image Sensors Industry Volume (K Unit), by Type 2024 & 2032
- Figure 77: Asia Pacific APAC Image Sensors Industry Revenue Share (%), by Type 2024 & 2032
- Figure 78: Asia Pacific APAC Image Sensors Industry Volume Share (%), by Type 2024 & 2032
- Figure 79: Asia Pacific APAC Image Sensors Industry Revenue (Million), by End-user Industry 2024 & 2032
- Figure 80: Asia Pacific APAC Image Sensors Industry Volume (K Unit), by End-user Industry 2024 & 2032
- Figure 81: Asia Pacific APAC Image Sensors Industry Revenue Share (%), by End-user Industry 2024 & 2032
- Figure 82: Asia Pacific APAC Image Sensors Industry Volume Share (%), by End-user Industry 2024 & 2032
- Figure 83: Asia Pacific APAC Image Sensors Industry Revenue (Million), by Country 2024 & 2032
- Figure 84: Asia Pacific APAC Image Sensors Industry Volume (K Unit), by Country 2024 & 2032
- Figure 85: Asia Pacific APAC Image Sensors Industry Revenue Share (%), by Country 2024 & 2032
- Figure 86: Asia Pacific APAC Image Sensors Industry Volume Share (%), by Country 2024 & 2032
List of Tables
- Table 1: Global APAC Image Sensors Industry Revenue Million Forecast, by Region 2019 & 2032
- Table 2: Global APAC Image Sensors Industry Volume K Unit Forecast, by Region 2019 & 2032
- Table 3: Global APAC Image Sensors Industry Revenue Million Forecast, by Type 2019 & 2032
- Table 4: Global APAC Image Sensors Industry Volume K Unit Forecast, by Type 2019 & 2032
- Table 5: Global APAC Image Sensors Industry Revenue Million Forecast, by End-user Industry 2019 & 2032
- Table 6: Global APAC Image Sensors Industry Volume K Unit Forecast, by End-user Industry 2019 & 2032
- Table 7: Global APAC Image Sensors Industry Revenue Million Forecast, by Region 2019 & 2032
- Table 8: Global APAC Image Sensors Industry Volume K Unit Forecast, by Region 2019 & 2032
- Table 9: Global APAC Image Sensors Industry Revenue Million Forecast, by Country 2019 & 2032
- Table 10: Global APAC Image Sensors Industry Volume K Unit Forecast, by Country 2019 & 2032
- Table 11: United States APAC Image Sensors Industry Revenue (Million) Forecast, by Application 2019 & 2032
- Table 12: United States APAC Image Sensors Industry Volume (K Unit) Forecast, by Application 2019 & 2032
- Table 13: Canada APAC Image Sensors Industry Revenue (Million) Forecast, by Application 2019 & 2032
- Table 14: Canada APAC Image Sensors Industry Volume (K Unit) Forecast, by Application 2019 & 2032
- Table 15: Mexico APAC Image Sensors Industry Revenue (Million) Forecast, by Application 2019 & 2032
- Table 16: Mexico APAC Image Sensors Industry Volume (K Unit) Forecast, by Application 2019 & 2032
- Table 17: Global APAC Image Sensors Industry Revenue Million Forecast, by Country 2019 & 2032
- Table 18: Global APAC Image Sensors Industry Volume K Unit Forecast, by Country 2019 & 2032
- Table 19: Germany APAC Image Sensors Industry Revenue (Million) Forecast, by Application 2019 & 2032
- Table 20: Germany APAC Image Sensors Industry Volume (K Unit) Forecast, by Application 2019 & 2032
- Table 21: United Kingdom APAC Image Sensors Industry Revenue (Million) Forecast, by Application 2019 & 2032
- Table 22: United Kingdom APAC Image Sensors Industry Volume (K Unit) Forecast, by Application 2019 & 2032
- Table 23: France APAC Image Sensors Industry Revenue (Million) Forecast, by Application 2019 & 2032
- Table 24: France APAC Image Sensors Industry Volume (K Unit) Forecast, by Application 2019 & 2032
- Table 25: Spain APAC Image Sensors Industry Revenue (Million) Forecast, by Application 2019 & 2032
- Table 26: Spain APAC Image Sensors Industry Volume (K Unit) Forecast, by Application 2019 & 2032
- Table 27: Italy APAC Image Sensors Industry Revenue (Million) Forecast, by Application 2019 & 2032
- Table 28: Italy APAC Image Sensors Industry Volume (K Unit) Forecast, by Application 2019 & 2032
- Table 29: Spain APAC Image Sensors Industry Revenue (Million) Forecast, by Application 2019 & 2032
- Table 30: Spain APAC Image Sensors Industry Volume (K Unit) Forecast, by Application 2019 & 2032
- Table 31: Belgium APAC Image Sensors Industry Revenue (Million) Forecast, by Application 2019 & 2032
- Table 32: Belgium APAC Image Sensors Industry Volume (K Unit) Forecast, by Application 2019 & 2032
- Table 33: Netherland APAC Image Sensors Industry Revenue (Million) Forecast, by Application 2019 & 2032
- Table 34: Netherland APAC Image Sensors Industry Volume (K Unit) Forecast, by Application 2019 & 2032
- Table 35: Nordics APAC Image Sensors Industry Revenue (Million) Forecast, by Application 2019 & 2032
- Table 36: Nordics APAC Image Sensors Industry Volume (K Unit) Forecast, by Application 2019 & 2032
- Table 37: Rest of Europe APAC Image Sensors Industry Revenue (Million) Forecast, by Application 2019 & 2032
- Table 38: Rest of Europe APAC Image Sensors Industry Volume (K Unit) Forecast, by Application 2019 & 2032
- Table 39: Global APAC Image Sensors Industry Revenue Million Forecast, by Country 2019 & 2032
- Table 40: Global APAC Image Sensors Industry Volume K Unit Forecast, by Country 2019 & 2032
- Table 41: China APAC Image Sensors Industry Revenue (Million) Forecast, by Application 2019 & 2032
- Table 42: China APAC Image Sensors Industry Volume (K Unit) Forecast, by Application 2019 & 2032
- Table 43: Japan APAC Image Sensors Industry Revenue (Million) Forecast, by Application 2019 & 2032
- Table 44: Japan APAC Image Sensors Industry Volume (K Unit) Forecast, by Application 2019 & 2032
- Table 45: India APAC Image Sensors Industry Revenue (Million) Forecast, by Application 2019 & 2032
- Table 46: India APAC Image Sensors Industry Volume (K Unit) Forecast, by Application 2019 & 2032
- Table 47: South Korea APAC Image Sensors Industry Revenue (Million) Forecast, by Application 2019 & 2032
- Table 48: South Korea APAC Image Sensors Industry Volume (K Unit) Forecast, by Application 2019 & 2032
- Table 49: Southeast Asia APAC Image Sensors Industry Revenue (Million) Forecast, by Application 2019 & 2032
- Table 50: Southeast Asia APAC Image Sensors Industry Volume (K Unit) Forecast, by Application 2019 & 2032
- Table 51: Australia APAC Image Sensors Industry Revenue (Million) Forecast, by Application 2019 & 2032
- Table 52: Australia APAC Image Sensors Industry Volume (K Unit) Forecast, by Application 2019 & 2032
- Table 53: Indonesia APAC Image Sensors Industry Revenue (Million) Forecast, by Application 2019 & 2032
- Table 54: Indonesia APAC Image Sensors Industry Volume (K Unit) Forecast, by Application 2019 & 2032
- Table 55: Phillipes APAC Image Sensors Industry Revenue (Million) Forecast, by Application 2019 & 2032
- Table 56: Phillipes APAC Image Sensors Industry Volume (K Unit) Forecast, by Application 2019 & 2032
- Table 57: Singapore APAC Image Sensors Industry Revenue (Million) Forecast, by Application 2019 & 2032
- Table 58: Singapore APAC Image Sensors Industry Volume (K Unit) Forecast, by Application 2019 & 2032
- Table 59: Thailandc APAC Image Sensors Industry Revenue (Million) Forecast, by Application 2019 & 2032
- Table 60: Thailandc APAC Image Sensors Industry Volume (K Unit) Forecast, by Application 2019 & 2032
- Table 61: Rest of Asia Pacific APAC Image Sensors Industry Revenue (Million) Forecast, by Application 2019 & 2032
- Table 62: Rest of Asia Pacific APAC Image Sensors Industry Volume (K Unit) Forecast, by Application 2019 & 2032
- Table 63: Global APAC Image Sensors Industry Revenue Million Forecast, by Country 2019 & 2032
- Table 64: Global APAC Image Sensors Industry Volume K Unit Forecast, by Country 2019 & 2032
- Table 65: Brazil APAC Image Sensors Industry Revenue (Million) Forecast, by Application 2019 & 2032
- Table 66: Brazil APAC Image Sensors Industry Volume (K Unit) Forecast, by Application 2019 & 2032
- Table 67: Argentina APAC Image Sensors Industry Revenue (Million) Forecast, by Application 2019 & 2032
- Table 68: Argentina APAC Image Sensors Industry Volume (K Unit) Forecast, by Application 2019 & 2032
- Table 69: Peru APAC Image Sensors Industry Revenue (Million) Forecast, by Application 2019 & 2032
- Table 70: Peru APAC Image Sensors Industry Volume (K Unit) Forecast, by Application 2019 & 2032
- Table 71: Chile APAC Image Sensors Industry Revenue (Million) Forecast, by Application 2019 & 2032
- Table 72: Chile APAC Image Sensors Industry Volume (K Unit) Forecast, by Application 2019 & 2032
- Table 73: Colombia APAC Image Sensors Industry Revenue (Million) Forecast, by Application 2019 & 2032
- Table 74: Colombia APAC Image Sensors Industry Volume (K Unit) Forecast, by Application 2019 & 2032
- Table 75: Ecuador APAC Image Sensors Industry Revenue (Million) Forecast, by Application 2019 & 2032
- Table 76: Ecuador APAC Image Sensors Industry Volume (K Unit) Forecast, by Application 2019 & 2032
- Table 77: Venezuela APAC Image Sensors Industry Revenue (Million) Forecast, by Application 2019 & 2032
- Table 78: Venezuela APAC Image Sensors Industry Volume (K Unit) Forecast, by Application 2019 & 2032
- Table 79: Rest of South America APAC Image Sensors Industry Revenue (Million) Forecast, by Application 2019 & 2032
- Table 80: Rest of South America APAC Image Sensors Industry Volume (K Unit) Forecast, by Application 2019 & 2032
- Table 81: Global APAC Image Sensors Industry Revenue Million Forecast, by Country 2019 & 2032
- Table 82: Global APAC Image Sensors Industry Volume K Unit Forecast, by Country 2019 & 2032
- Table 83: United States APAC Image Sensors Industry Revenue (Million) Forecast, by Application 2019 & 2032
- Table 84: United States APAC Image Sensors Industry Volume (K Unit) Forecast, by Application 2019 & 2032
- Table 85: Canada APAC Image Sensors Industry Revenue (Million) Forecast, by Application 2019 & 2032
- Table 86: Canada APAC Image Sensors Industry Volume (K Unit) Forecast, by Application 2019 & 2032
- Table 87: Mexico APAC Image Sensors Industry Revenue (Million) Forecast, by Application 2019 & 2032
- Table 88: Mexico APAC Image Sensors Industry Volume (K Unit) Forecast, by Application 2019 & 2032
- Table 89: Global APAC Image Sensors Industry Revenue Million Forecast, by Country 2019 & 2032
- Table 90: Global APAC Image Sensors Industry Volume K Unit Forecast, by Country 2019 & 2032
- Table 91: United Arab Emirates APAC Image Sensors Industry Revenue (Million) Forecast, by Application 2019 & 2032
- Table 92: United Arab Emirates APAC Image Sensors Industry Volume (K Unit) Forecast, by Application 2019 & 2032
- Table 93: Saudi Arabia APAC Image Sensors Industry Revenue (Million) Forecast, by Application 2019 & 2032
- Table 94: Saudi Arabia APAC Image Sensors Industry Volume (K Unit) Forecast, by Application 2019 & 2032
- Table 95: South Africa APAC Image Sensors Industry Revenue (Million) Forecast, by Application 2019 & 2032
- Table 96: South Africa APAC Image Sensors Industry Volume (K Unit) Forecast, by Application 2019 & 2032
- Table 97: Rest of Middle East and Africa APAC Image Sensors Industry Revenue (Million) Forecast, by Application 2019 & 2032
- Table 98: Rest of Middle East and Africa APAC Image Sensors Industry Volume (K Unit) Forecast, by Application 2019 & 2032
- Table 99: Global APAC Image Sensors Industry Revenue Million Forecast, by Type 2019 & 2032
- Table 100: Global APAC Image Sensors Industry Volume K Unit Forecast, by Type 2019 & 2032
- Table 101: Global APAC Image Sensors Industry Revenue Million Forecast, by End-user Industry 2019 & 2032
- Table 102: Global APAC Image Sensors Industry Volume K Unit Forecast, by End-user Industry 2019 & 2032
- Table 103: Global APAC Image Sensors Industry Revenue Million Forecast, by Country 2019 & 2032
- Table 104: Global APAC Image Sensors Industry Volume K Unit Forecast, by Country 2019 & 2032
- Table 105: United States APAC Image Sensors Industry Revenue (Million) Forecast, by Application 2019 & 2032
- Table 106: United States APAC Image Sensors Industry Volume (K Unit) Forecast, by Application 2019 & 2032
- Table 107: Canada APAC Image Sensors Industry Revenue (Million) Forecast, by Application 2019 & 2032
- Table 108: Canada APAC Image Sensors Industry Volume (K Unit) Forecast, by Application 2019 & 2032
- Table 109: Mexico APAC Image Sensors Industry Revenue (Million) Forecast, by Application 2019 & 2032
- Table 110: Mexico APAC Image Sensors Industry Volume (K Unit) Forecast, by Application 2019 & 2032
- Table 111: Global APAC Image Sensors Industry Revenue Million Forecast, by Type 2019 & 2032
- Table 112: Global APAC Image Sensors Industry Volume K Unit Forecast, by Type 2019 & 2032
- Table 113: Global APAC Image Sensors Industry Revenue Million Forecast, by End-user Industry 2019 & 2032
- Table 114: Global APAC Image Sensors Industry Volume K Unit Forecast, by End-user Industry 2019 & 2032
- Table 115: Global APAC Image Sensors Industry Revenue Million Forecast, by Country 2019 & 2032
- Table 116: Global APAC Image Sensors Industry Volume K Unit Forecast, by Country 2019 & 2032
- Table 117: Brazil APAC Image Sensors Industry Revenue (Million) Forecast, by Application 2019 & 2032
- Table 118: Brazil APAC Image Sensors Industry Volume (K Unit) Forecast, by Application 2019 & 2032
- Table 119: Argentina APAC Image Sensors Industry Revenue (Million) Forecast, by Application 2019 & 2032
- Table 120: Argentina APAC Image Sensors Industry Volume (K Unit) Forecast, by Application 2019 & 2032
- Table 121: Rest of South America APAC Image Sensors Industry Revenue (Million) Forecast, by Application 2019 & 2032
- Table 122: Rest of South America APAC Image Sensors Industry Volume (K Unit) Forecast, by Application 2019 & 2032
- Table 123: Global APAC Image Sensors Industry Revenue Million Forecast, by Type 2019 & 2032
- Table 124: Global APAC Image Sensors Industry Volume K Unit Forecast, by Type 2019 & 2032
- Table 125: Global APAC Image Sensors Industry Revenue Million Forecast, by End-user Industry 2019 & 2032
- Table 126: Global APAC Image Sensors Industry Volume K Unit Forecast, by End-user Industry 2019 & 2032
- Table 127: Global APAC Image Sensors Industry Revenue Million Forecast, by Country 2019 & 2032
- Table 128: Global APAC Image Sensors Industry Volume K Unit Forecast, by Country 2019 & 2032
- Table 129: United Kingdom APAC Image Sensors Industry Revenue (Million) Forecast, by Application 2019 & 2032
- Table 130: United Kingdom APAC Image Sensors Industry Volume (K Unit) Forecast, by Application 2019 & 2032
- Table 131: Germany APAC Image Sensors Industry Revenue (Million) Forecast, by Application 2019 & 2032
- Table 132: Germany APAC Image Sensors Industry Volume (K Unit) Forecast, by Application 2019 & 2032
- Table 133: France APAC Image Sensors Industry Revenue (Million) Forecast, by Application 2019 & 2032
- Table 134: France APAC Image Sensors Industry Volume (K Unit) Forecast, by Application 2019 & 2032
- Table 135: Italy APAC Image Sensors Industry Revenue (Million) Forecast, by Application 2019 & 2032
- Table 136: Italy APAC Image Sensors Industry Volume (K Unit) Forecast, by Application 2019 & 2032
- Table 137: Spain APAC Image Sensors Industry Revenue (Million) Forecast, by Application 2019 & 2032
- Table 138: Spain APAC Image Sensors Industry Volume (K Unit) Forecast, by Application 2019 & 2032
- Table 139: Russia APAC Image Sensors Industry Revenue (Million) Forecast, by Application 2019 & 2032
- Table 140: Russia APAC Image Sensors Industry Volume (K Unit) Forecast, by Application 2019 & 2032
- Table 141: Benelux APAC Image Sensors Industry Revenue (Million) Forecast, by Application 2019 & 2032
- Table 142: Benelux APAC Image Sensors Industry Volume (K Unit) Forecast, by Application 2019 & 2032
- Table 143: Nordics APAC Image Sensors Industry Revenue (Million) Forecast, by Application 2019 & 2032
- Table 144: Nordics APAC Image Sensors Industry Volume (K Unit) Forecast, by Application 2019 & 2032
- Table 145: Rest of Europe APAC Image Sensors Industry Revenue (Million) Forecast, by Application 2019 & 2032
- Table 146: Rest of Europe APAC Image Sensors Industry Volume (K Unit) Forecast, by Application 2019 & 2032
- Table 147: Global APAC Image Sensors Industry Revenue Million Forecast, by Type 2019 & 2032
- Table 148: Global APAC Image Sensors Industry Volume K Unit Forecast, by Type 2019 & 2032
- Table 149: Global APAC Image Sensors Industry Revenue Million Forecast, by End-user Industry 2019 & 2032
- Table 150: Global APAC Image Sensors Industry Volume K Unit Forecast, by End-user Industry 2019 & 2032
- Table 151: Global APAC Image Sensors Industry Revenue Million Forecast, by Country 2019 & 2032
- Table 152: Global APAC Image Sensors Industry Volume K Unit Forecast, by Country 2019 & 2032
- Table 153: Turkey APAC Image Sensors Industry Revenue (Million) Forecast, by Application 2019 & 2032
- Table 154: Turkey APAC Image Sensors Industry Volume (K Unit) Forecast, by Application 2019 & 2032
- Table 155: Israel APAC Image Sensors Industry Revenue (Million) Forecast, by Application 2019 & 2032
- Table 156: Israel APAC Image Sensors Industry Volume (K Unit) Forecast, by Application 2019 & 2032
- Table 157: GCC APAC Image Sensors Industry Revenue (Million) Forecast, by Application 2019 & 2032
- Table 158: GCC APAC Image Sensors Industry Volume (K Unit) Forecast, by Application 2019 & 2032
- Table 159: North Africa APAC Image Sensors Industry Revenue (Million) Forecast, by Application 2019 & 2032
- Table 160: North Africa APAC Image Sensors Industry Volume (K Unit) Forecast, by Application 2019 & 2032
- Table 161: South Africa APAC Image Sensors Industry Revenue (Million) Forecast, by Application 2019 & 2032
- Table 162: South Africa APAC Image Sensors Industry Volume (K Unit) Forecast, by Application 2019 & 2032
- Table 163: Rest of Middle East & Africa APAC Image Sensors Industry Revenue (Million) Forecast, by Application 2019 & 2032
- Table 164: Rest of Middle East & Africa APAC Image Sensors Industry Volume (K Unit) Forecast, by Application 2019 & 2032
- Table 165: Global APAC Image Sensors Industry Revenue Million Forecast, by Type 2019 & 2032
- Table 166: Global APAC Image Sensors Industry Volume K Unit Forecast, by Type 2019 & 2032
- Table 167: Global APAC Image Sensors Industry Revenue Million Forecast, by End-user Industry 2019 & 2032
- Table 168: Global APAC Image Sensors Industry Volume K Unit Forecast, by End-user Industry 2019 & 2032
- Table 169: Global APAC Image Sensors Industry Revenue Million Forecast, by Country 2019 & 2032
- Table 170: Global APAC Image Sensors Industry Volume K Unit Forecast, by Country 2019 & 2032
- Table 171: China APAC Image Sensors Industry Revenue (Million) Forecast, by Application 2019 & 2032
- Table 172: China APAC Image Sensors Industry Volume (K Unit) Forecast, by Application 2019 & 2032
- Table 173: India APAC Image Sensors Industry Revenue (Million) Forecast, by Application 2019 & 2032
- Table 174: India APAC Image Sensors Industry Volume (K Unit) Forecast, by Application 2019 & 2032
- Table 175: Japan APAC Image Sensors Industry Revenue (Million) Forecast, by Application 2019 & 2032
- Table 176: Japan APAC Image Sensors Industry Volume (K Unit) Forecast, by Application 2019 & 2032
- Table 177: South Korea APAC Image Sensors Industry Revenue (Million) Forecast, by Application 2019 & 2032
- Table 178: South Korea APAC Image Sensors Industry Volume (K Unit) Forecast, by Application 2019 & 2032
- Table 179: ASEAN APAC Image Sensors Industry Revenue (Million) Forecast, by Application 2019 & 2032
- Table 180: ASEAN APAC Image Sensors Industry Volume (K Unit) Forecast, by Application 2019 & 2032
- Table 181: Oceania APAC Image Sensors Industry Revenue (Million) Forecast, by Application 2019 & 2032
- Table 182: Oceania APAC Image Sensors Industry Volume (K Unit) Forecast, by Application 2019 & 2032
- Table 183: Rest of Asia Pacific APAC Image Sensors Industry Revenue (Million) Forecast, by Application 2019 & 2032
- Table 184: Rest of Asia Pacific APAC Image Sensors Industry Volume (K Unit) Forecast, by Application 2019 & 2032
Frequently Asked Questions
1. What is the projected Compound Annual Growth Rate (CAGR) of the APAC Image Sensors Industry?
The projected CAGR is approximately 8.60%.
2. Which companies are prominent players in the APAC Image Sensors Industry?
Key companies in the market include Canon Inc, Omnivision Technologies Inc, Teledyne DALSA Inc, Gpixel Inc, Samsung Electronics Co Ltd, STMicroelectronics NV, SmartSens Technology Co Ltd , ON Semiconductor Corporation, GalaxyCore Inc, Hynix Inc, Ams AG, Panasonic Corporation, Sony Corporation.
3. What are the main segments of the APAC Image Sensors Industry?
The market segments include Type, End-user Industry.
4. Can you provide details about the market size?
The market size is estimated to be USD XX Million as of 2022.
5. What are some drivers contributing to market growth?
; Rising popularity of ADAS system is Boosting Image Sensor market demandfrom Automotive Sector.; Ongoing shift to CMOS technology and improvement in image quality favouring image sensor market development..
6. What are the notable trends driving market growth?
Consumer Electronics to Show Significant Growth.
7. Are there any restraints impacting market growth?
; Easy availability of light detection and ranging (LiDAR) solutions..
8. Can you provide examples of recent developments in the market?
N/A
9. What pricing options are available for accessing the report?
Pricing options include single-user, multi-user, and enterprise licenses priced at USD 4750, USD 5250, and USD 8750 respectively.
10. Is the market size provided in terms of value or volume?
The market size is provided in terms of value, measured in Million and volume, measured in K Unit.
11. Are there any specific market keywords associated with the report?
Yes, the market keyword associated with the report is "APAC Image Sensors Industry," which aids in identifying and referencing the specific market segment covered.
12. How do I determine which pricing option suits my needs best?
The pricing options vary based on user requirements and access needs. Individual users may opt for single-user licenses, while businesses requiring broader access may choose multi-user or enterprise licenses for cost-effective access to the report.
13. Are there any additional resources or data provided in the APAC Image Sensors Industry report?
While the report offers comprehensive insights, it's advisable to review the specific contents or supplementary materials provided to ascertain if additional resources or data are available.
14. How can I stay updated on further developments or reports in the APAC Image Sensors Industry?
To stay informed about further developments, trends, and reports in the APAC Image Sensors Industry, consider subscribing to industry newsletters, following relevant companies and organizations, or regularly checking reputable industry news sources and publications.
Methodology
Step 1 - Identification of Relevant Samples Size from Population Database


Step 2 - Approaches for Defining Global Market Size (Value, Volume* & Price*)

Note*: In applicable scenarios
Step 3 - Data Sources
Primary Research
- Web Analytics
- Survey Reports
- Research Institute
- Latest Research Reports
- Opinion Leaders
Secondary Research
- Annual Reports
- White Paper
- Latest Press Release
- Industry Association
- Paid Database
- Investor Presentations

Step 4 - Data Triangulation
Involves using different sources of information in order to increase the validity of a study
These sources are likely to be stakeholders in a program - participants, other researchers, program staff, other community members, and so on.
Then we put all data in single framework & apply various statistical tools to find out the dynamic on the market.
During the analysis stage, feedback from the stakeholder groups would be compared to determine areas of agreement as well as areas of divergence


