
Key Insights
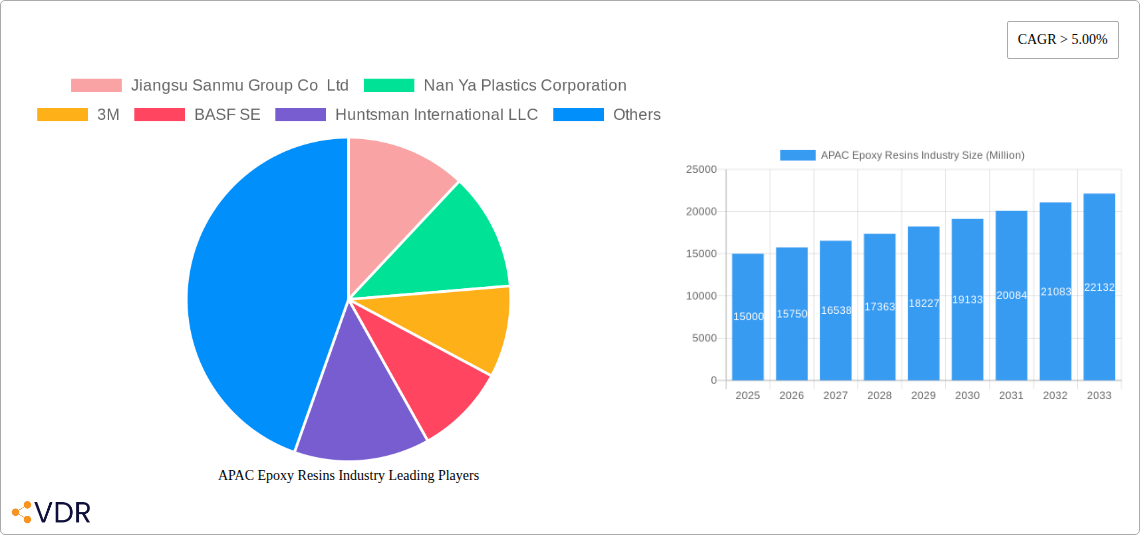
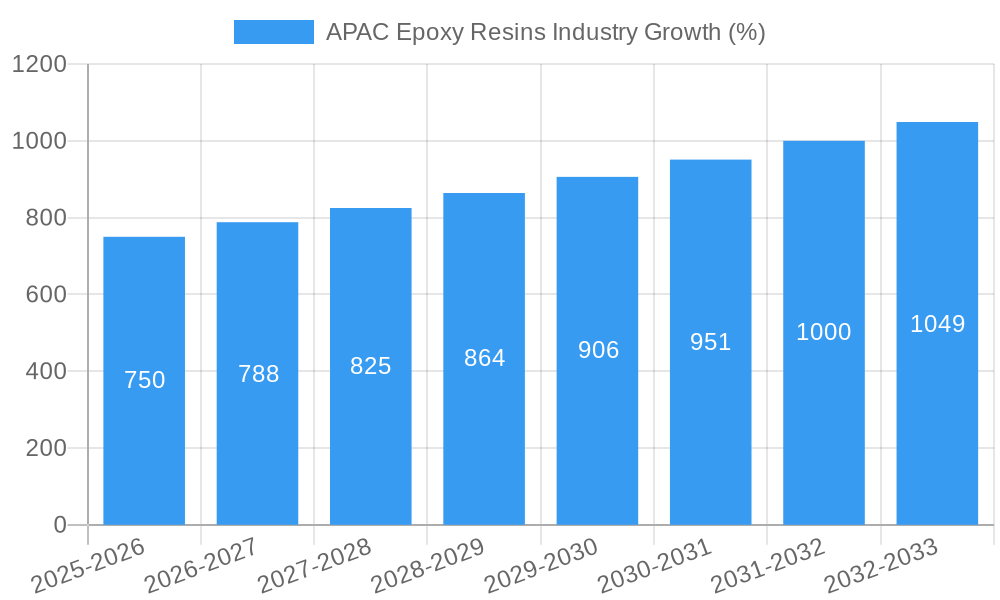
The Asia-Pacific (APAC) epoxy resins market is experiencing robust growth, driven by the region's expanding construction, automotive, and electronics sectors. A CAGR exceeding 5% indicates a significant and sustained upward trajectory, projecting substantial market expansion from 2025 to 2033. Key drivers include increasing infrastructure development across countries like China and India, fueling demand for high-performance adhesives and composites in construction projects and wind turbine manufacturing. The automotive industry's push for lightweight vehicles and enhanced performance further stimulates demand for epoxy resins in coatings and components. Growth in electronics manufacturing, particularly in Southeast Asia, contributes significantly to the market's expansion, with epoxy resins playing a crucial role in printed circuit boards and other electronic components. While raw material price fluctuations and environmental concerns pose potential restraints, the overall market outlook remains positive, fueled by ongoing technological advancements and the development of sustainable epoxy resin formulations. Specific segments like paints and coatings, and adhesives and sealants are expected to dominate the market share, with further growth predicted in specialized applications like wind turbines and electric vehicles. The presence of major players like Jiangsu Sanmu Group, Nan Ya Plastics, and 3M underscores the competitive landscape and indicates a high level of investment and innovation within the region.
The dominance of China and India in the APAC market is undeniable, given their substantial manufacturing bases and infrastructure projects. However, other Southeast Asian nations are rapidly emerging as key players, driven by foreign direct investment and the establishment of manufacturing hubs. This decentralized growth underscores the importance of understanding regional nuances and variations in demand. Furthermore, the increasing adoption of sustainable practices and the demand for bio-based epoxy resins present opportunities for companies to differentiate their offerings and cater to environmentally conscious consumers and regulations. This trend towards sustainability, combined with ongoing innovations in epoxy resin formulations, will shape the competitive landscape and drive further growth in specialized segments over the forecast period. Future market analysis should focus on the individual growth trajectories of key countries within the APAC region, the adoption rates of sustainable resins, and the competitive strategies employed by leading manufacturers.
APAC Epoxy Resins Industry: A Comprehensive Market Report (2019-2033)
This comprehensive report provides an in-depth analysis of the Asia-Pacific (APAC) epoxy resins market, covering market dynamics, growth trends, regional performance, product landscape, key players, and future outlook. The study period spans from 2019 to 2033, with 2025 as the base and estimated year. The report offers invaluable insights for industry professionals, investors, and strategic decision-makers seeking to navigate this dynamic market.
APAC Epoxy Resins Industry Market Dynamics & Structure
The APAC epoxy resins market exhibits a moderately consolidated structure, with key players like BASF SE, Huntsman International LLC, and 3M holding significant market share (approximately xx%). Market concentration is influenced by factors including economies of scale in production, technological advancements, and access to raw materials. Technological innovation, driven by the demand for high-performance epoxy resins in diverse applications, is a key driver. Stringent environmental regulations are shaping product development towards more sustainable solutions. Competitive pressure from substitute materials, such as polyurethane and acrylic resins, exists, though epoxy resins maintain a strong position due to their superior performance characteristics in specific applications. The increasing demand from construction, automotive, and electronics sectors fuels market growth. M&A activity within the industry has been moderate over the historical period (2019-2024), with approximately xx deals recorded, primarily focused on expanding geographic reach and product portfolios.
- Market Concentration: Moderately consolidated, with top players holding xx% market share.
- Technological Innovation: Driving demand for high-performance resins, pushing for sustainable alternatives.
- Regulatory Framework: Stringent environmental regulations impacting product development and sustainability initiatives.
- Competitive Substitutes: Polyurethane and acrylic resins pose a competitive challenge.
- End-User Demographics: Growing demand from construction, automotive, and electronics sectors.
- M&A Trends: Moderate activity, focusing on geographic expansion and product diversification. xx deals recorded (2019-2024).
APAC Epoxy Resins Industry Growth Trends & Insights
The APAC epoxy resins market experienced robust growth during the historical period (2019-2024), with a CAGR of xx%. This growth is projected to continue throughout the forecast period (2025-2033), albeit at a slightly moderated pace, reaching a market size of xx million units by 2033. The increasing adoption of epoxy resins in various end-use applications, particularly in high-growth sectors like wind energy and electronics, is a key driver. Technological advancements, such as the development of bio-based epoxy resins and improved curing technologies, further contribute to market expansion. Consumer behavior shifts towards environmentally friendly materials are also influencing market trends, leading to increased demand for sustainable epoxy resin solutions. Market penetration in several segments, such as wind turbine blades and advanced composites, remains relatively low, presenting substantial growth opportunities.
Dominant Regions, Countries, or Segments in APAC Epoxy Resins Industry
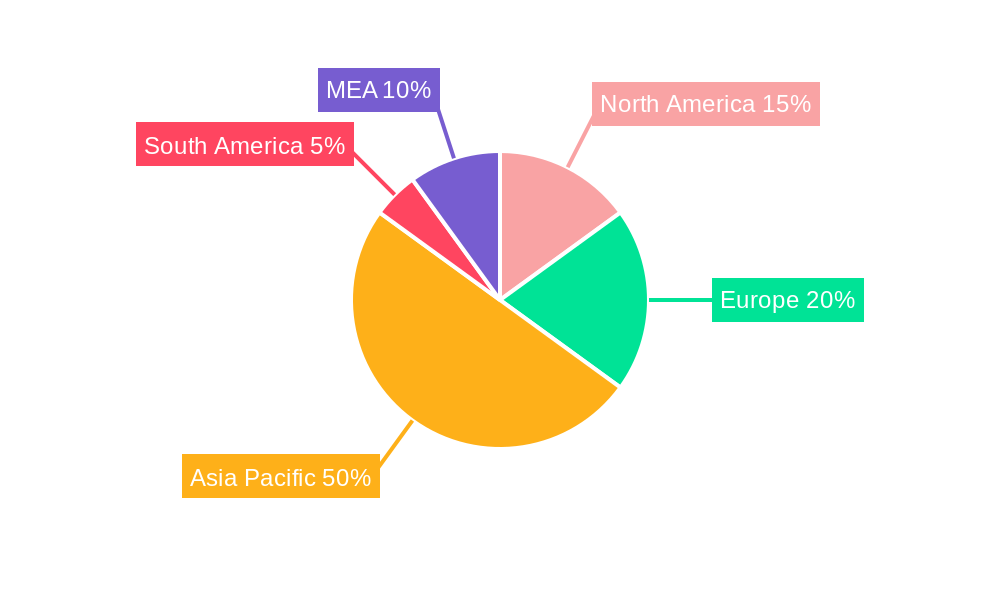
China dominates the APAC epoxy resins market, accounting for approximately xx% of the total market share in 2025, followed by India and Japan. Within the raw material segment, Bisphenol A and ECH (DGBEA) holds the largest share (xx%), driven by its cost-effectiveness and widespread use. In terms of application, the paints and coatings segment leads the market, accounting for approximately xx%, followed by the adhesives and sealants segment. Several factors contribute to this regional dominance:
China: Largest consumer and producer, strong industrial base, supportive government policies.
India: Rapid industrialization, increasing infrastructure development, and rising construction activity.
Japan: Established manufacturing base, technological advancements, and strong demand from the electronics industry.
DGBEA (Bisphenol A and ECH): Cost-effectiveness and widespread use in numerous applications.
Paints and Coatings: Largest application segment due to high demand in construction and automotive sectors.
Key Drivers for Growth:
- Rapid urbanization and infrastructure development in several APAC countries.
- Rising demand from automotive and electronics industries.
- Growing adoption of renewable energy technologies (e.g., wind turbines).
- Government initiatives promoting sustainable materials.
APAC Epoxy Resins Industry Product Landscape
The APAC epoxy resins market showcases a diverse product landscape encompassing various types, such as DGBEA, DGBEF, Novolac, Aliphatic, and Glycidylamine-based resins. Recent innovations include the development of high-performance epoxy resins with improved thermal stability, chemical resistance, and mechanical strength. These advancements cater to the demanding requirements of advanced applications like aerospace composites and high-speed electronics. Unique selling propositions frequently involve superior adhesion, durability, and environmental friendliness.
Key Drivers, Barriers & Challenges in APAC Epoxy Resins Industry
Key Drivers: The market is primarily driven by the rising demand from the construction, automotive, and electronics industries. Government policies supporting sustainable materials and renewable energy further propel growth. Technological advancements leading to higher-performance resins are also significant drivers.
Challenges and Restraints: Fluctuations in raw material prices pose a significant challenge. Stringent environmental regulations necessitate compliance costs and drive the need for sustainable solutions. Intense competition among established players and the emergence of new entrants create competitive pressure. Supply chain disruptions and geopolitical instability can also impact market dynamics. Estimated impact of these challenges on market growth is xx% reduction in the CAGR during the forecast period.
Emerging Opportunities in APAC Epoxy Resins Industry
Significant opportunities exist in expanding into untapped markets within APAC, particularly in Southeast Asia. The growing demand for sustainable and bio-based epoxy resins presents a lucrative opportunity. Innovative applications in areas such as 3D printing, advanced composites, and medical devices represent further market expansion avenues. Adapting to evolving consumer preferences toward eco-friendly products will be crucial for success.
Growth Accelerators in the APAC Epoxy Resins Industry
Technological breakthroughs, such as the development of novel resin formulations and advanced curing technologies, are key growth catalysts. Strategic partnerships and collaborations between raw material suppliers, resin manufacturers, and end-users enhance market expansion. Expansion into new applications, such as wind turbine blades and electric vehicle components, and strategic market penetration in high-growth economies within APAC will further stimulate market growth.
Key Players Shaping the APAC Epoxy Resins Industry Market
- Jiangsu Sanmu Group Co Ltd
- Nan Ya Plastics Corporation
- 3M
- BASF SE
- Huntsman International LLC
- Aditya Birla Chemicals
- Daicel Corporation
- Hexion
- Chang Chun Plastics Co Ltd
- Kukdo Chemicals Co Ltd
- Olin Corporation
- Covestro AG
- Atul Ltd
Notable Milestones in APAC Epoxy Resins Industry Sector
- 2021: BASF SE launches a new range of bio-based epoxy resins.
- 2022: Huntsman International LLC acquires a key raw material supplier, expanding its vertical integration.
- 2023: 3M introduces a high-performance epoxy resin for advanced composite applications.
- 2024: Significant investment in new epoxy resin production facilities in China.
In-Depth APAC Epoxy Resins Industry Market Outlook
The APAC epoxy resins market is poised for continued growth, driven by strong demand from diverse end-use industries and the emergence of innovative products. Strategic investments in research and development, coupled with a focus on sustainable solutions, are crucial for capturing the significant market opportunities. The market's future potential is linked to successful navigation of the challenges posed by raw material price volatility and stringent environmental regulations. Focusing on niche applications and leveraging strategic partnerships will be key to long-term success.
APAC Epoxy Resins Industry Segmentation
-
1. Raw Material
- 1.1. DGBEA (Bisphenol A and ECH)
- 1.2. DGBEF (Bisphenol F and ECH)
- 1.3. Novolac (Formaldehyde and Phenols)
- 1.4. Aliphatic (Aliphatic Alcohols)
- 1.5. Glycidylamine (Aromatic Amines and ECH)
- 1.6. Other Raw Materials
-
2. Application
- 2.1. Paints and Coatings
- 2.2. Adhesives and Sealants
- 2.3. Composites
- 2.4. Electrical and Electronics
- 2.5. Wind Turbines
- 2.6. Other Applications
-
3. Geography
- 3.1. China
- 3.2. India
- 3.3. Japan
- 3.4. South Korea
- 3.5. ASEAN Countries
- 3.6. Rest of Asia-Pacific
APAC Epoxy Resins Industry Segmentation By Geography
- 1. China
- 2. India
- 3. Japan
- 4. South Korea
- 5. ASEAN Countries
- 6. Rest of Asia Pacific
APAC Epoxy Resins Industry REPORT HIGHLIGHTS
| Aspects | Details |
|---|---|
| Study Period | 2019-2033 |
| Base Year | 2024 |
| Estimated Year | 2025 |
| Forecast Period | 2025-2033 |
| Historical Period | 2019-2024 |
| Growth Rate | CAGR of > 5.00% from 2019-2033 |
| Segmentation |
|
Table of Contents
- 1. Introduction
- 1.1. Research Scope
- 1.2. Market Segmentation
- 1.3. Research Methodology
- 1.4. Definitions and Assumptions
- 2. Executive Summary
- 2.1. Introduction
- 3. Market Dynamics
- 3.1. Introduction
- 3.2. Market Drivers
- 3.2.1. ; Strong Growth of the Construction Industry; Rising Demand for Electrical and Electronic Devices
- 3.3. Market Restrains
- 3.3.1. ; Hazardous Impact of Epoxy on Health; Impact of COVID-19 Pandemic; Other Restraints
- 3.4. Market Trends
- 3.4.1. Paints and Coatings Segment to Dominate the Market
- 4. Market Factor Analysis
- 4.1. Porters Five Forces
- 4.2. Supply/Value Chain
- 4.3. PESTEL analysis
- 4.4. Market Entropy
- 4.5. Patent/Trademark Analysis
- 5. Global APAC Epoxy Resins Industry Analysis, Insights and Forecast, 2019-2031
- 5.1. Market Analysis, Insights and Forecast - by Raw Material
- 5.1.1. DGBEA (Bisphenol A and ECH)
- 5.1.2. DGBEF (Bisphenol F and ECH)
- 5.1.3. Novolac (Formaldehyde and Phenols)
- 5.1.4. Aliphatic (Aliphatic Alcohols)
- 5.1.5. Glycidylamine (Aromatic Amines and ECH)
- 5.1.6. Other Raw Materials
- 5.2. Market Analysis, Insights and Forecast - by Application
- 5.2.1. Paints and Coatings
- 5.2.2. Adhesives and Sealants
- 5.2.3. Composites
- 5.2.4. Electrical and Electronics
- 5.2.5. Wind Turbines
- 5.2.6. Other Applications
- 5.3. Market Analysis, Insights and Forecast - by Geography
- 5.3.1. China
- 5.3.2. India
- 5.3.3. Japan
- 5.3.4. South Korea
- 5.3.5. ASEAN Countries
- 5.3.6. Rest of Asia-Pacific
- 5.4. Market Analysis, Insights and Forecast - by Region
- 5.4.1. China
- 5.4.2. India
- 5.4.3. Japan
- 5.4.4. South Korea
- 5.4.5. ASEAN Countries
- 5.4.6. Rest of Asia Pacific
- 5.1. Market Analysis, Insights and Forecast - by Raw Material
- 6. China APAC Epoxy Resins Industry Analysis, Insights and Forecast, 2019-2031
- 6.1. Market Analysis, Insights and Forecast - by Raw Material
- 6.1.1. DGBEA (Bisphenol A and ECH)
- 6.1.2. DGBEF (Bisphenol F and ECH)
- 6.1.3. Novolac (Formaldehyde and Phenols)
- 6.1.4. Aliphatic (Aliphatic Alcohols)
- 6.1.5. Glycidylamine (Aromatic Amines and ECH)
- 6.1.6. Other Raw Materials
- 6.2. Market Analysis, Insights and Forecast - by Application
- 6.2.1. Paints and Coatings
- 6.2.2. Adhesives and Sealants
- 6.2.3. Composites
- 6.2.4. Electrical and Electronics
- 6.2.5. Wind Turbines
- 6.2.6. Other Applications
- 6.3. Market Analysis, Insights and Forecast - by Geography
- 6.3.1. China
- 6.3.2. India
- 6.3.3. Japan
- 6.3.4. South Korea
- 6.3.5. ASEAN Countries
- 6.3.6. Rest of Asia-Pacific
- 6.1. Market Analysis, Insights and Forecast - by Raw Material
- 7. India APAC Epoxy Resins Industry Analysis, Insights and Forecast, 2019-2031
- 7.1. Market Analysis, Insights and Forecast - by Raw Material
- 7.1.1. DGBEA (Bisphenol A and ECH)
- 7.1.2. DGBEF (Bisphenol F and ECH)
- 7.1.3. Novolac (Formaldehyde and Phenols)
- 7.1.4. Aliphatic (Aliphatic Alcohols)
- 7.1.5. Glycidylamine (Aromatic Amines and ECH)
- 7.1.6. Other Raw Materials
- 7.2. Market Analysis, Insights and Forecast - by Application
- 7.2.1. Paints and Coatings
- 7.2.2. Adhesives and Sealants
- 7.2.3. Composites
- 7.2.4. Electrical and Electronics
- 7.2.5. Wind Turbines
- 7.2.6. Other Applications
- 7.3. Market Analysis, Insights and Forecast - by Geography
- 7.3.1. China
- 7.3.2. India
- 7.3.3. Japan
- 7.3.4. South Korea
- 7.3.5. ASEAN Countries
- 7.3.6. Rest of Asia-Pacific
- 7.1. Market Analysis, Insights and Forecast - by Raw Material
- 8. Japan APAC Epoxy Resins Industry Analysis, Insights and Forecast, 2019-2031
- 8.1. Market Analysis, Insights and Forecast - by Raw Material
- 8.1.1. DGBEA (Bisphenol A and ECH)
- 8.1.2. DGBEF (Bisphenol F and ECH)
- 8.1.3. Novolac (Formaldehyde and Phenols)
- 8.1.4. Aliphatic (Aliphatic Alcohols)
- 8.1.5. Glycidylamine (Aromatic Amines and ECH)
- 8.1.6. Other Raw Materials
- 8.2. Market Analysis, Insights and Forecast - by Application
- 8.2.1. Paints and Coatings
- 8.2.2. Adhesives and Sealants
- 8.2.3. Composites
- 8.2.4. Electrical and Electronics
- 8.2.5. Wind Turbines
- 8.2.6. Other Applications
- 8.3. Market Analysis, Insights and Forecast - by Geography
- 8.3.1. China
- 8.3.2. India
- 8.3.3. Japan
- 8.3.4. South Korea
- 8.3.5. ASEAN Countries
- 8.3.6. Rest of Asia-Pacific
- 8.1. Market Analysis, Insights and Forecast - by Raw Material
- 9. South Korea APAC Epoxy Resins Industry Analysis, Insights and Forecast, 2019-2031
- 9.1. Market Analysis, Insights and Forecast - by Raw Material
- 9.1.1. DGBEA (Bisphenol A and ECH)
- 9.1.2. DGBEF (Bisphenol F and ECH)
- 9.1.3. Novolac (Formaldehyde and Phenols)
- 9.1.4. Aliphatic (Aliphatic Alcohols)
- 9.1.5. Glycidylamine (Aromatic Amines and ECH)
- 9.1.6. Other Raw Materials
- 9.2. Market Analysis, Insights and Forecast - by Application
- 9.2.1. Paints and Coatings
- 9.2.2. Adhesives and Sealants
- 9.2.3. Composites
- 9.2.4. Electrical and Electronics
- 9.2.5. Wind Turbines
- 9.2.6. Other Applications
- 9.3. Market Analysis, Insights and Forecast - by Geography
- 9.3.1. China
- 9.3.2. India
- 9.3.3. Japan
- 9.3.4. South Korea
- 9.3.5. ASEAN Countries
- 9.3.6. Rest of Asia-Pacific
- 9.1. Market Analysis, Insights and Forecast - by Raw Material
- 10. ASEAN Countries APAC Epoxy Resins Industry Analysis, Insights and Forecast, 2019-2031
- 10.1. Market Analysis, Insights and Forecast - by Raw Material
- 10.1.1. DGBEA (Bisphenol A and ECH)
- 10.1.2. DGBEF (Bisphenol F and ECH)
- 10.1.3. Novolac (Formaldehyde and Phenols)
- 10.1.4. Aliphatic (Aliphatic Alcohols)
- 10.1.5. Glycidylamine (Aromatic Amines and ECH)
- 10.1.6. Other Raw Materials
- 10.2. Market Analysis, Insights and Forecast - by Application
- 10.2.1. Paints and Coatings
- 10.2.2. Adhesives and Sealants
- 10.2.3. Composites
- 10.2.4. Electrical and Electronics
- 10.2.5. Wind Turbines
- 10.2.6. Other Applications
- 10.3. Market Analysis, Insights and Forecast - by Geography
- 10.3.1. China
- 10.3.2. India
- 10.3.3. Japan
- 10.3.4. South Korea
- 10.3.5. ASEAN Countries
- 10.3.6. Rest of Asia-Pacific
- 10.1. Market Analysis, Insights and Forecast - by Raw Material
- 11. Rest of Asia Pacific APAC Epoxy Resins Industry Analysis, Insights and Forecast, 2019-2031
- 11.1. Market Analysis, Insights and Forecast - by Raw Material
- 11.1.1. DGBEA (Bisphenol A and ECH)
- 11.1.2. DGBEF (Bisphenol F and ECH)
- 11.1.3. Novolac (Formaldehyde and Phenols)
- 11.1.4. Aliphatic (Aliphatic Alcohols)
- 11.1.5. Glycidylamine (Aromatic Amines and ECH)
- 11.1.6. Other Raw Materials
- 11.2. Market Analysis, Insights and Forecast - by Application
- 11.2.1. Paints and Coatings
- 11.2.2. Adhesives and Sealants
- 11.2.3. Composites
- 11.2.4. Electrical and Electronics
- 11.2.5. Wind Turbines
- 11.2.6. Other Applications
- 11.3. Market Analysis, Insights and Forecast - by Geography
- 11.3.1. China
- 11.3.2. India
- 11.3.3. Japan
- 11.3.4. South Korea
- 11.3.5. ASEAN Countries
- 11.3.6. Rest of Asia-Pacific
- 11.1. Market Analysis, Insights and Forecast - by Raw Material
- 12. North America APAC Epoxy Resins Industry Analysis, Insights and Forecast, 2019-2031
- 12.1. Market Analysis, Insights and Forecast - By Country/Sub-region
- 12.1.1 United States
- 12.1.2 Canada
- 12.1.3 Mexico
- 13. Europe APAC Epoxy Resins Industry Analysis, Insights and Forecast, 2019-2031
- 13.1. Market Analysis, Insights and Forecast - By Country/Sub-region
- 13.1.1 Germany
- 13.1.2 United Kingdom
- 13.1.3 France
- 13.1.4 Spain
- 13.1.5 Italy
- 13.1.6 Spain
- 13.1.7 Belgium
- 13.1.8 Netherland
- 13.1.9 Nordics
- 13.1.10 Rest of Europe
- 14. Asia Pacific APAC Epoxy Resins Industry Analysis, Insights and Forecast, 2019-2031
- 14.1. Market Analysis, Insights and Forecast - By Country/Sub-region
- 14.1.1 China
- 14.1.2 Japan
- 14.1.3 India
- 14.1.4 South Korea
- 14.1.5 Southeast Asia
- 14.1.6 Australia
- 14.1.7 Indonesia
- 14.1.8 Phillipes
- 14.1.9 Singapore
- 14.1.10 Thailandc
- 14.1.11 Rest of Asia Pacific
- 15. South America APAC Epoxy Resins Industry Analysis, Insights and Forecast, 2019-2031
- 15.1. Market Analysis, Insights and Forecast - By Country/Sub-region
- 15.1.1 Brazil
- 15.1.2 Argentina
- 15.1.3 Peru
- 15.1.4 Chile
- 15.1.5 Colombia
- 15.1.6 Ecuador
- 15.1.7 Venezuela
- 15.1.8 Rest of South America
- 16. MEA APAC Epoxy Resins Industry Analysis, Insights and Forecast, 2019-2031
- 16.1. Market Analysis, Insights and Forecast - By Country/Sub-region
- 16.1.1 United Arab Emirates
- 16.1.2 Saudi Arabia
- 16.1.3 South Africa
- 16.1.4 Rest of Middle East and Africa
- 17. Competitive Analysis
- 17.1. Global Market Share Analysis 2024
- 17.2. Company Profiles
- 17.2.1 Jiangsu Sanmu Group Co Ltd
- 17.2.1.1. Overview
- 17.2.1.2. Products
- 17.2.1.3. SWOT Analysis
- 17.2.1.4. Recent Developments
- 17.2.1.5. Financials (Based on Availability)
- 17.2.2 Nan Ya Plastics Corporation
- 17.2.2.1. Overview
- 17.2.2.2. Products
- 17.2.2.3. SWOT Analysis
- 17.2.2.4. Recent Developments
- 17.2.2.5. Financials (Based on Availability)
- 17.2.3 3M
- 17.2.3.1. Overview
- 17.2.3.2. Products
- 17.2.3.3. SWOT Analysis
- 17.2.3.4. Recent Developments
- 17.2.3.5. Financials (Based on Availability)
- 17.2.4 BASF SE
- 17.2.4.1. Overview
- 17.2.4.2. Products
- 17.2.4.3. SWOT Analysis
- 17.2.4.4. Recent Developments
- 17.2.4.5. Financials (Based on Availability)
- 17.2.5 Huntsman International LLC
- 17.2.5.1. Overview
- 17.2.5.2. Products
- 17.2.5.3. SWOT Analysis
- 17.2.5.4. Recent Developments
- 17.2.5.5. Financials (Based on Availability)
- 17.2.6 Aditya Birla Chemicals
- 17.2.6.1. Overview
- 17.2.6.2. Products
- 17.2.6.3. SWOT Analysis
- 17.2.6.4. Recent Developments
- 17.2.6.5. Financials (Based on Availability)
- 17.2.7 Daicel Corporation
- 17.2.7.1. Overview
- 17.2.7.2. Products
- 17.2.7.3. SWOT Analysis
- 17.2.7.4. Recent Developments
- 17.2.7.5. Financials (Based on Availability)
- 17.2.8 Hexion
- 17.2.8.1. Overview
- 17.2.8.2. Products
- 17.2.8.3. SWOT Analysis
- 17.2.8.4. Recent Developments
- 17.2.8.5. Financials (Based on Availability)
- 17.2.9 Chang Chun Plastics Co Ltd
- 17.2.9.1. Overview
- 17.2.9.2. Products
- 17.2.9.3. SWOT Analysis
- 17.2.9.4. Recent Developments
- 17.2.9.5. Financials (Based on Availability)
- 17.2.10 Kukdo Chemicals Co Ltd
- 17.2.10.1. Overview
- 17.2.10.2. Products
- 17.2.10.3. SWOT Analysis
- 17.2.10.4. Recent Developments
- 17.2.10.5. Financials (Based on Availability)
- 17.2.11 Olin Corporation*List Not Exhaustive
- 17.2.11.1. Overview
- 17.2.11.2. Products
- 17.2.11.3. SWOT Analysis
- 17.2.11.4. Recent Developments
- 17.2.11.5. Financials (Based on Availability)
- 17.2.12 Covestro AG
- 17.2.12.1. Overview
- 17.2.12.2. Products
- 17.2.12.3. SWOT Analysis
- 17.2.12.4. Recent Developments
- 17.2.12.5. Financials (Based on Availability)
- 17.2.13 Atul Ltd
- 17.2.13.1. Overview
- 17.2.13.2. Products
- 17.2.13.3. SWOT Analysis
- 17.2.13.4. Recent Developments
- 17.2.13.5. Financials (Based on Availability)
- 17.2.1 Jiangsu Sanmu Group Co Ltd
List of Figures
- Figure 1: Global APAC Epoxy Resins Industry Revenue Breakdown (Million, %) by Region 2024 & 2032
- Figure 2: North America APAC Epoxy Resins Industry Revenue (Million), by Country 2024 & 2032
- Figure 3: North America APAC Epoxy Resins Industry Revenue Share (%), by Country 2024 & 2032
- Figure 4: Europe APAC Epoxy Resins Industry Revenue (Million), by Country 2024 & 2032
- Figure 5: Europe APAC Epoxy Resins Industry Revenue Share (%), by Country 2024 & 2032
- Figure 6: Asia Pacific APAC Epoxy Resins Industry Revenue (Million), by Country 2024 & 2032
- Figure 7: Asia Pacific APAC Epoxy Resins Industry Revenue Share (%), by Country 2024 & 2032
- Figure 8: South America APAC Epoxy Resins Industry Revenue (Million), by Country 2024 & 2032
- Figure 9: South America APAC Epoxy Resins Industry Revenue Share (%), by Country 2024 & 2032
- Figure 10: MEA APAC Epoxy Resins Industry Revenue (Million), by Country 2024 & 2032
- Figure 11: MEA APAC Epoxy Resins Industry Revenue Share (%), by Country 2024 & 2032
- Figure 12: China APAC Epoxy Resins Industry Revenue (Million), by Raw Material 2024 & 2032
- Figure 13: China APAC Epoxy Resins Industry Revenue Share (%), by Raw Material 2024 & 2032
- Figure 14: China APAC Epoxy Resins Industry Revenue (Million), by Application 2024 & 2032
- Figure 15: China APAC Epoxy Resins Industry Revenue Share (%), by Application 2024 & 2032
- Figure 16: China APAC Epoxy Resins Industry Revenue (Million), by Geography 2024 & 2032
- Figure 17: China APAC Epoxy Resins Industry Revenue Share (%), by Geography 2024 & 2032
- Figure 18: China APAC Epoxy Resins Industry Revenue (Million), by Country 2024 & 2032
- Figure 19: China APAC Epoxy Resins Industry Revenue Share (%), by Country 2024 & 2032
- Figure 20: India APAC Epoxy Resins Industry Revenue (Million), by Raw Material 2024 & 2032
- Figure 21: India APAC Epoxy Resins Industry Revenue Share (%), by Raw Material 2024 & 2032
- Figure 22: India APAC Epoxy Resins Industry Revenue (Million), by Application 2024 & 2032
- Figure 23: India APAC Epoxy Resins Industry Revenue Share (%), by Application 2024 & 2032
- Figure 24: India APAC Epoxy Resins Industry Revenue (Million), by Geography 2024 & 2032
- Figure 25: India APAC Epoxy Resins Industry Revenue Share (%), by Geography 2024 & 2032
- Figure 26: India APAC Epoxy Resins Industry Revenue (Million), by Country 2024 & 2032
- Figure 27: India APAC Epoxy Resins Industry Revenue Share (%), by Country 2024 & 2032
- Figure 28: Japan APAC Epoxy Resins Industry Revenue (Million), by Raw Material 2024 & 2032
- Figure 29: Japan APAC Epoxy Resins Industry Revenue Share (%), by Raw Material 2024 & 2032
- Figure 30: Japan APAC Epoxy Resins Industry Revenue (Million), by Application 2024 & 2032
- Figure 31: Japan APAC Epoxy Resins Industry Revenue Share (%), by Application 2024 & 2032
- Figure 32: Japan APAC Epoxy Resins Industry Revenue (Million), by Geography 2024 & 2032
- Figure 33: Japan APAC Epoxy Resins Industry Revenue Share (%), by Geography 2024 & 2032
- Figure 34: Japan APAC Epoxy Resins Industry Revenue (Million), by Country 2024 & 2032
- Figure 35: Japan APAC Epoxy Resins Industry Revenue Share (%), by Country 2024 & 2032
- Figure 36: South Korea APAC Epoxy Resins Industry Revenue (Million), by Raw Material 2024 & 2032
- Figure 37: South Korea APAC Epoxy Resins Industry Revenue Share (%), by Raw Material 2024 & 2032
- Figure 38: South Korea APAC Epoxy Resins Industry Revenue (Million), by Application 2024 & 2032
- Figure 39: South Korea APAC Epoxy Resins Industry Revenue Share (%), by Application 2024 & 2032
- Figure 40: South Korea APAC Epoxy Resins Industry Revenue (Million), by Geography 2024 & 2032
- Figure 41: South Korea APAC Epoxy Resins Industry Revenue Share (%), by Geography 2024 & 2032
- Figure 42: South Korea APAC Epoxy Resins Industry Revenue (Million), by Country 2024 & 2032
- Figure 43: South Korea APAC Epoxy Resins Industry Revenue Share (%), by Country 2024 & 2032
- Figure 44: ASEAN Countries APAC Epoxy Resins Industry Revenue (Million), by Raw Material 2024 & 2032
- Figure 45: ASEAN Countries APAC Epoxy Resins Industry Revenue Share (%), by Raw Material 2024 & 2032
- Figure 46: ASEAN Countries APAC Epoxy Resins Industry Revenue (Million), by Application 2024 & 2032
- Figure 47: ASEAN Countries APAC Epoxy Resins Industry Revenue Share (%), by Application 2024 & 2032
- Figure 48: ASEAN Countries APAC Epoxy Resins Industry Revenue (Million), by Geography 2024 & 2032
- Figure 49: ASEAN Countries APAC Epoxy Resins Industry Revenue Share (%), by Geography 2024 & 2032
- Figure 50: ASEAN Countries APAC Epoxy Resins Industry Revenue (Million), by Country 2024 & 2032
- Figure 51: ASEAN Countries APAC Epoxy Resins Industry Revenue Share (%), by Country 2024 & 2032
- Figure 52: Rest of Asia Pacific APAC Epoxy Resins Industry Revenue (Million), by Raw Material 2024 & 2032
- Figure 53: Rest of Asia Pacific APAC Epoxy Resins Industry Revenue Share (%), by Raw Material 2024 & 2032
- Figure 54: Rest of Asia Pacific APAC Epoxy Resins Industry Revenue (Million), by Application 2024 & 2032
- Figure 55: Rest of Asia Pacific APAC Epoxy Resins Industry Revenue Share (%), by Application 2024 & 2032
- Figure 56: Rest of Asia Pacific APAC Epoxy Resins Industry Revenue (Million), by Geography 2024 & 2032
- Figure 57: Rest of Asia Pacific APAC Epoxy Resins Industry Revenue Share (%), by Geography 2024 & 2032
- Figure 58: Rest of Asia Pacific APAC Epoxy Resins Industry Revenue (Million), by Country 2024 & 2032
- Figure 59: Rest of Asia Pacific APAC Epoxy Resins Industry Revenue Share (%), by Country 2024 & 2032
List of Tables
- Table 1: Global APAC Epoxy Resins Industry Revenue Million Forecast, by Region 2019 & 2032
- Table 2: Global APAC Epoxy Resins Industry Revenue Million Forecast, by Raw Material 2019 & 2032
- Table 3: Global APAC Epoxy Resins Industry Revenue Million Forecast, by Application 2019 & 2032
- Table 4: Global APAC Epoxy Resins Industry Revenue Million Forecast, by Geography 2019 & 2032
- Table 5: Global APAC Epoxy Resins Industry Revenue Million Forecast, by Region 2019 & 2032
- Table 6: Global APAC Epoxy Resins Industry Revenue Million Forecast, by Country 2019 & 2032
- Table 7: United States APAC Epoxy Resins Industry Revenue (Million) Forecast, by Application 2019 & 2032
- Table 8: Canada APAC Epoxy Resins Industry Revenue (Million) Forecast, by Application 2019 & 2032
- Table 9: Mexico APAC Epoxy Resins Industry Revenue (Million) Forecast, by Application 2019 & 2032
- Table 10: Global APAC Epoxy Resins Industry Revenue Million Forecast, by Country 2019 & 2032
- Table 11: Germany APAC Epoxy Resins Industry Revenue (Million) Forecast, by Application 2019 & 2032
- Table 12: United Kingdom APAC Epoxy Resins Industry Revenue (Million) Forecast, by Application 2019 & 2032
- Table 13: France APAC Epoxy Resins Industry Revenue (Million) Forecast, by Application 2019 & 2032
- Table 14: Spain APAC Epoxy Resins Industry Revenue (Million) Forecast, by Application 2019 & 2032
- Table 15: Italy APAC Epoxy Resins Industry Revenue (Million) Forecast, by Application 2019 & 2032
- Table 16: Spain APAC Epoxy Resins Industry Revenue (Million) Forecast, by Application 2019 & 2032
- Table 17: Belgium APAC Epoxy Resins Industry Revenue (Million) Forecast, by Application 2019 & 2032
- Table 18: Netherland APAC Epoxy Resins Industry Revenue (Million) Forecast, by Application 2019 & 2032
- Table 19: Nordics APAC Epoxy Resins Industry Revenue (Million) Forecast, by Application 2019 & 2032
- Table 20: Rest of Europe APAC Epoxy Resins Industry Revenue (Million) Forecast, by Application 2019 & 2032
- Table 21: Global APAC Epoxy Resins Industry Revenue Million Forecast, by Country 2019 & 2032
- Table 22: China APAC Epoxy Resins Industry Revenue (Million) Forecast, by Application 2019 & 2032
- Table 23: Japan APAC Epoxy Resins Industry Revenue (Million) Forecast, by Application 2019 & 2032
- Table 24: India APAC Epoxy Resins Industry Revenue (Million) Forecast, by Application 2019 & 2032
- Table 25: South Korea APAC Epoxy Resins Industry Revenue (Million) Forecast, by Application 2019 & 2032
- Table 26: Southeast Asia APAC Epoxy Resins Industry Revenue (Million) Forecast, by Application 2019 & 2032
- Table 27: Australia APAC Epoxy Resins Industry Revenue (Million) Forecast, by Application 2019 & 2032
- Table 28: Indonesia APAC Epoxy Resins Industry Revenue (Million) Forecast, by Application 2019 & 2032
- Table 29: Phillipes APAC Epoxy Resins Industry Revenue (Million) Forecast, by Application 2019 & 2032
- Table 30: Singapore APAC Epoxy Resins Industry Revenue (Million) Forecast, by Application 2019 & 2032
- Table 31: Thailandc APAC Epoxy Resins Industry Revenue (Million) Forecast, by Application 2019 & 2032
- Table 32: Rest of Asia Pacific APAC Epoxy Resins Industry Revenue (Million) Forecast, by Application 2019 & 2032
- Table 33: Global APAC Epoxy Resins Industry Revenue Million Forecast, by Country 2019 & 2032
- Table 34: Brazil APAC Epoxy Resins Industry Revenue (Million) Forecast, by Application 2019 & 2032
- Table 35: Argentina APAC Epoxy Resins Industry Revenue (Million) Forecast, by Application 2019 & 2032
- Table 36: Peru APAC Epoxy Resins Industry Revenue (Million) Forecast, by Application 2019 & 2032
- Table 37: Chile APAC Epoxy Resins Industry Revenue (Million) Forecast, by Application 2019 & 2032
- Table 38: Colombia APAC Epoxy Resins Industry Revenue (Million) Forecast, by Application 2019 & 2032
- Table 39: Ecuador APAC Epoxy Resins Industry Revenue (Million) Forecast, by Application 2019 & 2032
- Table 40: Venezuela APAC Epoxy Resins Industry Revenue (Million) Forecast, by Application 2019 & 2032
- Table 41: Rest of South America APAC Epoxy Resins Industry Revenue (Million) Forecast, by Application 2019 & 2032
- Table 42: Global APAC Epoxy Resins Industry Revenue Million Forecast, by Country 2019 & 2032
- Table 43: United Arab Emirates APAC Epoxy Resins Industry Revenue (Million) Forecast, by Application 2019 & 2032
- Table 44: Saudi Arabia APAC Epoxy Resins Industry Revenue (Million) Forecast, by Application 2019 & 2032
- Table 45: South Africa APAC Epoxy Resins Industry Revenue (Million) Forecast, by Application 2019 & 2032
- Table 46: Rest of Middle East and Africa APAC Epoxy Resins Industry Revenue (Million) Forecast, by Application 2019 & 2032
- Table 47: Global APAC Epoxy Resins Industry Revenue Million Forecast, by Raw Material 2019 & 2032
- Table 48: Global APAC Epoxy Resins Industry Revenue Million Forecast, by Application 2019 & 2032
- Table 49: Global APAC Epoxy Resins Industry Revenue Million Forecast, by Geography 2019 & 2032
- Table 50: Global APAC Epoxy Resins Industry Revenue Million Forecast, by Country 2019 & 2032
- Table 51: Global APAC Epoxy Resins Industry Revenue Million Forecast, by Raw Material 2019 & 2032
- Table 52: Global APAC Epoxy Resins Industry Revenue Million Forecast, by Application 2019 & 2032
- Table 53: Global APAC Epoxy Resins Industry Revenue Million Forecast, by Geography 2019 & 2032
- Table 54: Global APAC Epoxy Resins Industry Revenue Million Forecast, by Country 2019 & 2032
- Table 55: Global APAC Epoxy Resins Industry Revenue Million Forecast, by Raw Material 2019 & 2032
- Table 56: Global APAC Epoxy Resins Industry Revenue Million Forecast, by Application 2019 & 2032
- Table 57: Global APAC Epoxy Resins Industry Revenue Million Forecast, by Geography 2019 & 2032
- Table 58: Global APAC Epoxy Resins Industry Revenue Million Forecast, by Country 2019 & 2032
- Table 59: Global APAC Epoxy Resins Industry Revenue Million Forecast, by Raw Material 2019 & 2032
- Table 60: Global APAC Epoxy Resins Industry Revenue Million Forecast, by Application 2019 & 2032
- Table 61: Global APAC Epoxy Resins Industry Revenue Million Forecast, by Geography 2019 & 2032
- Table 62: Global APAC Epoxy Resins Industry Revenue Million Forecast, by Country 2019 & 2032
- Table 63: Global APAC Epoxy Resins Industry Revenue Million Forecast, by Raw Material 2019 & 2032
- Table 64: Global APAC Epoxy Resins Industry Revenue Million Forecast, by Application 2019 & 2032
- Table 65: Global APAC Epoxy Resins Industry Revenue Million Forecast, by Geography 2019 & 2032
- Table 66: Global APAC Epoxy Resins Industry Revenue Million Forecast, by Country 2019 & 2032
- Table 67: Global APAC Epoxy Resins Industry Revenue Million Forecast, by Raw Material 2019 & 2032
- Table 68: Global APAC Epoxy Resins Industry Revenue Million Forecast, by Application 2019 & 2032
- Table 69: Global APAC Epoxy Resins Industry Revenue Million Forecast, by Geography 2019 & 2032
- Table 70: Global APAC Epoxy Resins Industry Revenue Million Forecast, by Country 2019 & 2032
Frequently Asked Questions
1. What is the projected Compound Annual Growth Rate (CAGR) of the APAC Epoxy Resins Industry?
The projected CAGR is approximately > 5.00%.
2. Which companies are prominent players in the APAC Epoxy Resins Industry?
Key companies in the market include Jiangsu Sanmu Group Co Ltd, Nan Ya Plastics Corporation, 3M, BASF SE, Huntsman International LLC, Aditya Birla Chemicals, Daicel Corporation, Hexion, Chang Chun Plastics Co Ltd, Kukdo Chemicals Co Ltd, Olin Corporation*List Not Exhaustive, Covestro AG, Atul Ltd.
3. What are the main segments of the APAC Epoxy Resins Industry?
The market segments include Raw Material, Application, Geography.
4. Can you provide details about the market size?
The market size is estimated to be USD XX Million as of 2022.
5. What are some drivers contributing to market growth?
; Strong Growth of the Construction Industry; Rising Demand for Electrical and Electronic Devices.
6. What are the notable trends driving market growth?
Paints and Coatings Segment to Dominate the Market.
7. Are there any restraints impacting market growth?
; Hazardous Impact of Epoxy on Health; Impact of COVID-19 Pandemic; Other Restraints.
8. Can you provide examples of recent developments in the market?
N/A
9. What pricing options are available for accessing the report?
Pricing options include single-user, multi-user, and enterprise licenses priced at USD 4750, USD 5250, and USD 8750 respectively.
10. Is the market size provided in terms of value or volume?
The market size is provided in terms of value, measured in Million.
11. Are there any specific market keywords associated with the report?
Yes, the market keyword associated with the report is "APAC Epoxy Resins Industry," which aids in identifying and referencing the specific market segment covered.
12. How do I determine which pricing option suits my needs best?
The pricing options vary based on user requirements and access needs. Individual users may opt for single-user licenses, while businesses requiring broader access may choose multi-user or enterprise licenses for cost-effective access to the report.
13. Are there any additional resources or data provided in the APAC Epoxy Resins Industry report?
While the report offers comprehensive insights, it's advisable to review the specific contents or supplementary materials provided to ascertain if additional resources or data are available.
14. How can I stay updated on further developments or reports in the APAC Epoxy Resins Industry?
To stay informed about further developments, trends, and reports in the APAC Epoxy Resins Industry, consider subscribing to industry newsletters, following relevant companies and organizations, or regularly checking reputable industry news sources and publications.
Methodology
Step 1 - Identification of Relevant Samples Size from Population Database


Step 2 - Approaches for Defining Global Market Size (Value, Volume* & Price*)

Note*: In applicable scenarios
Step 3 - Data Sources
Primary Research
- Web Analytics
- Survey Reports
- Research Institute
- Latest Research Reports
- Opinion Leaders
Secondary Research
- Annual Reports
- White Paper
- Latest Press Release
- Industry Association
- Paid Database
- Investor Presentations

Step 4 - Data Triangulation
Involves using different sources of information in order to increase the validity of a study
These sources are likely to be stakeholders in a program - participants, other researchers, program staff, other community members, and so on.
Then we put all data in single framework & apply various statistical tools to find out the dynamic on the market.
During the analysis stage, feedback from the stakeholder groups would be compared to determine areas of agreement as well as areas of divergence


