

Key Insights
The Asia-Pacific (APAC) energy storage market is projected for robust expansion, driven by escalating electricity demand, increased renewable energy integration, and supportive climate change mitigation policies. This dynamic market is forecasted to achieve a Compound Annual Growth Rate (CAGR) of 16.9%. Key growth catalysts include the widespread adoption of solar and wind power, necessitating efficient storage solutions for intermittency management. The electrification of transportation and the rising demand for reliable backup power across residential and commercial sectors further fuel market expansion. Lithium-ion batteries lead the technology landscape due to their superior energy density and lifespan, while lead-acid batteries remain relevant for specific applications. China, India, Japan, and South Korea are prominent contributors, with China anticipated to hold the largest market share driven by significant renewable energy deployment and manufacturing capabilities. Market impediments such as high initial system costs, battery safety and lifecycle concerns, and the need for advanced grid infrastructure are being addressed by technological advancements, declining battery costs, and governmental incentives. Segmentation by application (residential, commercial, industrial) and technology type (lithium-ion, lead-acid, nickel metal hydride) offers diverse investment opportunities.
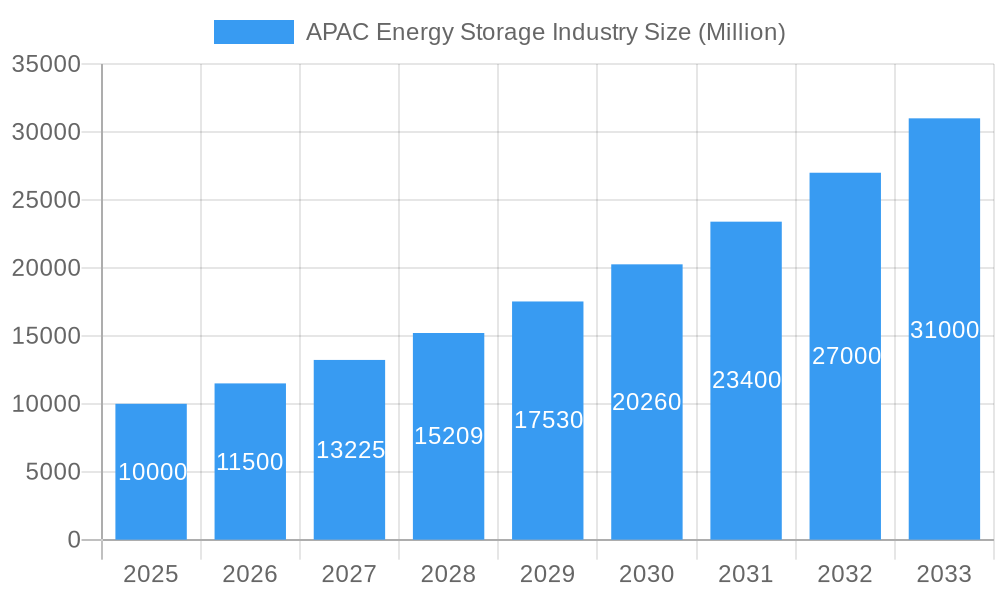
APAC Energy Storage Industry Market Size (In Billion)
The APAC energy storage market is forecast to reach a size of $28.61 billion by 2033, demonstrating significant growth from the $10.45 billion (estimated 2025 value). Sustained expansion will be propelled by continued government subsidies and tax incentives, fostering wider adoption. Technological innovations are expected to enhance battery performance and reduce costs, increasing accessibility. Growing climate change awareness and the imperative to reduce carbon emissions will amplify the demand for renewables and energy storage. The proliferation of smart grids and microgrids will optimize energy management, further stimulating market growth. Increased competition among market players will drive innovation and price reductions, making energy storage solutions more affordable. Regional dynamics within APAC, influenced by diverse energy mixes and policy priorities, will also shape growth trajectories.
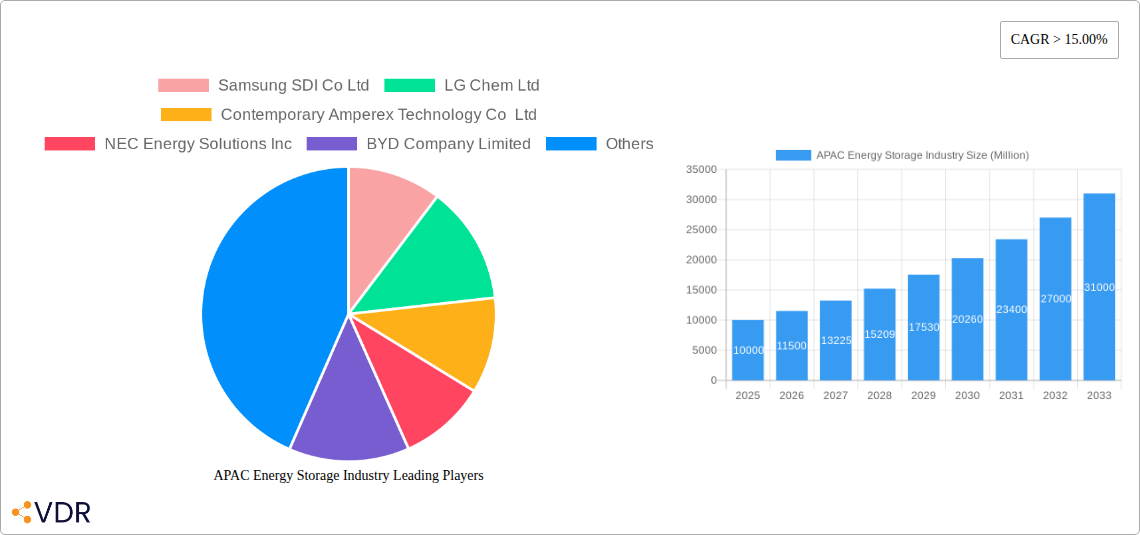
APAC Energy Storage Industry Company Market Share
APAC Energy Storage Industry Market Report: 2019-2033
This comprehensive report provides an in-depth analysis of the Asia-Pacific (APAC) energy storage industry, covering market dynamics, growth trends, key players, and future outlook. The study period spans from 2019 to 2033, with a base year of 2025 and a forecast period from 2025 to 2033. This report is essential for industry professionals, investors, and policymakers seeking to understand and capitalize on the burgeoning APAC energy storage market.
APAC Energy Storage Industry Market Dynamics & Structure
This section analyzes the APAC energy storage market's structure, encompassing market concentration, technological innovation, regulatory landscapes, competitive substitutes, end-user demographics, and M&A activities. We delve into the competitive dynamics, examining the market share of key players like Samsung SDI Co Ltd, LG Chem Ltd, Contemporary Amperex Technology Co Ltd, and Tesla Inc. The report quantifies market concentration using metrics such as the Herfindahl-Hirschman Index (HHI) and identifies prevalent M&A trends through deal volume analysis for the period 2019-2024 (xx deals).
- Market Concentration: The APAC energy storage market exhibits a moderately concentrated structure with xx% market share held by the top 5 players in 2024.
- Technological Innovation: Lithium-ion battery technology dominates, but innovations in solid-state batteries and other technologies are emerging. xx% of the market in 2024 used Lithium-ion batteries.
- Regulatory Framework: Government policies promoting renewable energy integration are driving market growth, alongside initiatives addressing grid stability and energy security.
- Competitive Substitutes: Pumped hydro storage and other energy storage technologies compete with battery storage systems. The market share of substitutes is predicted to be xx% in 2025.
- End-User Demographics: Growth is driven by increasing demand from residential, commercial, and industrial sectors, with the industrial segment exhibiting the fastest growth rate (xx% CAGR 2025-2033).
- M&A Trends: Consolidation through mergers and acquisitions is expected to intensify, driven by the need for economies of scale and technological advancements.
APAC Energy Storage Industry Growth Trends & Insights
This section provides a detailed analysis of the APAC energy storage market's growth trajectory, using data from 2019 to 2024 to project growth to 2033. We analyze market size evolution, adoption rates across various sectors, technological disruptions such as the rise of solid-state batteries, and shifts in consumer behavior towards sustainable energy solutions. Specific metrics including Compound Annual Growth Rate (CAGR) and market penetration rates are provided. The market is expected to reach xx million units by 2033, exhibiting a CAGR of xx% from 2025 to 2033.
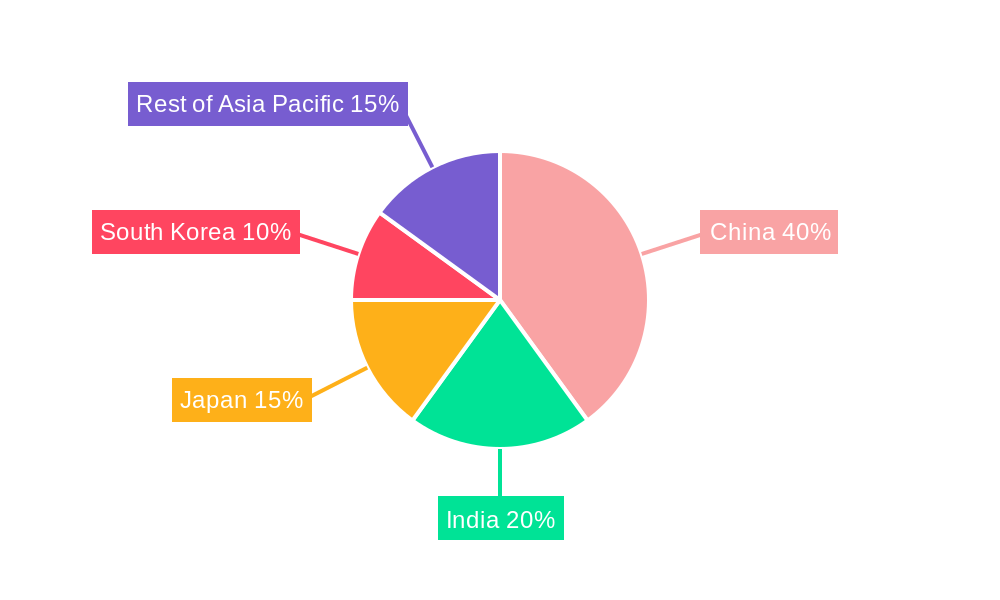
Dominant Regions, Countries, or Segments in APAC Energy Storage Industry
This section pinpoints the leading regions, countries, and segments within the APAC energy storage market driving growth. We focus on Application (Residential, Commercial, Industrial) and Technology Type (Lithium-ion Batteries, Lead-Acid Batteries, Nickel Metal Hydride, Others) segments. China and Australia are projected to dominate the market. Key drivers for this dominance are analyzed using both quantitative data (market share, growth potential) and qualitative factors (economic policies, infrastructure development, government support).
- Leading Region: China is projected to be the largest market in APAC, holding a market share of xx% in 2025.
- Leading Country: China's significant renewable energy capacity and government incentives heavily influence its market leadership. Australia also shows high growth due to recent investments in large-scale battery projects.
- Leading Application Segment: The industrial segment, driven by large-scale energy storage needs, is the fastest growing application segment, projected to have xx% market share in 2025.
- Leading Technology Type: Lithium-ion batteries are the dominant technology type, with xx% market share in 2025, due to higher energy density and longer lifespan compared to other battery technologies.
APAC Energy Storage Industry Product Landscape
The APAC energy storage market features a diverse product landscape encompassing various battery chemistries, system configurations, and power capacities. Significant technological advancements are driving improved energy density, longer lifespans, and enhanced safety features. Key innovations include improved thermal management systems and advanced battery management systems (BMS) enhancing performance and efficiency. This diversity allows for customized solutions tailored to specific applications and end-user requirements.
Key Drivers, Barriers & Challenges in APAC Energy Storage Industry
This section identifies both the key drivers and challenges impacting the growth trajectory of the APAC energy storage market.
Key Drivers:
- Growing renewable energy integration needs.
- Government support and incentives for energy storage deployment.
- Increasing electricity prices and grid instability concerns.
Challenges:
- High initial investment costs.
- Raw material supply chain constraints (impact on costs and availability: xx%).
- Technological limitations hindering large-scale deployment of some battery types.
- Regulatory complexities and standardization issues.
Emerging Opportunities in APAC Energy Storage Industry
Emerging opportunities arise from expanding the energy storage market within microgrids and remote areas, increasing demand for energy storage coupled with electric vehicles (EVs), and innovation in battery technologies. Specific unmet needs in these areas offer significant untapped market potential.
Growth Accelerators in the APAC Energy Storage Industry
Long-term growth will be accelerated by technological breakthroughs in battery technology, strategic partnerships and joint ventures to enhance the efficiency of energy storage solutions and cost reduction, and expansion into new markets driven by the increasing demand for renewable energy integration and improved grid management.
Key Players Shaping the APAC Energy Storage Industry Market
Notable Milestones in APAC Energy Storage Industry Sector
- December 2022: Australian government announces AUD 120 million funding for eight large-scale battery projects (200-300 MWh each), impacting grid stability and energy prices.
- March 2022: Indonesia's PLN and IBC launch a 5MW battery energy storage system (BESS) pilot project, signaling growing interest in BESS deployments.
In-Depth APAC Energy Storage Industry Market Outlook
The APAC energy storage market presents substantial future potential driven by increasing renewable energy adoption, supportive government policies, and technological advancements. Strategic opportunities exist in developing innovative solutions to address grid stability and energy security challenges, coupled with exploring untapped markets in remote areas and emerging economies within the region. This market is poised for robust expansion, presenting significant investment and growth prospects for companies operating within the sector.
APAC Energy Storage Industry Segmentation
-
1. Technology Type
- 1.1. Lithium-ion Batteries
- 1.2. Lead-Acid Batteries
- 1.3. Nickel Metal Hydride
- 1.4. Others
-
2. Application
- 2.1. Residential
- 2.2. Commercial
- 2.3. Industrial
-
3. Geography
- 3.1. China
- 3.2. India
- 3.3. Japan
- 3.4. South Korea
- 3.5. Rest of Asia-Pacific
APAC Energy Storage Industry Segmentation By Geography
- 1. China
- 2. India
- 3. Japan
- 4. South Korea
- 5. Rest of Asia Pacific
APAC Energy Storage Industry Regional Market Share
Geographic Coverage of APAC Energy Storage Industry
APAC Energy Storage Industry REPORT HIGHLIGHTS
| Aspects | Details |
|---|---|
| Study Period | 2020-2034 |
| Base Year | 2025 |
| Estimated Year | 2026 |
| Forecast Period | 2026-2034 |
| Historical Period | 2020-2025 |
| Growth Rate | CAGR of 16.9% from 2020-2034 |
| Segmentation |
|
Table of Contents
- 1. Introduction
- 1.1. Research Scope
- 1.2. Market Segmentation
- 1.3. Research Objective
- 1.4. Definitions and Assumptions
- 2. Executive Summary
- 2.1. Market Snapshot
- 3. Market Dynamics
- 3.1. Market Drivers
- 3.2. Market Restrains
- 3.3. Market Trends
- 3.4. Market Opportunities
- 4. Market Factor Analysis
- 4.1. Porters Five Forces
- 4.1.1. Bargaining Power of Suppliers
- 4.1.2. Bargaining Power of Buyers
- 4.1.3. Threat of New Entrants
- 4.1.4. Threat of Substitutes
- 4.1.5. Competitive Rivalry
- 4.2. PESTEL analysis
- 4.3. BCG Analysis
- 4.3.1. Stars (High Growth, High Market Share)
- 4.3.2. Cash Cows (Low Growth, High Market Share)
- 4.3.3. Question Mark (High Growth, Low Market Share)
- 4.3.4. Dogs (Low Growth, Low Market Share)
- 4.4. Ansoff Matrix Analysis
- 4.5. Supply Chain Analysis
- 4.6. Regulatory Landscape
- 4.7. Current Market Potential and Opportunity Assessment (TAM–SAM–SOM Framework)
- 4.8. VDR Analyst Note
- 4.1. Porters Five Forces
- 5. Market Analysis, Insights and Forecast 2021-2033
- 5.1. Market Analysis, Insights and Forecast - by Technology Type
- 5.1.1. Lithium-ion Batteries
- 5.1.2. Lead-Acid Batteries
- 5.1.3. Nickel Metal Hydride
- 5.1.4. Others
- 5.2. Market Analysis, Insights and Forecast - by Application
- 5.2.1. Residential
- 5.2.2. Commercial
- 5.2.3. Industrial
- 5.3. Market Analysis, Insights and Forecast - by Geography
- 5.3.1. China
- 5.3.2. India
- 5.3.3. Japan
- 5.3.4. South Korea
- 5.3.5. Rest of Asia-Pacific
- 5.4. Market Analysis, Insights and Forecast - by Region
- 5.4.1. China
- 5.4.2. India
- 5.4.3. Japan
- 5.4.4. South Korea
- 5.4.5. Rest of Asia Pacific
- 5.1. Market Analysis, Insights and Forecast - by Technology Type
- 6. Global APAC Energy Storage Industry Analysis, Insights and Forecast, 2021-2033
- 6.1. Market Analysis, Insights and Forecast - by Technology Type
- 6.1.1. Lithium-ion Batteries
- 6.1.2. Lead-Acid Batteries
- 6.1.3. Nickel Metal Hydride
- 6.1.4. Others
- 6.2. Market Analysis, Insights and Forecast - by Application
- 6.2.1. Residential
- 6.2.2. Commercial
- 6.2.3. Industrial
- 6.3. Market Analysis, Insights and Forecast - by Geography
- 6.3.1. China
- 6.3.2. India
- 6.3.3. Japan
- 6.3.4. South Korea
- 6.3.5. Rest of Asia-Pacific
- 6.1. Market Analysis, Insights and Forecast - by Technology Type
- 7. China APAC Energy Storage Industry Analysis, Insights and Forecast, 2021-2033
- 7.1. Market Analysis, Insights and Forecast - by Technology Type
- 7.1.1. Lithium-ion Batteries
- 7.1.2. Lead-Acid Batteries
- 7.1.3. Nickel Metal Hydride
- 7.1.4. Others
- 7.2. Market Analysis, Insights and Forecast - by Application
- 7.2.1. Residential
- 7.2.2. Commercial
- 7.2.3. Industrial
- 7.3. Market Analysis, Insights and Forecast - by Geography
- 7.3.1. China
- 7.3.2. India
- 7.3.3. Japan
- 7.3.4. South Korea
- 7.3.5. Rest of Asia-Pacific
- 7.1. Market Analysis, Insights and Forecast - by Technology Type
- 8. India APAC Energy Storage Industry Analysis, Insights and Forecast, 2021-2033
- 8.1. Market Analysis, Insights and Forecast - by Technology Type
- 8.1.1. Lithium-ion Batteries
- 8.1.2. Lead-Acid Batteries
- 8.1.3. Nickel Metal Hydride
- 8.1.4. Others
- 8.2. Market Analysis, Insights and Forecast - by Application
- 8.2.1. Residential
- 8.2.2. Commercial
- 8.2.3. Industrial
- 8.3. Market Analysis, Insights and Forecast - by Geography
- 8.3.1. China
- 8.3.2. India
- 8.3.3. Japan
- 8.3.4. South Korea
- 8.3.5. Rest of Asia-Pacific
- 8.1. Market Analysis, Insights and Forecast - by Technology Type
- 9. Japan APAC Energy Storage Industry Analysis, Insights and Forecast, 2021-2033
- 9.1. Market Analysis, Insights and Forecast - by Technology Type
- 9.1.1. Lithium-ion Batteries
- 9.1.2. Lead-Acid Batteries
- 9.1.3. Nickel Metal Hydride
- 9.1.4. Others
- 9.2. Market Analysis, Insights and Forecast - by Application
- 9.2.1. Residential
- 9.2.2. Commercial
- 9.2.3. Industrial
- 9.3. Market Analysis, Insights and Forecast - by Geography
- 9.3.1. China
- 9.3.2. India
- 9.3.3. Japan
- 9.3.4. South Korea
- 9.3.5. Rest of Asia-Pacific
- 9.1. Market Analysis, Insights and Forecast - by Technology Type
- 10. South Korea APAC Energy Storage Industry Analysis, Insights and Forecast, 2021-2033
- 10.1. Market Analysis, Insights and Forecast - by Technology Type
- 10.1.1. Lithium-ion Batteries
- 10.1.2. Lead-Acid Batteries
- 10.1.3. Nickel Metal Hydride
- 10.1.4. Others
- 10.2. Market Analysis, Insights and Forecast - by Application
- 10.2.1. Residential
- 10.2.2. Commercial
- 10.2.3. Industrial
- 10.3. Market Analysis, Insights and Forecast - by Geography
- 10.3.1. China
- 10.3.2. India
- 10.3.3. Japan
- 10.3.4. South Korea
- 10.3.5. Rest of Asia-Pacific
- 10.1. Market Analysis, Insights and Forecast - by Technology Type
- 11. Rest of Asia Pacific APAC Energy Storage Industry Analysis, Insights and Forecast, 2021-2033
- 11.1. Market Analysis, Insights and Forecast - by Technology Type
- 11.1.1. Lithium-ion Batteries
- 11.1.2. Lead-Acid Batteries
- 11.1.3. Nickel Metal Hydride
- 11.1.4. Others
- 11.2. Market Analysis, Insights and Forecast - by Application
- 11.2.1. Residential
- 11.2.2. Commercial
- 11.2.3. Industrial
- 11.3. Market Analysis, Insights and Forecast - by Geography
- 11.3.1. China
- 11.3.2. India
- 11.3.3. Japan
- 11.3.4. South Korea
- 11.3.5. Rest of Asia-Pacific
- 11.1. Market Analysis, Insights and Forecast - by Technology Type
- 12. Competitive Analysis
- 12.1. Company Profiles
- 12.1.1 Samsung SDI Co Ltd
- 12.1.1.1. Company Overview
- 12.1.1.2. Products
- 12.1.1.3. Company Financials
- 12.1.1.4. SWOT Analysis
- 12.1.2 LG Chem Ltd
- 12.1.2.1. Company Overview
- 12.1.2.2. Products
- 12.1.2.3. Company Financials
- 12.1.2.4. SWOT Analysis
- 12.1.3 Contemporary Amperex Technology Co Ltd
- 12.1.3.1. Company Overview
- 12.1.3.2. Products
- 12.1.3.3. Company Financials
- 12.1.3.4. SWOT Analysis
- 12.1.4 NEC Energy Solutions Inc
- 12.1.4.1. Company Overview
- 12.1.4.2. Products
- 12.1.4.3. Company Financials
- 12.1.4.4. SWOT Analysis
- 12.1.5 BYD Company Limited
- 12.1.5.1. Company Overview
- 12.1.5.2. Products
- 12.1.5.3. Company Financials
- 12.1.5.4. SWOT Analysis
- 12.1.6 Sunverge Energy LLC*List Not Exhaustive
- 12.1.6.1. Company Overview
- 12.1.6.2. Products
- 12.1.6.3. Company Financials
- 12.1.6.4. SWOT Analysis
- 12.1.7 Tesla Inc
- 12.1.7.1. Company Overview
- 12.1.7.2. Products
- 12.1.7.3. Company Financials
- 12.1.7.4. SWOT Analysis
- 12.1.8 Panasonic Corporation
- 12.1.8.1. Company Overview
- 12.1.8.2. Products
- 12.1.8.3. Company Financials
- 12.1.8.4. SWOT Analysis
- 12.1.1 Samsung SDI Co Ltd
- 12.2. Market Entropy
- 12.2.1 Company's Key Areas Served
- 12.2.2 Recent Developments
- 12.3. Company Market Share Analysis 2025
- 12.3.1 Top 5 Companies Market Share Analysis
- 12.3.2 Top 3 Companies Market Share Analysis
- 12.4. List of Potential Customers
- 13. Research Methodology
List of Figures
- Figure 1: Global APAC Energy Storage Industry Revenue Breakdown (billion, %) by Region 2025 & 2033
- Figure 2: China APAC Energy Storage Industry Revenue (billion), by Technology Type 2025 & 2033
- Figure 3: China APAC Energy Storage Industry Revenue Share (%), by Technology Type 2025 & 2033
- Figure 4: China APAC Energy Storage Industry Revenue (billion), by Application 2025 & 2033
- Figure 5: China APAC Energy Storage Industry Revenue Share (%), by Application 2025 & 2033
- Figure 6: China APAC Energy Storage Industry Revenue (billion), by Geography 2025 & 2033
- Figure 7: China APAC Energy Storage Industry Revenue Share (%), by Geography 2025 & 2033
- Figure 8: China APAC Energy Storage Industry Revenue (billion), by Country 2025 & 2033
- Figure 9: China APAC Energy Storage Industry Revenue Share (%), by Country 2025 & 2033
- Figure 10: India APAC Energy Storage Industry Revenue (billion), by Technology Type 2025 & 2033
- Figure 11: India APAC Energy Storage Industry Revenue Share (%), by Technology Type 2025 & 2033
- Figure 12: India APAC Energy Storage Industry Revenue (billion), by Application 2025 & 2033
- Figure 13: India APAC Energy Storage Industry Revenue Share (%), by Application 2025 & 2033
- Figure 14: India APAC Energy Storage Industry Revenue (billion), by Geography 2025 & 2033
- Figure 15: India APAC Energy Storage Industry Revenue Share (%), by Geography 2025 & 2033
- Figure 16: India APAC Energy Storage Industry Revenue (billion), by Country 2025 & 2033
- Figure 17: India APAC Energy Storage Industry Revenue Share (%), by Country 2025 & 2033
- Figure 18: Japan APAC Energy Storage Industry Revenue (billion), by Technology Type 2025 & 2033
- Figure 19: Japan APAC Energy Storage Industry Revenue Share (%), by Technology Type 2025 & 2033
- Figure 20: Japan APAC Energy Storage Industry Revenue (billion), by Application 2025 & 2033
- Figure 21: Japan APAC Energy Storage Industry Revenue Share (%), by Application 2025 & 2033
- Figure 22: Japan APAC Energy Storage Industry Revenue (billion), by Geography 2025 & 2033
- Figure 23: Japan APAC Energy Storage Industry Revenue Share (%), by Geography 2025 & 2033
- Figure 24: Japan APAC Energy Storage Industry Revenue (billion), by Country 2025 & 2033
- Figure 25: Japan APAC Energy Storage Industry Revenue Share (%), by Country 2025 & 2033
- Figure 26: South Korea APAC Energy Storage Industry Revenue (billion), by Technology Type 2025 & 2033
- Figure 27: South Korea APAC Energy Storage Industry Revenue Share (%), by Technology Type 2025 & 2033
- Figure 28: South Korea APAC Energy Storage Industry Revenue (billion), by Application 2025 & 2033
- Figure 29: South Korea APAC Energy Storage Industry Revenue Share (%), by Application 2025 & 2033
- Figure 30: South Korea APAC Energy Storage Industry Revenue (billion), by Geography 2025 & 2033
- Figure 31: South Korea APAC Energy Storage Industry Revenue Share (%), by Geography 2025 & 2033
- Figure 32: South Korea APAC Energy Storage Industry Revenue (billion), by Country 2025 & 2033
- Figure 33: South Korea APAC Energy Storage Industry Revenue Share (%), by Country 2025 & 2033
- Figure 34: Rest of Asia Pacific APAC Energy Storage Industry Revenue (billion), by Technology Type 2025 & 2033
- Figure 35: Rest of Asia Pacific APAC Energy Storage Industry Revenue Share (%), by Technology Type 2025 & 2033
- Figure 36: Rest of Asia Pacific APAC Energy Storage Industry Revenue (billion), by Application 2025 & 2033
- Figure 37: Rest of Asia Pacific APAC Energy Storage Industry Revenue Share (%), by Application 2025 & 2033
- Figure 38: Rest of Asia Pacific APAC Energy Storage Industry Revenue (billion), by Geography 2025 & 2033
- Figure 39: Rest of Asia Pacific APAC Energy Storage Industry Revenue Share (%), by Geography 2025 & 2033
- Figure 40: Rest of Asia Pacific APAC Energy Storage Industry Revenue (billion), by Country 2025 & 2033
- Figure 41: Rest of Asia Pacific APAC Energy Storage Industry Revenue Share (%), by Country 2025 & 2033
List of Tables
- Table 1: Global APAC Energy Storage Industry Revenue billion Forecast, by Technology Type 2020 & 2033
- Table 2: Global APAC Energy Storage Industry Revenue billion Forecast, by Application 2020 & 2033
- Table 3: Global APAC Energy Storage Industry Revenue billion Forecast, by Geography 2020 & 2033
- Table 4: Global APAC Energy Storage Industry Revenue billion Forecast, by Region 2020 & 2033
- Table 5: Global APAC Energy Storage Industry Revenue billion Forecast, by Technology Type 2020 & 2033
- Table 6: Global APAC Energy Storage Industry Revenue billion Forecast, by Application 2020 & 2033
- Table 7: Global APAC Energy Storage Industry Revenue billion Forecast, by Geography 2020 & 2033
- Table 8: Global APAC Energy Storage Industry Revenue billion Forecast, by Country 2020 & 2033
- Table 9: Global APAC Energy Storage Industry Revenue billion Forecast, by Technology Type 2020 & 2033
- Table 10: Global APAC Energy Storage Industry Revenue billion Forecast, by Application 2020 & 2033
- Table 11: Global APAC Energy Storage Industry Revenue billion Forecast, by Geography 2020 & 2033
- Table 12: Global APAC Energy Storage Industry Revenue billion Forecast, by Country 2020 & 2033
- Table 13: Global APAC Energy Storage Industry Revenue billion Forecast, by Technology Type 2020 & 2033
- Table 14: Global APAC Energy Storage Industry Revenue billion Forecast, by Application 2020 & 2033
- Table 15: Global APAC Energy Storage Industry Revenue billion Forecast, by Geography 2020 & 2033
- Table 16: Global APAC Energy Storage Industry Revenue billion Forecast, by Country 2020 & 2033
- Table 17: Global APAC Energy Storage Industry Revenue billion Forecast, by Technology Type 2020 & 2033
- Table 18: Global APAC Energy Storage Industry Revenue billion Forecast, by Application 2020 & 2033
- Table 19: Global APAC Energy Storage Industry Revenue billion Forecast, by Geography 2020 & 2033
- Table 20: Global APAC Energy Storage Industry Revenue billion Forecast, by Country 2020 & 2033
- Table 21: Global APAC Energy Storage Industry Revenue billion Forecast, by Technology Type 2020 & 2033
- Table 22: Global APAC Energy Storage Industry Revenue billion Forecast, by Application 2020 & 2033
- Table 23: Global APAC Energy Storage Industry Revenue billion Forecast, by Geography 2020 & 2033
- Table 24: Global APAC Energy Storage Industry Revenue billion Forecast, by Country 2020 & 2033
Frequently Asked Questions
1. What is the projected Compound Annual Growth Rate (CAGR) of the APAC Energy Storage Industry?
The projected CAGR is approximately 16.9%.
2. Which companies are prominent players in the APAC Energy Storage Industry?
Key companies in the market include Samsung SDI Co Ltd, LG Chem Ltd, Contemporary Amperex Technology Co Ltd, NEC Energy Solutions Inc, BYD Company Limited, Sunverge Energy LLC*List Not Exhaustive, Tesla Inc, Panasonic Corporation.
3. What are the main segments of the APAC Energy Storage Industry?
The market segments include Technology Type, Application, Geography.
4. Can you provide details about the market size?
The market size is estimated to be USD 28.61 billion as of 2022.
5. What are some drivers contributing to market growth?
4.; Declining Lithium-ion Battery Prices4.; Rapid Adoption of Electric Vehicles.
6. What are the notable trends driving market growth?
Commercial Sector to Witness Significant Growth.
7. Are there any restraints impacting market growth?
4.; The Demand-Supply Mismatch of Raw Materials.
8. Can you provide examples of recent developments in the market?
In December 2022, the Australian government announced that eight large batteries to store renewable energy would be built around Australia to support the grid and help keep energy prices down. Nearly USD 120 million in funding for the projects will be provided by the government-owned Australian Renewable Energy Agency (Arena). The batteries will be located in Gnarwarre, Moorabool, and Mortlake in Victoria, Mount Fox and Western Downs in Queensland, Liddell in New South Wales, and Bungama and Blyth in South Australia. These batteries will range from 200-300 MWh each, have grid-forming inverter technology and are expected to come online by 2025.
9. What pricing options are available for accessing the report?
Pricing options include single-user, multi-user, and enterprise licenses priced at USD 4750, USD 5250, and USD 8750 respectively.
10. Is the market size provided in terms of value or volume?
The market size is provided in terms of value, measured in billion.
11. Are there any specific market keywords associated with the report?
Yes, the market keyword associated with the report is "APAC Energy Storage Industry," which aids in identifying and referencing the specific market segment covered.
12. How do I determine which pricing option suits my needs best?
The pricing options vary based on user requirements and access needs. Individual users may opt for single-user licenses, while businesses requiring broader access may choose multi-user or enterprise licenses for cost-effective access to the report.
13. Are there any additional resources or data provided in the APAC Energy Storage Industry report?
While the report offers comprehensive insights, it's advisable to review the specific contents or supplementary materials provided to ascertain if additional resources or data are available.
14. How can I stay updated on further developments or reports in the APAC Energy Storage Industry?
To stay informed about further developments, trends, and reports in the APAC Energy Storage Industry, consider subscribing to industry newsletters, following relevant companies and organizations, or regularly checking reputable industry news sources and publications.
Methodology
Step 1 - Identification of Relevant Samples Size from Population Database


Step 2 - Approaches for Defining Global Market Size (Value, Volume* & Price*)

Note*: In applicable scenarios
Step 3 - Data Sources
Primary Research
- Web Analytics
- Survey Reports
- Research Institute
- Latest Research Reports
- Opinion Leaders
Secondary Research
- Annual Reports
- White Paper
- Latest Press Release
- Industry Association
- Paid Database
- Investor Presentations

Step 4 - Data Triangulation
Involves using different sources of information in order to increase the validity of a study
These sources are likely to be stakeholders in a program - participants, other researchers, program staff, other community members, and so on.
Then we put all data in single framework & apply various statistical tools to find out the dynamic on the market.
During the analysis stage, feedback from the stakeholder groups would be compared to determine areas of agreement as well as areas of divergence