
Key Insights
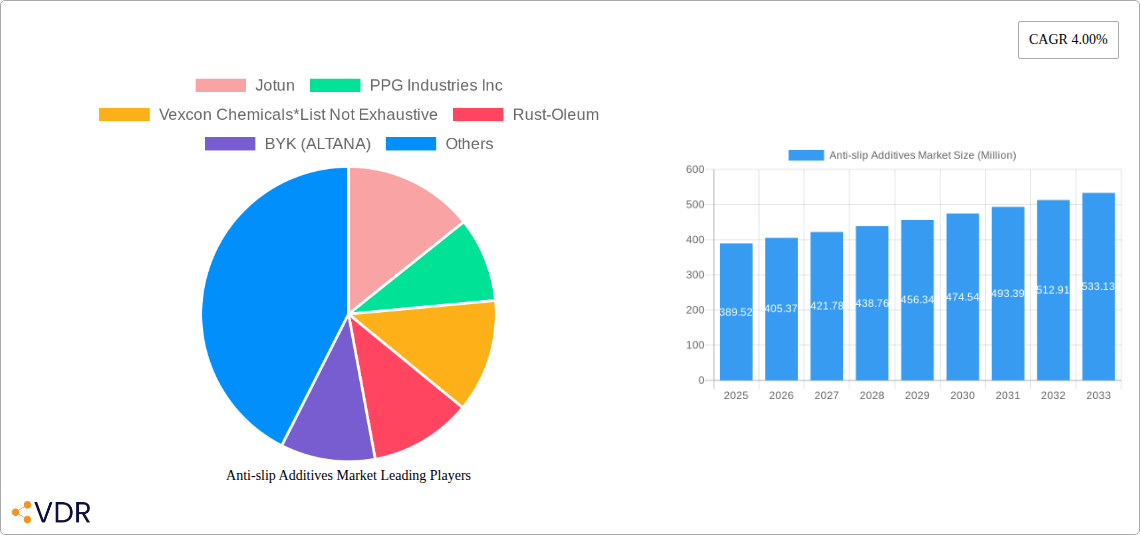
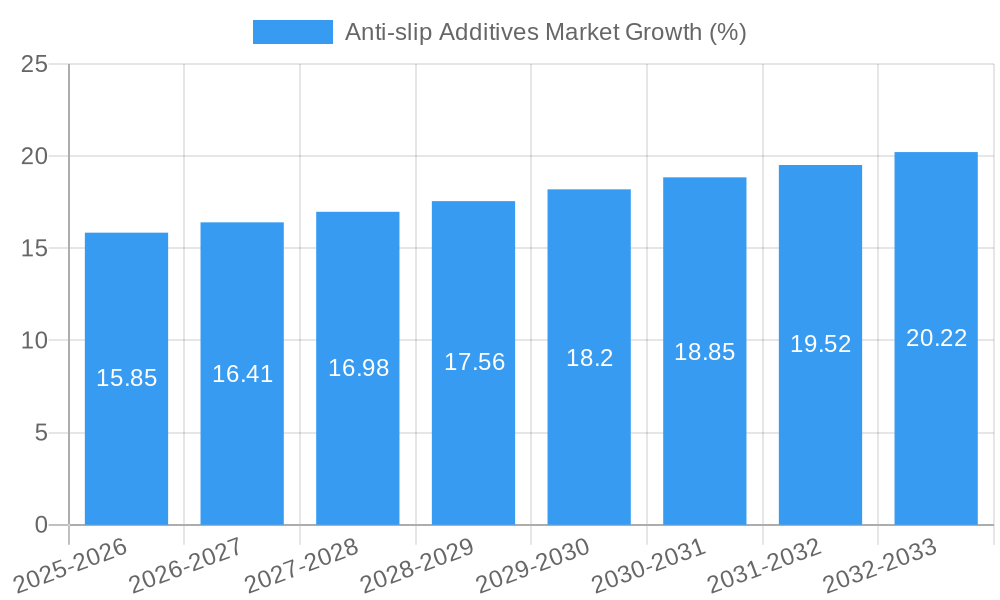
The global anti-slip additives market, valued at $389.52 million in 2025, is projected to experience steady growth, driven by a Compound Annual Growth Rate (CAGR) of 4.00% from 2025 to 2033. This growth is fueled by several key factors. The burgeoning construction industry, particularly in rapidly developing economies across Asia-Pacific, is a significant driver, demanding enhanced safety features in building and industrial flooring applications. Increasing awareness of occupational safety and regulations mandating slip-resistant surfaces in various sectors, including marine and transportation, are further bolstering market demand. The diverse range of additive types, including aluminum oxide, silica, and others, catering to specific application needs, also contributes to market expansion. Innovation in additive nature, encompassing powders, aggregates, and mixes, provides customized solutions for different surface materials and desired slip resistance levels. Major players like Jotun, PPG Industries, and Akzo Nobel are actively engaged in research and development, introducing advanced anti-slip additives with improved performance and sustainability profiles.
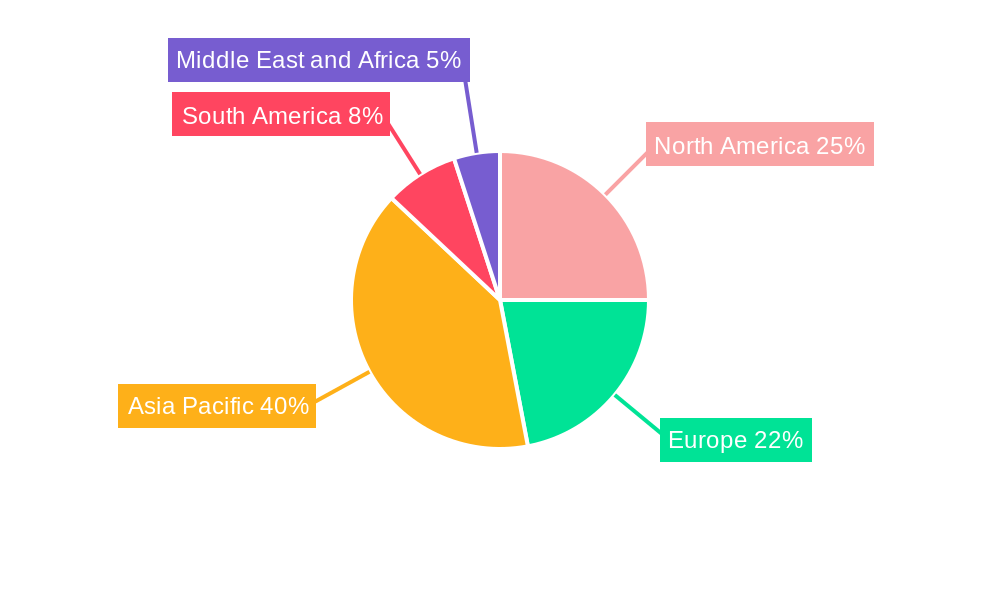
However, market growth might face certain restraints. Fluctuations in raw material prices, particularly for aluminum oxide and silica, can impact profitability and pricing. Furthermore, the adoption of anti-slip additives may be influenced by economic conditions and construction activity levels. Despite these potential challenges, the long-term outlook for the anti-slip additives market remains positive, driven by sustained infrastructural development globally and a growing emphasis on safety standards in diverse industrial sectors. Regional variations in growth are expected, with Asia-Pacific anticipated to lead due to its robust construction industry and expanding industrial base. North America and Europe are also expected to contribute significantly.
Anti-slip Additives Market: A Comprehensive Report (2019-2033)
This in-depth report provides a comprehensive analysis of the global anti-slip additives market, encompassing market dynamics, growth trends, regional segmentation, product landscape, and key players. The report covers the period from 2019 to 2033, with a base year of 2025 and a forecast period of 2025-2033. It serves as an invaluable resource for industry professionals, investors, and stakeholders seeking to understand and capitalize on the opportunities within this growing market. The parent market is the broader coatings and additives industry, while the child market focuses specifically on anti-slip solutions for diverse applications. The market size is projected to reach xx Million by 2033.
Anti-slip Additives Market Dynamics & Structure
This section analyzes the competitive landscape, technological advancements, regulatory influences, and market trends shaping the anti-slip additives market. The market is moderately fragmented, with key players holding significant but not dominant shares. Technological innovation is a primary driver, particularly in developing additives with enhanced performance characteristics. Regulatory frameworks, focusing on workplace safety and environmental considerations, play a significant role in shaping product development and adoption. The availability of substitute products, such as textured surfaces, poses some competition, but the unique advantages of anti-slip additives, including enhanced control and customization, maintain strong market demand.
- Market Concentration: Moderately fragmented, with the top 5 players holding approximately xx% market share in 2025.
- Technological Innovation: Ongoing research into novel materials and formulations, leading to improved slip resistance, durability, and environmental friendliness.
- Regulatory Landscape: Stringent safety regulations in construction, industrial, and marine sectors drive demand for high-performance anti-slip additives.
- Competitive Substitutes: Textured surfaces, although cost-effective in some cases, lack the adaptability and performance consistency offered by anti-slip additives.
- End-User Demographics: A broad base of end-users across various sectors, including construction, industrial, and marine industries, fuels market growth.
- M&A Activity: A moderate level of mergers and acquisitions, primarily focused on expanding product portfolios and gaining access to new technologies (xx deals recorded between 2019 and 2024).
Anti-slip Additives Market Growth Trends & Insights
The global anti-slip additives market has experienced steady growth over the past few years, driven by factors including increasing construction activity, stringent safety regulations, and rising demand for enhanced safety in various industrial settings. The market is expected to register a CAGR of xx% during the forecast period (2025-2033), reaching a market value of xx Million by 2033. This growth is attributed to increasing awareness about workplace safety, the rising adoption of anti-slip additives in diverse applications, and advancements in additive technology. Market penetration is highest in developed economies, but developing nations exhibit significant growth potential due to ongoing infrastructure development and rising disposable incomes. Technological advancements such as the development of bio-based and sustainable anti-slip additives are also contributing to market growth. Consumer behavior shifts are increasingly focused on safety and sustainability, favoring products with improved performance and lower environmental impact.
Dominant Regions, Countries, or Segments in Anti-slip Additives Market
North America and Europe currently dominate the anti-slip additives market, driven by robust construction activity, stringent safety regulations, and a higher adoption rate of advanced technologies. However, the Asia-Pacific region is projected to exhibit the fastest growth rate over the forecast period due to rapid industrialization, increasing infrastructure development, and rising construction activity in developing economies such as China and India.
Leading Segments:
- Additive Type: Aluminum oxide holds the largest market share due to its cost-effectiveness and good slip resistance.
- Additive Nature: Powder additives are currently most widely used due to ease of application and versatility.
- Application: The Buildings and Construction sector leads in terms of consumption volume, followed by Industrial Flooring.
Key Drivers:
- Stringent Safety Regulations: Enforcements of stringent safety regulations in several industries are creating significant demand for improved slip resistance solutions.
- Infrastructure Development: Extensive infrastructure projects, particularly in developing economies, necessitate the use of anti-slip additives in construction and industrial flooring.
- Economic Growth: Increasing disposable income and industrial output are driving demand in several regions.
Anti-slip Additives Market Product Landscape
The anti-slip additives market offers a diverse range of products, including aluminum oxide, silica, and other specialty additives. These are available in various forms, such as powders, aggregates, and pre-mixed blends, catering to diverse application needs and customer preferences. Product innovations focus on enhancing slip resistance, durability, UV resistance, and overall performance. Key selling propositions include improved safety, cost-effectiveness, ease of application, and environmental compatibility. Advancements include the development of bio-based and sustainable anti-slip additives with enhanced performance characteristics.
Key Drivers, Barriers & Challenges in Anti-slip Additives Market
Key Drivers:
- Rising Construction Activity: Global growth in construction and infrastructure projects significantly increases the demand for anti-slip additives.
- Stringent Safety Regulations: Increasingly strict safety regulations in various industries mandate the use of anti-slip materials.
- Technological Advancements: Development of eco-friendly and high-performance anti-slip additives fuels market expansion.
Challenges & Restraints:
- Fluctuating Raw Material Prices: The cost of raw materials, particularly aluminum oxide and silica, influences production costs and profitability.
- Stringent Environmental Regulations: Compliance with environmental regulations may increase production costs.
- Competition from Substitute Products: Other safety solutions (e.g., textured surfaces) pose some competitive pressure.
Emerging Opportunities in Anti-slip Additives Market
- Untapped Markets: Developing economies present significant growth opportunities due to ongoing infrastructure development.
- Innovative Applications: Expansion into new application areas, such as specialized industrial coatings and consumer products, offers significant potential.
- Evolving Consumer Preferences: Demand for sustainable and environmentally friendly additives is creating new opportunities for manufacturers.
Growth Accelerators in the Anti-slip Additives Market Industry
The long-term growth of the anti-slip additives market will be driven by several factors, including technological advancements leading to the development of high-performance and sustainable additives. Strategic partnerships and collaborations between manufacturers and end-users will play a significant role in fostering innovation and market expansion. The expansion into new geographical markets, particularly in developing economies, will also fuel market growth.
Key Players Shaping the Anti-slip Additives Market Market
- Jotun
- PPG Industries Inc
- Vexcon Chemicals
- Rust-Oleum
- BYK (ALTANA)
- Akzo Nobel BV
- Axalta Coating Systems
- Hempel A/S
- Pro Chem Inc
- Associated Chemical
- SAICOS COLOR GmbH
Notable Milestones in Anti-slip Additives Market Sector
- [Month, Year]: Jotun launched a new line of anti-slip coatings with enhanced durability and UV resistance. This significantly improved product performance and broadened their market reach.
- [Month, Year]: PPG Industries acquired a leading manufacturer of anti-slip additives, expanding its product portfolio and market share. This acquisition enhanced PPG's position in the market and strengthened their competitive standing.
- [Month, Year]: Vexcon Chemicals developed a new additive formula that provides superior slip resistance in wet conditions. This innovative product offers a significant improvement in safety and performance.
In-Depth Anti-slip Additives Market Market Outlook
The future of the anti-slip additives market looks promising, driven by several factors including technological advancements, sustainable practices, and growing global demand. Strategic investments in research and development, coupled with strategic partnerships and acquisitions, are expected to accelerate market growth. The expansion into new applications and geographical markets will further fuel market expansion, creating opportunities for both established and emerging players. The focus on sustainable and high-performance products will be a defining characteristic of the market’s future trajectory.
Anti-slip Additives Market Segmentation
-
1. Additive Type
- 1.1. Aluminum oxide
- 1.2. Silica
- 1.3. Other Additive Types
-
2. Additive Nature
- 2.1. Powder
- 2.2. Aggregate
- 2.3. Mix
-
3. Application
- 3.1. Buildings and Construction
- 3.2. Industrial Flooring
- 3.3. Marine
- 3.4. Other Applications
Anti-slip Additives Market Segmentation By Geography
-
1. Asia Pacific
- 1.1. China
- 1.2. India
- 1.3. Japan
- 1.4. South Korea
- 1.5. Rest of Asia Pacific
-
2. North America
- 2.1. United States
- 2.2. Canada
- 2.3. Mexico
-
3. Europe
- 3.1. Germany
- 3.2. United Kingdom
- 3.3. France
- 3.4. Italy
- 3.5. Rest of Europe
-
4. South America
- 4.1. Brazil
- 4.2. Argentina
- 4.3. Rest of South America
-
5. Middle East and Africa
- 5.1. Saudi Arabia
- 5.2. South Africa
- 5.3. Rest of Middle East and Africa
Anti-slip Additives Market REPORT HIGHLIGHTS
| Aspects | Details |
|---|---|
| Study Period | 2019-2033 |
| Base Year | 2024 |
| Estimated Year | 2025 |
| Forecast Period | 2025-2033 |
| Historical Period | 2019-2024 |
| Growth Rate | CAGR of 4.00% from 2019-2033 |
| Segmentation |
|
Table of Contents
- 1. Introduction
- 1.1. Research Scope
- 1.2. Market Segmentation
- 1.3. Research Methodology
- 1.4. Definitions and Assumptions
- 2. Executive Summary
- 2.1. Introduction
- 3. Market Dynamics
- 3.1. Introduction
- 3.2. Market Drivers
- 3.2.1. ; Increasing Application in Industrial Flooring; Increasing Demand from the Marine Industry
- 3.3. Market Restrains
- 3.3.1. ; Stringent Environmental Regulations; Other Restraints
- 3.4. Market Trends
- 3.4.1. Growing Applications in Industrial Flooring
- 4. Market Factor Analysis
- 4.1. Porters Five Forces
- 4.2. Supply/Value Chain
- 4.3. PESTEL analysis
- 4.4. Market Entropy
- 4.5. Patent/Trademark Analysis
- 5. Global Anti-slip Additives Market Analysis, Insights and Forecast, 2019-2031
- 5.1. Market Analysis, Insights and Forecast - by Additive Type
- 5.1.1. Aluminum oxide
- 5.1.2. Silica
- 5.1.3. Other Additive Types
- 5.2. Market Analysis, Insights and Forecast - by Additive Nature
- 5.2.1. Powder
- 5.2.2. Aggregate
- 5.2.3. Mix
- 5.3. Market Analysis, Insights and Forecast - by Application
- 5.3.1. Buildings and Construction
- 5.3.2. Industrial Flooring
- 5.3.3. Marine
- 5.3.4. Other Applications
- 5.4. Market Analysis, Insights and Forecast - by Region
- 5.4.1. Asia Pacific
- 5.4.2. North America
- 5.4.3. Europe
- 5.4.4. South America
- 5.4.5. Middle East and Africa
- 5.1. Market Analysis, Insights and Forecast - by Additive Type
- 6. Asia Pacific Anti-slip Additives Market Analysis, Insights and Forecast, 2019-2031
- 6.1. Market Analysis, Insights and Forecast - by Additive Type
- 6.1.1. Aluminum oxide
- 6.1.2. Silica
- 6.1.3. Other Additive Types
- 6.2. Market Analysis, Insights and Forecast - by Additive Nature
- 6.2.1. Powder
- 6.2.2. Aggregate
- 6.2.3. Mix
- 6.3. Market Analysis, Insights and Forecast - by Application
- 6.3.1. Buildings and Construction
- 6.3.2. Industrial Flooring
- 6.3.3. Marine
- 6.3.4. Other Applications
- 6.1. Market Analysis, Insights and Forecast - by Additive Type
- 7. North America Anti-slip Additives Market Analysis, Insights and Forecast, 2019-2031
- 7.1. Market Analysis, Insights and Forecast - by Additive Type
- 7.1.1. Aluminum oxide
- 7.1.2. Silica
- 7.1.3. Other Additive Types
- 7.2. Market Analysis, Insights and Forecast - by Additive Nature
- 7.2.1. Powder
- 7.2.2. Aggregate
- 7.2.3. Mix
- 7.3. Market Analysis, Insights and Forecast - by Application
- 7.3.1. Buildings and Construction
- 7.3.2. Industrial Flooring
- 7.3.3. Marine
- 7.3.4. Other Applications
- 7.1. Market Analysis, Insights and Forecast - by Additive Type
- 8. Europe Anti-slip Additives Market Analysis, Insights and Forecast, 2019-2031
- 8.1. Market Analysis, Insights and Forecast - by Additive Type
- 8.1.1. Aluminum oxide
- 8.1.2. Silica
- 8.1.3. Other Additive Types
- 8.2. Market Analysis, Insights and Forecast - by Additive Nature
- 8.2.1. Powder
- 8.2.2. Aggregate
- 8.2.3. Mix
- 8.3. Market Analysis, Insights and Forecast - by Application
- 8.3.1. Buildings and Construction
- 8.3.2. Industrial Flooring
- 8.3.3. Marine
- 8.3.4. Other Applications
- 8.1. Market Analysis, Insights and Forecast - by Additive Type
- 9. South America Anti-slip Additives Market Analysis, Insights and Forecast, 2019-2031
- 9.1. Market Analysis, Insights and Forecast - by Additive Type
- 9.1.1. Aluminum oxide
- 9.1.2. Silica
- 9.1.3. Other Additive Types
- 9.2. Market Analysis, Insights and Forecast - by Additive Nature
- 9.2.1. Powder
- 9.2.2. Aggregate
- 9.2.3. Mix
- 9.3. Market Analysis, Insights and Forecast - by Application
- 9.3.1. Buildings and Construction
- 9.3.2. Industrial Flooring
- 9.3.3. Marine
- 9.3.4. Other Applications
- 9.1. Market Analysis, Insights and Forecast - by Additive Type
- 10. Middle East and Africa Anti-slip Additives Market Analysis, Insights and Forecast, 2019-2031
- 10.1. Market Analysis, Insights and Forecast - by Additive Type
- 10.1.1. Aluminum oxide
- 10.1.2. Silica
- 10.1.3. Other Additive Types
- 10.2. Market Analysis, Insights and Forecast - by Additive Nature
- 10.2.1. Powder
- 10.2.2. Aggregate
- 10.2.3. Mix
- 10.3. Market Analysis, Insights and Forecast - by Application
- 10.3.1. Buildings and Construction
- 10.3.2. Industrial Flooring
- 10.3.3. Marine
- 10.3.4. Other Applications
- 10.1. Market Analysis, Insights and Forecast - by Additive Type
- 11. Asia Pacific Anti-slip Additives Market Analysis, Insights and Forecast, 2019-2031
- 11.1. Market Analysis, Insights and Forecast - By Country/Sub-region
- 11.1.1 China
- 11.1.2 India
- 11.1.3 Japan
- 11.1.4 South Korea
- 11.1.5 Rest of Asia Pacific
- 12. North America Anti-slip Additives Market Analysis, Insights and Forecast, 2019-2031
- 12.1. Market Analysis, Insights and Forecast - By Country/Sub-region
- 12.1.1 United States
- 12.1.2 Canada
- 12.1.3 Mexico
- 13. Europe Anti-slip Additives Market Analysis, Insights and Forecast, 2019-2031
- 13.1. Market Analysis, Insights and Forecast - By Country/Sub-region
- 13.1.1 Germany
- 13.1.2 United Kingdom
- 13.1.3 France
- 13.1.4 Italy
- 13.1.5 Rest of Europe
- 14. South America Anti-slip Additives Market Analysis, Insights and Forecast, 2019-2031
- 14.1. Market Analysis, Insights and Forecast - By Country/Sub-region
- 14.1.1 Brazil
- 14.1.2 Argentina
- 14.1.3 Rest of South America
- 15. Middle East and Africa Anti-slip Additives Market Analysis, Insights and Forecast, 2019-2031
- 15.1. Market Analysis, Insights and Forecast - By Country/Sub-region
- 15.1.1 Saudi Arabia
- 15.1.2 South Africa
- 15.1.3 Rest of Middle East and Africa
- 16. Competitive Analysis
- 16.1. Global Market Share Analysis 2024
- 16.2. Company Profiles
- 16.2.1 Jotun
- 16.2.1.1. Overview
- 16.2.1.2. Products
- 16.2.1.3. SWOT Analysis
- 16.2.1.4. Recent Developments
- 16.2.1.5. Financials (Based on Availability)
- 16.2.2 PPG Industries Inc
- 16.2.2.1. Overview
- 16.2.2.2. Products
- 16.2.2.3. SWOT Analysis
- 16.2.2.4. Recent Developments
- 16.2.2.5. Financials (Based on Availability)
- 16.2.3 Vexcon Chemicals*List Not Exhaustive
- 16.2.3.1. Overview
- 16.2.3.2. Products
- 16.2.3.3. SWOT Analysis
- 16.2.3.4. Recent Developments
- 16.2.3.5. Financials (Based on Availability)
- 16.2.4 Rust-Oleum
- 16.2.4.1. Overview
- 16.2.4.2. Products
- 16.2.4.3. SWOT Analysis
- 16.2.4.4. Recent Developments
- 16.2.4.5. Financials (Based on Availability)
- 16.2.5 BYK (ALTANA)
- 16.2.5.1. Overview
- 16.2.5.2. Products
- 16.2.5.3. SWOT Analysis
- 16.2.5.4. Recent Developments
- 16.2.5.5. Financials (Based on Availability)
- 16.2.6 Akzo Nobel BV
- 16.2.6.1. Overview
- 16.2.6.2. Products
- 16.2.6.3. SWOT Analysis
- 16.2.6.4. Recent Developments
- 16.2.6.5. Financials (Based on Availability)
- 16.2.7 Axalta Coating Systems
- 16.2.7.1. Overview
- 16.2.7.2. Products
- 16.2.7.3. SWOT Analysis
- 16.2.7.4. Recent Developments
- 16.2.7.5. Financials (Based on Availability)
- 16.2.8 Hempel A/S
- 16.2.8.1. Overview
- 16.2.8.2. Products
- 16.2.8.3. SWOT Analysis
- 16.2.8.4. Recent Developments
- 16.2.8.5. Financials (Based on Availability)
- 16.2.9 Pro Chem Inc
- 16.2.9.1. Overview
- 16.2.9.2. Products
- 16.2.9.3. SWOT Analysis
- 16.2.9.4. Recent Developments
- 16.2.9.5. Financials (Based on Availability)
- 16.2.10 Associated Chemical
- 16.2.10.1. Overview
- 16.2.10.2. Products
- 16.2.10.3. SWOT Analysis
- 16.2.10.4. Recent Developments
- 16.2.10.5. Financials (Based on Availability)
- 16.2.11 SAICOS COLOR GmbH
- 16.2.11.1. Overview
- 16.2.11.2. Products
- 16.2.11.3. SWOT Analysis
- 16.2.11.4. Recent Developments
- 16.2.11.5. Financials (Based on Availability)
- 16.2.1 Jotun
List of Figures
- Figure 1: Global Anti-slip Additives Market Revenue Breakdown (Million, %) by Region 2024 & 2032
- Figure 2: Global Anti-slip Additives Market Volume Breakdown (K Tons, %) by Region 2024 & 2032
- Figure 3: Asia Pacific Anti-slip Additives Market Revenue (Million), by Country 2024 & 2032
- Figure 4: Asia Pacific Anti-slip Additives Market Volume (K Tons), by Country 2024 & 2032
- Figure 5: Asia Pacific Anti-slip Additives Market Revenue Share (%), by Country 2024 & 2032
- Figure 6: Asia Pacific Anti-slip Additives Market Volume Share (%), by Country 2024 & 2032
- Figure 7: North America Anti-slip Additives Market Revenue (Million), by Country 2024 & 2032
- Figure 8: North America Anti-slip Additives Market Volume (K Tons), by Country 2024 & 2032
- Figure 9: North America Anti-slip Additives Market Revenue Share (%), by Country 2024 & 2032
- Figure 10: North America Anti-slip Additives Market Volume Share (%), by Country 2024 & 2032
- Figure 11: Europe Anti-slip Additives Market Revenue (Million), by Country 2024 & 2032
- Figure 12: Europe Anti-slip Additives Market Volume (K Tons), by Country 2024 & 2032
- Figure 13: Europe Anti-slip Additives Market Revenue Share (%), by Country 2024 & 2032
- Figure 14: Europe Anti-slip Additives Market Volume Share (%), by Country 2024 & 2032
- Figure 15: South America Anti-slip Additives Market Revenue (Million), by Country 2024 & 2032
- Figure 16: South America Anti-slip Additives Market Volume (K Tons), by Country 2024 & 2032
- Figure 17: South America Anti-slip Additives Market Revenue Share (%), by Country 2024 & 2032
- Figure 18: South America Anti-slip Additives Market Volume Share (%), by Country 2024 & 2032
- Figure 19: Middle East and Africa Anti-slip Additives Market Revenue (Million), by Country 2024 & 2032
- Figure 20: Middle East and Africa Anti-slip Additives Market Volume (K Tons), by Country 2024 & 2032
- Figure 21: Middle East and Africa Anti-slip Additives Market Revenue Share (%), by Country 2024 & 2032
- Figure 22: Middle East and Africa Anti-slip Additives Market Volume Share (%), by Country 2024 & 2032
- Figure 23: Asia Pacific Anti-slip Additives Market Revenue (Million), by Additive Type 2024 & 2032
- Figure 24: Asia Pacific Anti-slip Additives Market Volume (K Tons), by Additive Type 2024 & 2032
- Figure 25: Asia Pacific Anti-slip Additives Market Revenue Share (%), by Additive Type 2024 & 2032
- Figure 26: Asia Pacific Anti-slip Additives Market Volume Share (%), by Additive Type 2024 & 2032
- Figure 27: Asia Pacific Anti-slip Additives Market Revenue (Million), by Additive Nature 2024 & 2032
- Figure 28: Asia Pacific Anti-slip Additives Market Volume (K Tons), by Additive Nature 2024 & 2032
- Figure 29: Asia Pacific Anti-slip Additives Market Revenue Share (%), by Additive Nature 2024 & 2032
- Figure 30: Asia Pacific Anti-slip Additives Market Volume Share (%), by Additive Nature 2024 & 2032
- Figure 31: Asia Pacific Anti-slip Additives Market Revenue (Million), by Application 2024 & 2032
- Figure 32: Asia Pacific Anti-slip Additives Market Volume (K Tons), by Application 2024 & 2032
- Figure 33: Asia Pacific Anti-slip Additives Market Revenue Share (%), by Application 2024 & 2032
- Figure 34: Asia Pacific Anti-slip Additives Market Volume Share (%), by Application 2024 & 2032
- Figure 35: Asia Pacific Anti-slip Additives Market Revenue (Million), by Country 2024 & 2032
- Figure 36: Asia Pacific Anti-slip Additives Market Volume (K Tons), by Country 2024 & 2032
- Figure 37: Asia Pacific Anti-slip Additives Market Revenue Share (%), by Country 2024 & 2032
- Figure 38: Asia Pacific Anti-slip Additives Market Volume Share (%), by Country 2024 & 2032
- Figure 39: North America Anti-slip Additives Market Revenue (Million), by Additive Type 2024 & 2032
- Figure 40: North America Anti-slip Additives Market Volume (K Tons), by Additive Type 2024 & 2032
- Figure 41: North America Anti-slip Additives Market Revenue Share (%), by Additive Type 2024 & 2032
- Figure 42: North America Anti-slip Additives Market Volume Share (%), by Additive Type 2024 & 2032
- Figure 43: North America Anti-slip Additives Market Revenue (Million), by Additive Nature 2024 & 2032
- Figure 44: North America Anti-slip Additives Market Volume (K Tons), by Additive Nature 2024 & 2032
- Figure 45: North America Anti-slip Additives Market Revenue Share (%), by Additive Nature 2024 & 2032
- Figure 46: North America Anti-slip Additives Market Volume Share (%), by Additive Nature 2024 & 2032
- Figure 47: North America Anti-slip Additives Market Revenue (Million), by Application 2024 & 2032
- Figure 48: North America Anti-slip Additives Market Volume (K Tons), by Application 2024 & 2032
- Figure 49: North America Anti-slip Additives Market Revenue Share (%), by Application 2024 & 2032
- Figure 50: North America Anti-slip Additives Market Volume Share (%), by Application 2024 & 2032
- Figure 51: North America Anti-slip Additives Market Revenue (Million), by Country 2024 & 2032
- Figure 52: North America Anti-slip Additives Market Volume (K Tons), by Country 2024 & 2032
- Figure 53: North America Anti-slip Additives Market Revenue Share (%), by Country 2024 & 2032
- Figure 54: North America Anti-slip Additives Market Volume Share (%), by Country 2024 & 2032
- Figure 55: Europe Anti-slip Additives Market Revenue (Million), by Additive Type 2024 & 2032
- Figure 56: Europe Anti-slip Additives Market Volume (K Tons), by Additive Type 2024 & 2032
- Figure 57: Europe Anti-slip Additives Market Revenue Share (%), by Additive Type 2024 & 2032
- Figure 58: Europe Anti-slip Additives Market Volume Share (%), by Additive Type 2024 & 2032
- Figure 59: Europe Anti-slip Additives Market Revenue (Million), by Additive Nature 2024 & 2032
- Figure 60: Europe Anti-slip Additives Market Volume (K Tons), by Additive Nature 2024 & 2032
- Figure 61: Europe Anti-slip Additives Market Revenue Share (%), by Additive Nature 2024 & 2032
- Figure 62: Europe Anti-slip Additives Market Volume Share (%), by Additive Nature 2024 & 2032
- Figure 63: Europe Anti-slip Additives Market Revenue (Million), by Application 2024 & 2032
- Figure 64: Europe Anti-slip Additives Market Volume (K Tons), by Application 2024 & 2032
- Figure 65: Europe Anti-slip Additives Market Revenue Share (%), by Application 2024 & 2032
- Figure 66: Europe Anti-slip Additives Market Volume Share (%), by Application 2024 & 2032
- Figure 67: Europe Anti-slip Additives Market Revenue (Million), by Country 2024 & 2032
- Figure 68: Europe Anti-slip Additives Market Volume (K Tons), by Country 2024 & 2032
- Figure 69: Europe Anti-slip Additives Market Revenue Share (%), by Country 2024 & 2032
- Figure 70: Europe Anti-slip Additives Market Volume Share (%), by Country 2024 & 2032
- Figure 71: South America Anti-slip Additives Market Revenue (Million), by Additive Type 2024 & 2032
- Figure 72: South America Anti-slip Additives Market Volume (K Tons), by Additive Type 2024 & 2032
- Figure 73: South America Anti-slip Additives Market Revenue Share (%), by Additive Type 2024 & 2032
- Figure 74: South America Anti-slip Additives Market Volume Share (%), by Additive Type 2024 & 2032
- Figure 75: South America Anti-slip Additives Market Revenue (Million), by Additive Nature 2024 & 2032
- Figure 76: South America Anti-slip Additives Market Volume (K Tons), by Additive Nature 2024 & 2032
- Figure 77: South America Anti-slip Additives Market Revenue Share (%), by Additive Nature 2024 & 2032
- Figure 78: South America Anti-slip Additives Market Volume Share (%), by Additive Nature 2024 & 2032
- Figure 79: South America Anti-slip Additives Market Revenue (Million), by Application 2024 & 2032
- Figure 80: South America Anti-slip Additives Market Volume (K Tons), by Application 2024 & 2032
- Figure 81: South America Anti-slip Additives Market Revenue Share (%), by Application 2024 & 2032
- Figure 82: South America Anti-slip Additives Market Volume Share (%), by Application 2024 & 2032
- Figure 83: South America Anti-slip Additives Market Revenue (Million), by Country 2024 & 2032
- Figure 84: South America Anti-slip Additives Market Volume (K Tons), by Country 2024 & 2032
- Figure 85: South America Anti-slip Additives Market Revenue Share (%), by Country 2024 & 2032
- Figure 86: South America Anti-slip Additives Market Volume Share (%), by Country 2024 & 2032
- Figure 87: Middle East and Africa Anti-slip Additives Market Revenue (Million), by Additive Type 2024 & 2032
- Figure 88: Middle East and Africa Anti-slip Additives Market Volume (K Tons), by Additive Type 2024 & 2032
- Figure 89: Middle East and Africa Anti-slip Additives Market Revenue Share (%), by Additive Type 2024 & 2032
- Figure 90: Middle East and Africa Anti-slip Additives Market Volume Share (%), by Additive Type 2024 & 2032
- Figure 91: Middle East and Africa Anti-slip Additives Market Revenue (Million), by Additive Nature 2024 & 2032
- Figure 92: Middle East and Africa Anti-slip Additives Market Volume (K Tons), by Additive Nature 2024 & 2032
- Figure 93: Middle East and Africa Anti-slip Additives Market Revenue Share (%), by Additive Nature 2024 & 2032
- Figure 94: Middle East and Africa Anti-slip Additives Market Volume Share (%), by Additive Nature 2024 & 2032
- Figure 95: Middle East and Africa Anti-slip Additives Market Revenue (Million), by Application 2024 & 2032
- Figure 96: Middle East and Africa Anti-slip Additives Market Volume (K Tons), by Application 2024 & 2032
- Figure 97: Middle East and Africa Anti-slip Additives Market Revenue Share (%), by Application 2024 & 2032
- Figure 98: Middle East and Africa Anti-slip Additives Market Volume Share (%), by Application 2024 & 2032
- Figure 99: Middle East and Africa Anti-slip Additives Market Revenue (Million), by Country 2024 & 2032
- Figure 100: Middle East and Africa Anti-slip Additives Market Volume (K Tons), by Country 2024 & 2032
- Figure 101: Middle East and Africa Anti-slip Additives Market Revenue Share (%), by Country 2024 & 2032
- Figure 102: Middle East and Africa Anti-slip Additives Market Volume Share (%), by Country 2024 & 2032
List of Tables
- Table 1: Global Anti-slip Additives Market Revenue Million Forecast, by Region 2019 & 2032
- Table 2: Global Anti-slip Additives Market Volume K Tons Forecast, by Region 2019 & 2032
- Table 3: Global Anti-slip Additives Market Revenue Million Forecast, by Additive Type 2019 & 2032
- Table 4: Global Anti-slip Additives Market Volume K Tons Forecast, by Additive Type 2019 & 2032
- Table 5: Global Anti-slip Additives Market Revenue Million Forecast, by Additive Nature 2019 & 2032
- Table 6: Global Anti-slip Additives Market Volume K Tons Forecast, by Additive Nature 2019 & 2032
- Table 7: Global Anti-slip Additives Market Revenue Million Forecast, by Application 2019 & 2032
- Table 8: Global Anti-slip Additives Market Volume K Tons Forecast, by Application 2019 & 2032
- Table 9: Global Anti-slip Additives Market Revenue Million Forecast, by Region 2019 & 2032
- Table 10: Global Anti-slip Additives Market Volume K Tons Forecast, by Region 2019 & 2032
- Table 11: Global Anti-slip Additives Market Revenue Million Forecast, by Country 2019 & 2032
- Table 12: Global Anti-slip Additives Market Volume K Tons Forecast, by Country 2019 & 2032
- Table 13: China Anti-slip Additives Market Revenue (Million) Forecast, by Application 2019 & 2032
- Table 14: China Anti-slip Additives Market Volume (K Tons) Forecast, by Application 2019 & 2032
- Table 15: India Anti-slip Additives Market Revenue (Million) Forecast, by Application 2019 & 2032
- Table 16: India Anti-slip Additives Market Volume (K Tons) Forecast, by Application 2019 & 2032
- Table 17: Japan Anti-slip Additives Market Revenue (Million) Forecast, by Application 2019 & 2032
- Table 18: Japan Anti-slip Additives Market Volume (K Tons) Forecast, by Application 2019 & 2032
- Table 19: South Korea Anti-slip Additives Market Revenue (Million) Forecast, by Application 2019 & 2032
- Table 20: South Korea Anti-slip Additives Market Volume (K Tons) Forecast, by Application 2019 & 2032
- Table 21: Rest of Asia Pacific Anti-slip Additives Market Revenue (Million) Forecast, by Application 2019 & 2032
- Table 22: Rest of Asia Pacific Anti-slip Additives Market Volume (K Tons) Forecast, by Application 2019 & 2032
- Table 23: Global Anti-slip Additives Market Revenue Million Forecast, by Country 2019 & 2032
- Table 24: Global Anti-slip Additives Market Volume K Tons Forecast, by Country 2019 & 2032
- Table 25: United States Anti-slip Additives Market Revenue (Million) Forecast, by Application 2019 & 2032
- Table 26: United States Anti-slip Additives Market Volume (K Tons) Forecast, by Application 2019 & 2032
- Table 27: Canada Anti-slip Additives Market Revenue (Million) Forecast, by Application 2019 & 2032
- Table 28: Canada Anti-slip Additives Market Volume (K Tons) Forecast, by Application 2019 & 2032
- Table 29: Mexico Anti-slip Additives Market Revenue (Million) Forecast, by Application 2019 & 2032
- Table 30: Mexico Anti-slip Additives Market Volume (K Tons) Forecast, by Application 2019 & 2032
- Table 31: Global Anti-slip Additives Market Revenue Million Forecast, by Country 2019 & 2032
- Table 32: Global Anti-slip Additives Market Volume K Tons Forecast, by Country 2019 & 2032
- Table 33: Germany Anti-slip Additives Market Revenue (Million) Forecast, by Application 2019 & 2032
- Table 34: Germany Anti-slip Additives Market Volume (K Tons) Forecast, by Application 2019 & 2032
- Table 35: United Kingdom Anti-slip Additives Market Revenue (Million) Forecast, by Application 2019 & 2032
- Table 36: United Kingdom Anti-slip Additives Market Volume (K Tons) Forecast, by Application 2019 & 2032
- Table 37: France Anti-slip Additives Market Revenue (Million) Forecast, by Application 2019 & 2032
- Table 38: France Anti-slip Additives Market Volume (K Tons) Forecast, by Application 2019 & 2032
- Table 39: Italy Anti-slip Additives Market Revenue (Million) Forecast, by Application 2019 & 2032
- Table 40: Italy Anti-slip Additives Market Volume (K Tons) Forecast, by Application 2019 & 2032
- Table 41: Rest of Europe Anti-slip Additives Market Revenue (Million) Forecast, by Application 2019 & 2032
- Table 42: Rest of Europe Anti-slip Additives Market Volume (K Tons) Forecast, by Application 2019 & 2032
- Table 43: Global Anti-slip Additives Market Revenue Million Forecast, by Country 2019 & 2032
- Table 44: Global Anti-slip Additives Market Volume K Tons Forecast, by Country 2019 & 2032
- Table 45: Brazil Anti-slip Additives Market Revenue (Million) Forecast, by Application 2019 & 2032
- Table 46: Brazil Anti-slip Additives Market Volume (K Tons) Forecast, by Application 2019 & 2032
- Table 47: Argentina Anti-slip Additives Market Revenue (Million) Forecast, by Application 2019 & 2032
- Table 48: Argentina Anti-slip Additives Market Volume (K Tons) Forecast, by Application 2019 & 2032
- Table 49: Rest of South America Anti-slip Additives Market Revenue (Million) Forecast, by Application 2019 & 2032
- Table 50: Rest of South America Anti-slip Additives Market Volume (K Tons) Forecast, by Application 2019 & 2032
- Table 51: Global Anti-slip Additives Market Revenue Million Forecast, by Country 2019 & 2032
- Table 52: Global Anti-slip Additives Market Volume K Tons Forecast, by Country 2019 & 2032
- Table 53: Saudi Arabia Anti-slip Additives Market Revenue (Million) Forecast, by Application 2019 & 2032
- Table 54: Saudi Arabia Anti-slip Additives Market Volume (K Tons) Forecast, by Application 2019 & 2032
- Table 55: South Africa Anti-slip Additives Market Revenue (Million) Forecast, by Application 2019 & 2032
- Table 56: South Africa Anti-slip Additives Market Volume (K Tons) Forecast, by Application 2019 & 2032
- Table 57: Rest of Middle East and Africa Anti-slip Additives Market Revenue (Million) Forecast, by Application 2019 & 2032
- Table 58: Rest of Middle East and Africa Anti-slip Additives Market Volume (K Tons) Forecast, by Application 2019 & 2032
- Table 59: Global Anti-slip Additives Market Revenue Million Forecast, by Additive Type 2019 & 2032
- Table 60: Global Anti-slip Additives Market Volume K Tons Forecast, by Additive Type 2019 & 2032
- Table 61: Global Anti-slip Additives Market Revenue Million Forecast, by Additive Nature 2019 & 2032
- Table 62: Global Anti-slip Additives Market Volume K Tons Forecast, by Additive Nature 2019 & 2032
- Table 63: Global Anti-slip Additives Market Revenue Million Forecast, by Application 2019 & 2032
- Table 64: Global Anti-slip Additives Market Volume K Tons Forecast, by Application 2019 & 2032
- Table 65: Global Anti-slip Additives Market Revenue Million Forecast, by Country 2019 & 2032
- Table 66: Global Anti-slip Additives Market Volume K Tons Forecast, by Country 2019 & 2032
- Table 67: China Anti-slip Additives Market Revenue (Million) Forecast, by Application 2019 & 2032
- Table 68: China Anti-slip Additives Market Volume (K Tons) Forecast, by Application 2019 & 2032
- Table 69: India Anti-slip Additives Market Revenue (Million) Forecast, by Application 2019 & 2032
- Table 70: India Anti-slip Additives Market Volume (K Tons) Forecast, by Application 2019 & 2032
- Table 71: Japan Anti-slip Additives Market Revenue (Million) Forecast, by Application 2019 & 2032
- Table 72: Japan Anti-slip Additives Market Volume (K Tons) Forecast, by Application 2019 & 2032
- Table 73: South Korea Anti-slip Additives Market Revenue (Million) Forecast, by Application 2019 & 2032
- Table 74: South Korea Anti-slip Additives Market Volume (K Tons) Forecast, by Application 2019 & 2032
- Table 75: Rest of Asia Pacific Anti-slip Additives Market Revenue (Million) Forecast, by Application 2019 & 2032
- Table 76: Rest of Asia Pacific Anti-slip Additives Market Volume (K Tons) Forecast, by Application 2019 & 2032
- Table 77: Global Anti-slip Additives Market Revenue Million Forecast, by Additive Type 2019 & 2032
- Table 78: Global Anti-slip Additives Market Volume K Tons Forecast, by Additive Type 2019 & 2032
- Table 79: Global Anti-slip Additives Market Revenue Million Forecast, by Additive Nature 2019 & 2032
- Table 80: Global Anti-slip Additives Market Volume K Tons Forecast, by Additive Nature 2019 & 2032
- Table 81: Global Anti-slip Additives Market Revenue Million Forecast, by Application 2019 & 2032
- Table 82: Global Anti-slip Additives Market Volume K Tons Forecast, by Application 2019 & 2032
- Table 83: Global Anti-slip Additives Market Revenue Million Forecast, by Country 2019 & 2032
- Table 84: Global Anti-slip Additives Market Volume K Tons Forecast, by Country 2019 & 2032
- Table 85: United States Anti-slip Additives Market Revenue (Million) Forecast, by Application 2019 & 2032
- Table 86: United States Anti-slip Additives Market Volume (K Tons) Forecast, by Application 2019 & 2032
- Table 87: Canada Anti-slip Additives Market Revenue (Million) Forecast, by Application 2019 & 2032
- Table 88: Canada Anti-slip Additives Market Volume (K Tons) Forecast, by Application 2019 & 2032
- Table 89: Mexico Anti-slip Additives Market Revenue (Million) Forecast, by Application 2019 & 2032
- Table 90: Mexico Anti-slip Additives Market Volume (K Tons) Forecast, by Application 2019 & 2032
- Table 91: Global Anti-slip Additives Market Revenue Million Forecast, by Additive Type 2019 & 2032
- Table 92: Global Anti-slip Additives Market Volume K Tons Forecast, by Additive Type 2019 & 2032
- Table 93: Global Anti-slip Additives Market Revenue Million Forecast, by Additive Nature 2019 & 2032
- Table 94: Global Anti-slip Additives Market Volume K Tons Forecast, by Additive Nature 2019 & 2032
- Table 95: Global Anti-slip Additives Market Revenue Million Forecast, by Application 2019 & 2032
- Table 96: Global Anti-slip Additives Market Volume K Tons Forecast, by Application 2019 & 2032
- Table 97: Global Anti-slip Additives Market Revenue Million Forecast, by Country 2019 & 2032
- Table 98: Global Anti-slip Additives Market Volume K Tons Forecast, by Country 2019 & 2032
- Table 99: Germany Anti-slip Additives Market Revenue (Million) Forecast, by Application 2019 & 2032
- Table 100: Germany Anti-slip Additives Market Volume (K Tons) Forecast, by Application 2019 & 2032
- Table 101: United Kingdom Anti-slip Additives Market Revenue (Million) Forecast, by Application 2019 & 2032
- Table 102: United Kingdom Anti-slip Additives Market Volume (K Tons) Forecast, by Application 2019 & 2032
- Table 103: France Anti-slip Additives Market Revenue (Million) Forecast, by Application 2019 & 2032
- Table 104: France Anti-slip Additives Market Volume (K Tons) Forecast, by Application 2019 & 2032
- Table 105: Italy Anti-slip Additives Market Revenue (Million) Forecast, by Application 2019 & 2032
- Table 106: Italy Anti-slip Additives Market Volume (K Tons) Forecast, by Application 2019 & 2032
- Table 107: Rest of Europe Anti-slip Additives Market Revenue (Million) Forecast, by Application 2019 & 2032
- Table 108: Rest of Europe Anti-slip Additives Market Volume (K Tons) Forecast, by Application 2019 & 2032
- Table 109: Global Anti-slip Additives Market Revenue Million Forecast, by Additive Type 2019 & 2032
- Table 110: Global Anti-slip Additives Market Volume K Tons Forecast, by Additive Type 2019 & 2032
- Table 111: Global Anti-slip Additives Market Revenue Million Forecast, by Additive Nature 2019 & 2032
- Table 112: Global Anti-slip Additives Market Volume K Tons Forecast, by Additive Nature 2019 & 2032
- Table 113: Global Anti-slip Additives Market Revenue Million Forecast, by Application 2019 & 2032
- Table 114: Global Anti-slip Additives Market Volume K Tons Forecast, by Application 2019 & 2032
- Table 115: Global Anti-slip Additives Market Revenue Million Forecast, by Country 2019 & 2032
- Table 116: Global Anti-slip Additives Market Volume K Tons Forecast, by Country 2019 & 2032
- Table 117: Brazil Anti-slip Additives Market Revenue (Million) Forecast, by Application 2019 & 2032
- Table 118: Brazil Anti-slip Additives Market Volume (K Tons) Forecast, by Application 2019 & 2032
- Table 119: Argentina Anti-slip Additives Market Revenue (Million) Forecast, by Application 2019 & 2032
- Table 120: Argentina Anti-slip Additives Market Volume (K Tons) Forecast, by Application 2019 & 2032
- Table 121: Rest of South America Anti-slip Additives Market Revenue (Million) Forecast, by Application 2019 & 2032
- Table 122: Rest of South America Anti-slip Additives Market Volume (K Tons) Forecast, by Application 2019 & 2032
- Table 123: Global Anti-slip Additives Market Revenue Million Forecast, by Additive Type 2019 & 2032
- Table 124: Global Anti-slip Additives Market Volume K Tons Forecast, by Additive Type 2019 & 2032
- Table 125: Global Anti-slip Additives Market Revenue Million Forecast, by Additive Nature 2019 & 2032
- Table 126: Global Anti-slip Additives Market Volume K Tons Forecast, by Additive Nature 2019 & 2032
- Table 127: Global Anti-slip Additives Market Revenue Million Forecast, by Application 2019 & 2032
- Table 128: Global Anti-slip Additives Market Volume K Tons Forecast, by Application 2019 & 2032
- Table 129: Global Anti-slip Additives Market Revenue Million Forecast, by Country 2019 & 2032
- Table 130: Global Anti-slip Additives Market Volume K Tons Forecast, by Country 2019 & 2032
- Table 131: Saudi Arabia Anti-slip Additives Market Revenue (Million) Forecast, by Application 2019 & 2032
- Table 132: Saudi Arabia Anti-slip Additives Market Volume (K Tons) Forecast, by Application 2019 & 2032
- Table 133: South Africa Anti-slip Additives Market Revenue (Million) Forecast, by Application 2019 & 2032
- Table 134: South Africa Anti-slip Additives Market Volume (K Tons) Forecast, by Application 2019 & 2032
- Table 135: Rest of Middle East and Africa Anti-slip Additives Market Revenue (Million) Forecast, by Application 2019 & 2032
- Table 136: Rest of Middle East and Africa Anti-slip Additives Market Volume (K Tons) Forecast, by Application 2019 & 2032
Frequently Asked Questions
1. What is the projected Compound Annual Growth Rate (CAGR) of the Anti-slip Additives Market?
The projected CAGR is approximately 4.00%.
2. Which companies are prominent players in the Anti-slip Additives Market?
Key companies in the market include Jotun, PPG Industries Inc, Vexcon Chemicals*List Not Exhaustive, Rust-Oleum, BYK (ALTANA), Akzo Nobel BV, Axalta Coating Systems, Hempel A/S, Pro Chem Inc, Associated Chemical, SAICOS COLOR GmbH.
3. What are the main segments of the Anti-slip Additives Market?
The market segments include Additive Type, Additive Nature, Application.
4. Can you provide details about the market size?
The market size is estimated to be USD 389.52 Million as of 2022.
5. What are some drivers contributing to market growth?
; Increasing Application in Industrial Flooring; Increasing Demand from the Marine Industry.
6. What are the notable trends driving market growth?
Growing Applications in Industrial Flooring.
7. Are there any restraints impacting market growth?
; Stringent Environmental Regulations; Other Restraints.
8. Can you provide examples of recent developments in the market?
Recent developments in the Anti-slip Additives Market include: Jotun launched a new line of anti-slip coatings with enhanced durability and UV resistance. PPG Industries acquired a leading manufacturer of anti-slip additives to expand its product portfolio. Vexcon Chemicals developed a new additive formula that provides superior slip resistance in wet conditions.
9. What pricing options are available for accessing the report?
Pricing options include single-user, multi-user, and enterprise licenses priced at USD 4750, USD 5250, and USD 8750 respectively.
10. Is the market size provided in terms of value or volume?
The market size is provided in terms of value, measured in Million and volume, measured in K Tons.
11. Are there any specific market keywords associated with the report?
Yes, the market keyword associated with the report is "Anti-slip Additives Market," which aids in identifying and referencing the specific market segment covered.
12. How do I determine which pricing option suits my needs best?
The pricing options vary based on user requirements and access needs. Individual users may opt for single-user licenses, while businesses requiring broader access may choose multi-user or enterprise licenses for cost-effective access to the report.
13. Are there any additional resources or data provided in the Anti-slip Additives Market report?
While the report offers comprehensive insights, it's advisable to review the specific contents or supplementary materials provided to ascertain if additional resources or data are available.
14. How can I stay updated on further developments or reports in the Anti-slip Additives Market?
To stay informed about further developments, trends, and reports in the Anti-slip Additives Market, consider subscribing to industry newsletters, following relevant companies and organizations, or regularly checking reputable industry news sources and publications.
Methodology
Step 1 - Identification of Relevant Samples Size from Population Database


Step 2 - Approaches for Defining Global Market Size (Value, Volume* & Price*)

Note*: In applicable scenarios
Step 3 - Data Sources
Primary Research
- Web Analytics
- Survey Reports
- Research Institute
- Latest Research Reports
- Opinion Leaders
Secondary Research
- Annual Reports
- White Paper
- Latest Press Release
- Industry Association
- Paid Database
- Investor Presentations

Step 4 - Data Triangulation
Involves using different sources of information in order to increase the validity of a study
These sources are likely to be stakeholders in a program - participants, other researchers, program staff, other community members, and so on.
Then we put all data in single framework & apply various statistical tools to find out the dynamic on the market.
During the analysis stage, feedback from the stakeholder groups would be compared to determine areas of agreement as well as areas of divergence


