

Key Insights
The Android PDA scanner market is projected for significant expansion, expected to reach $3.42 billion by 2033, driven by a Compound Annual Growth Rate (CAGR) of 9.11% from the base year 2025. This growth is propelled by the increasing need for efficient data capture and management across diverse industries. Key drivers include the rise of warehouse automation and e-commerce, which demand agile handheld devices for inventory, order fulfillment, and logistics. The healthcare sector also contributes, utilizing these scanners for patient identification and medication management to improve efficiency and safety. The user-friendly interface, flexibility, and cost-effectiveness of Android devices further accelerate their market adoption.
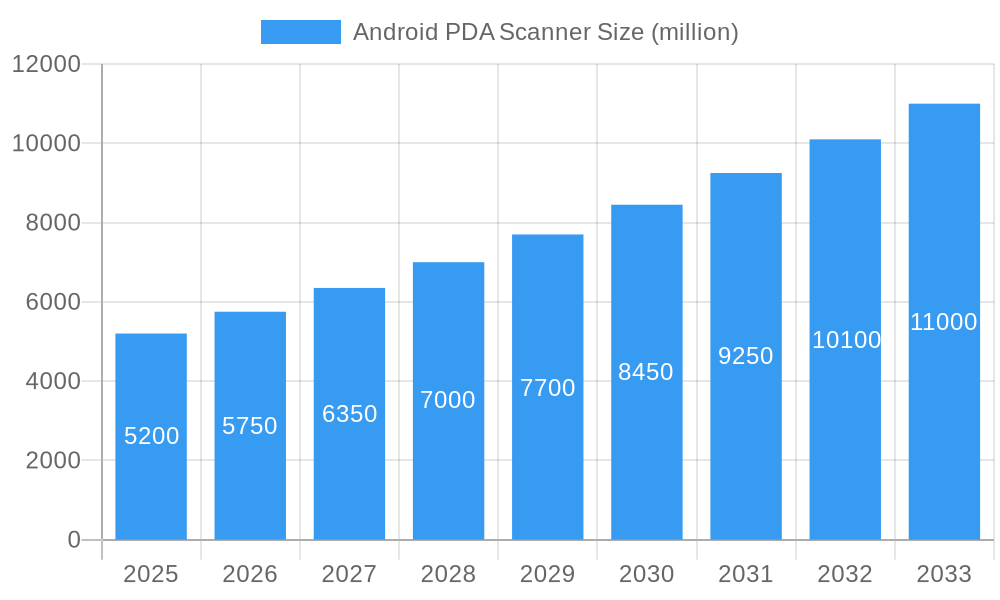
Android PDA Scanner Market Size (In Billion)
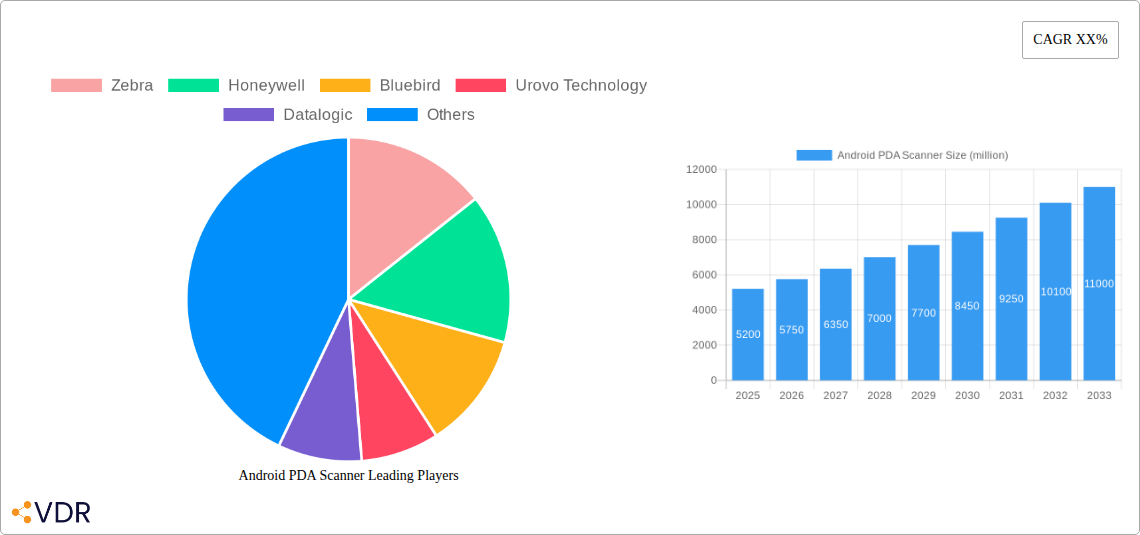
The competitive landscape features prominent players like Zebra, Honeywell, and Bluebird, focusing on innovation and specialized solutions. Wireless technology is a significant growth area due to its mobility. Geographically, the Asia Pacific region, particularly China and India, is anticipated to lead growth, fueled by industrialization and digital transformation. North America and Europe represent mature markets with demand for advanced devices. Deployment costs and data security remain key considerations, but technological advancements are mitigating these challenges.
Android PDA Scanner Company Market Share
This comprehensive report offers an in-depth analysis of the global Android PDA Scanner market, examining market dynamics, growth forecasts, regional trends, product innovation, and the competitive environment. It provides critical insights for stakeholders, forecasting market evolution from 2025 through 2033, building upon data from 2019-2024.
Android PDA Scanner Market Dynamics & Structure
The global Android PDA scanner market exhibits a moderately consolidated structure, with key players like Zebra, Honeywell, and Bluebird Technology holding significant market shares. Technological innovation is a primary driver, with continuous advancements in processing power, battery life, scanning accuracy, and ruggedization fueling adoption across various industries. Regulatory frameworks, particularly those pertaining to data security and industrial safety, influence product design and market entry. Competitive product substitutes, such as traditional barcode scanners and mobile computers with limited functionality, are gradually being displaced by the versatility of Android PDAs. End-user demographics are expanding beyond traditional logistics and warehousing to encompass healthcare professionals, field service technicians, and retail associates, all seeking enhanced data capture and real-time information access. Mergers and acquisitions (M&A) trends are actively shaping the landscape, as larger players seek to expand their portfolios and geographic reach. The market concentration ratio is estimated to be around 60% among the top five vendors in 2025. Barriers to innovation include the high cost of R&D for advanced features and the need for robust, enterprise-grade software integration.
- Market Concentration: Moderately consolidated, with top players accounting for approximately 60% of the market share in 2025.
- Technological Innovation Drivers: Enhanced scanning capabilities, longer battery life, improved ruggedization, and seamless software integration.
- Regulatory Frameworks: Data privacy (e.g., GDPR, CCPA) and industrial safety certifications (e.g., ATEX, IECEx) are crucial for market access.
- Competitive Product Substitutes: Traditional barcode scanners, feature phones, and basic smartphones with limited ruggedness and specialized scanning capabilities.
- End-User Demographics: Growing adoption in healthcare, field service, retail, and public safety sectors.
- M&A Trends: Strategic acquisitions to broaden product offerings and expand market presence, with an estimated 5-7 significant M&A deals anticipated during the forecast period.
Android PDA Scanner Growth Trends & Insights
The Android PDA scanner market is poised for robust growth, driven by an increasing demand for enterprise mobility solutions and the digital transformation initiatives across industries. The market size is projected to expand from approximately $3,500 million units in 2025 to an estimated $7,200 million units by 2033, reflecting a Compound Annual Growth Rate (CAGR) of roughly 9.5%. Adoption rates are accelerating as businesses recognize the significant return on investment through improved operational efficiency, reduced error rates, and enhanced data accuracy. Technological disruptions, such as the integration of AI-powered scanning, advanced RFID capabilities, and 5G connectivity, are further fueling market penetration. Consumer behavior shifts are also playing a crucial role; end-users are increasingly expecting intuitive, smartphone-like interfaces and the flexibility of Android operating systems on their ruggedized data capture devices. The market penetration for Android PDAs in core logistics and warehousing applications is expected to exceed 75% by 2030. The increasing preference for wireless connectivity over wired solutions, coupled with the demand for longer battery life and faster data transfer, is reshaping product development and consumer choices. Furthermore, the growing emphasis on real-time inventory management, track-and-trace functionalities, and predictive maintenance solutions are creating new avenues for market expansion. The proliferation of e-commerce and the resulting surge in order fulfillment activities are directly correlating with the increased demand for efficient scanning devices.
Dominant Regions, Countries, or Segments in Android PDA Scanner
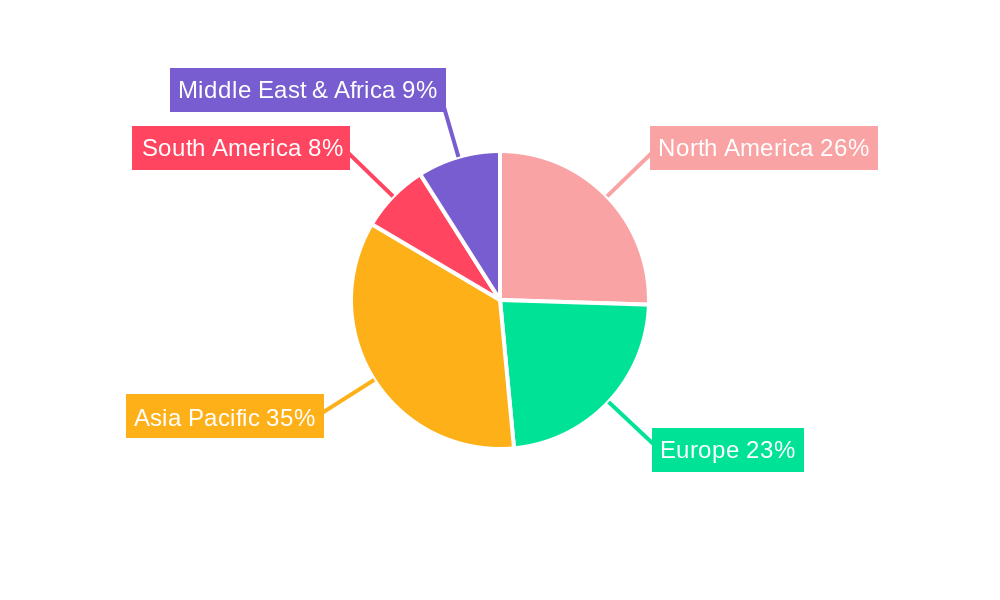
The Logistics & Warehousing segment is unequivocally the dominant force driving the global Android PDA scanner market, consistently accounting for over 40% of the total market share. This segment's dominance is attributed to the critical need for efficient inventory management, order picking, shipping, and receiving processes. The relentless growth of e-commerce, global supply chain complexities, and the imperative for real-time visibility propel the adoption of rugged Android PDA scanners. Countries within North America and Europe lead in market penetration and revenue contribution due to their advanced infrastructure, established logistics networks, and early adoption of enterprise mobility solutions.
The Wireless type of Android PDA scanners is significantly outpacing its wired counterpart, projected to capture over 85% of the market by 2025. This preference is driven by the inherent need for mobility and flexibility on the shop floor, in vast warehouses, and in field operations. The integration of Wi-Fi, Bluetooth, and cellular connectivity ensures seamless data transmission and real-time updates, crucial for operational efficiency.
- Dominant Application Segment: Logistics & Warehousing, accounting for approximately 40-45% of the global market in 2025.
- Key Drivers: E-commerce growth, global supply chain optimization, demand for real-time inventory tracking, automation in warehouses.
- Market Share: Expected to maintain its leading position throughout the forecast period.
- Growth Potential: Continued high growth due to increasing complexity and volume in global trade.
- Dominant Type: Wireless, projected to hold over 85% market share in 2025.
- Key Drivers: Unrestricted mobility, ease of deployment, integration with various wireless networks (Wi-Fi, Bluetooth, cellular).
- Growth Potential: Continued dominance driven by advancements in wireless technology and user preference for flexibility.
- Leading Regions: North America and Europe.
- Key Drivers: High adoption rates of enterprise mobility, robust logistics infrastructure, strong regulatory support for data security and efficiency.
- Market Share: Expected to collectively contribute over 50% of the global market revenue.
- Growth Potential: Steady growth driven by ongoing digital transformation initiatives and the expansion of advanced logistics solutions.
Android PDA Scanner Product Landscape
The Android PDA scanner product landscape is characterized by rapid innovation, focusing on enhanced durability, superior scanning performance, and seamless integration with enterprise systems. Manufacturers are pushing the boundaries with devices featuring advanced 2D imagers capable of capturing barcodes even under challenging conditions, such as damaged labels or low light. Ruggedization is a key differentiator, with IP65 and IP67 ratings becoming standard for dust and water resistance, alongside MIL-STD-810G compliance for drop and shock resistance. Battery technology is also a significant focus, with extended battery life and hot-swappable options becoming crucial for uninterrupted operations. Furthermore, the integration of advanced connectivity options like 5G, Wi-Fi 6, and NFC is becoming increasingly common, facilitating faster data transfer and real-time communication. Applications range from sophisticated warehouse management and asset tracking to mobile point-of-sale (POS) solutions in retail and patient data management in healthcare.
Key Drivers, Barriers & Challenges in Android PDA Scanner
Key Drivers:
- Digital Transformation: The pervasive drive for digitalization across industries, necessitating efficient data capture and real-time information access.
- E-commerce Boom: The exponential growth of online retail fuels demand for faster order fulfillment, inventory management, and last-mile delivery solutions.
- Enterprise Mobility: The increasing adoption of mobile workforces in logistics, field service, and healthcare demands robust, connected devices.
- Technological Advancements: Continuous improvements in scanning technology, battery life, processing power, and connectivity enhance device utility.
Barriers & Challenges:
- High Initial Cost: The upfront investment for rugged, feature-rich Android PDA scanners can be substantial for smaller businesses.
- Integration Complexity: Seamless integration with existing legacy enterprise systems can pose significant technical challenges.
- Supply Chain Disruptions: Global supply chain volatility can impact component availability and device manufacturing, leading to delays and price fluctuations.
- Competition from Lower-Cost Alternatives: While not directly comparable, the availability of lower-cost consumer-grade devices can sometimes present a perceived barrier to entry for specialized enterprise solutions.
- Cybersecurity Concerns: Ensuring robust data security and protection against cyber threats on mobile devices is a constant challenge.
Emerging Opportunities in Android PDA Scanner
Emerging opportunities in the Android PDA scanner market are abundant, driven by evolving industry needs and technological advancements. The integration of Artificial Intelligence (AI) for predictive analytics and intelligent scanning is a significant trend, allowing devices to not only capture data but also interpret and act upon it. The expansion of the Internet of Things (IoT) ecosystem presents opportunities for PDAs to serve as central hubs for managing and interacting with a multitude of connected devices in industrial settings and smart warehouses. Furthermore, the burgeoning field service management sector, coupled with the increasing adoption of telehealth and remote patient monitoring in healthcare, creates substantial demand for robust, mobile data capture solutions. Untapped markets in emerging economies, where digitalization is rapidly gaining momentum, also represent significant growth potential. The development of specialized PDAs tailored for niche applications, such as cold chain logistics or hazardous environments, further diversifies the market.
Growth Accelerators in the Android PDA Scanner Industry
Several key catalysts are accelerating the growth of the Android PDA scanner industry. Technological breakthroughs, particularly in battery efficiency and scanning optics, are enabling longer operating times and faster, more accurate data capture, thereby enhancing productivity. Strategic partnerships between hardware manufacturers and software solution providers are crucial for developing integrated ecosystems that offer end-to-end solutions for specific industry challenges. Market expansion strategies, including targeting new geographic regions and vertical markets with tailored offerings, are also significant growth accelerators. The increasing focus on supply chain visibility and resilience in the post-pandemic era is further driving the adoption of advanced data capture devices. The continued evolution of Android's open-source platform also allows for greater customization and rapid application development, making these devices more adaptable to diverse business needs.
Key Players Shaping the Android PDA Scanner Market
- Zebra
- Honeywell
- Bluebird
- Urovo Technology
- Datalogic
- Newland
- CASIO
- Denso Wave
- Panasonic
- Seuic
- Shenzhen Chainway
- iData
- Handheld Group
- Supoin
- Keyence
- Cipherlab
Notable Milestones in Android PDA Scanner Sector
- 2019: Increased adoption of Android OS in rugged devices, shifting from proprietary OS.
- 2020: Introduction of devices with enhanced disinfection-friendly features and antimicrobial coatings due to global health concerns.
- 2021: Significant advancements in 5G connectivity integration, enabling real-time data transfer for critical operations.
- 2022: Growing focus on AI-powered scanning capabilities and predictive analytics integration.
- 2023: Enhanced ruggedization standards and extended battery life becoming key differentiators.
- 2024: Increased adoption in healthcare for patient identification and medication management.
In-Depth Android PDA Scanner Market Outlook
The future outlook for the Android PDA scanner market is exceptionally strong, fueled by ongoing digital transformation and the relentless pursuit of operational efficiency across global industries. Growth accelerators such as continued technological innovation in AI-driven scanning, advanced connectivity like 5G, and sustainable battery solutions will empower businesses with unprecedented levels of data capture and analysis. Strategic collaborations between hardware manufacturers and software developers will continue to foster the creation of bespoke solutions for complex enterprise needs. The expanding role of these devices in sectors beyond traditional logistics, including healthcare, retail, and field service, alongside their increasing penetration into emerging economies, signifies a vast untapped market potential. The market is set to witness a sustained upward trajectory, driven by the fundamental need for reliable, mobile, and intelligent data capture technologies.
Android PDA Scanner Segmentation
-
1. Application
- 1.1. Logistics & Warehousing
- 1.2. Industrial Data Storage
- 1.3. Healthcare
- 1.4. Others
-
2. Types
- 2.1. Wired
- 2.2. Wireless
Android PDA Scanner Segmentation By Geography
-
1. North America
- 1.1. United States
- 1.2. Canada
- 1.3. Mexico
-
2. South America
- 2.1. Brazil
- 2.2. Argentina
- 2.3. Rest of South America
-
3. Europe
- 3.1. United Kingdom
- 3.2. Germany
- 3.3. France
- 3.4. Italy
- 3.5. Spain
- 3.6. Russia
- 3.7. Benelux
- 3.8. Nordics
- 3.9. Rest of Europe
-
4. Middle East & Africa
- 4.1. Turkey
- 4.2. Israel
- 4.3. GCC
- 4.4. North Africa
- 4.5. South Africa
- 4.6. Rest of Middle East & Africa
-
5. Asia Pacific
- 5.1. China
- 5.2. India
- 5.3. Japan
- 5.4. South Korea
- 5.5. ASEAN
- 5.6. Oceania
- 5.7. Rest of Asia Pacific
Android PDA Scanner Regional Market Share
Geographic Coverage of Android PDA Scanner
Android PDA Scanner REPORT HIGHLIGHTS
| Aspects | Details |
|---|---|
| Study Period | 2020-2034 |
| Base Year | 2025 |
| Estimated Year | 2026 |
| Forecast Period | 2026-2034 |
| Historical Period | 2020-2025 |
| Growth Rate | CAGR of 9.11% from 2020-2034 |
| Segmentation |
|
Table of Contents
- 1. Introduction
- 1.1. Research Scope
- 1.2. Market Segmentation
- 1.3. Research Objective
- 1.4. Definitions and Assumptions
- 2. Executive Summary
- 2.1. Market Snapshot
- 3. Market Dynamics
- 3.1. Market Drivers
- 3.2. Market Restrains
- 3.3. Market Trends
- 3.4. Market Opportunities
- 4. Market Factor Analysis
- 4.1. Porters Five Forces
- 4.1.1. Bargaining Power of Suppliers
- 4.1.2. Bargaining Power of Buyers
- 4.1.3. Threat of New Entrants
- 4.1.4. Threat of Substitutes
- 4.1.5. Competitive Rivalry
- 4.2. PESTEL analysis
- 4.3. BCG Analysis
- 4.3.1. Stars (High Growth, High Market Share)
- 4.3.2. Cash Cows (Low Growth, High Market Share)
- 4.3.3. Question Mark (High Growth, Low Market Share)
- 4.3.4. Dogs (Low Growth, Low Market Share)
- 4.4. Ansoff Matrix Analysis
- 4.5. Supply Chain Analysis
- 4.6. Regulatory Landscape
- 4.7. Current Market Potential and Opportunity Assessment (TAM–SAM–SOM Framework)
- 4.8. VDR Analyst Note
- 4.1. Porters Five Forces
- 5. Market Analysis, Insights and Forecast 2021-2033
- 5.1. Market Analysis, Insights and Forecast - by Application
- 5.1.1. Logistics & Warehousing
- 5.1.2. Industrial Data Storage
- 5.1.3. Healthcare
- 5.1.4. Others
- 5.2. Market Analysis, Insights and Forecast - by Types
- 5.2.1. Wired
- 5.2.2. Wireless
- 5.3. Market Analysis, Insights and Forecast - by Region
- 5.3.1. North America
- 5.3.2. South America
- 5.3.3. Europe
- 5.3.4. Middle East & Africa
- 5.3.5. Asia Pacific
- 5.1. Market Analysis, Insights and Forecast - by Application
- 6. Global Android PDA Scanner Analysis, Insights and Forecast, 2021-2033
- 6.1. Market Analysis, Insights and Forecast - by Application
- 6.1.1. Logistics & Warehousing
- 6.1.2. Industrial Data Storage
- 6.1.3. Healthcare
- 6.1.4. Others
- 6.2. Market Analysis, Insights and Forecast - by Types
- 6.2.1. Wired
- 6.2.2. Wireless
- 6.1. Market Analysis, Insights and Forecast - by Application
- 7. North America Android PDA Scanner Analysis, Insights and Forecast, 2021-2033
- 7.1. Market Analysis, Insights and Forecast - by Application
- 7.1.1. Logistics & Warehousing
- 7.1.2. Industrial Data Storage
- 7.1.3. Healthcare
- 7.1.4. Others
- 7.2. Market Analysis, Insights and Forecast - by Types
- 7.2.1. Wired
- 7.2.2. Wireless
- 7.1. Market Analysis, Insights and Forecast - by Application
- 8. South America Android PDA Scanner Analysis, Insights and Forecast, 2021-2033
- 8.1. Market Analysis, Insights and Forecast - by Application
- 8.1.1. Logistics & Warehousing
- 8.1.2. Industrial Data Storage
- 8.1.3. Healthcare
- 8.1.4. Others
- 8.2. Market Analysis, Insights and Forecast - by Types
- 8.2.1. Wired
- 8.2.2. Wireless
- 8.1. Market Analysis, Insights and Forecast - by Application
- 9. Europe Android PDA Scanner Analysis, Insights and Forecast, 2021-2033
- 9.1. Market Analysis, Insights and Forecast - by Application
- 9.1.1. Logistics & Warehousing
- 9.1.2. Industrial Data Storage
- 9.1.3. Healthcare
- 9.1.4. Others
- 9.2. Market Analysis, Insights and Forecast - by Types
- 9.2.1. Wired
- 9.2.2. Wireless
- 9.1. Market Analysis, Insights and Forecast - by Application
- 10. Middle East & Africa Android PDA Scanner Analysis, Insights and Forecast, 2021-2033
- 10.1. Market Analysis, Insights and Forecast - by Application
- 10.1.1. Logistics & Warehousing
- 10.1.2. Industrial Data Storage
- 10.1.3. Healthcare
- 10.1.4. Others
- 10.2. Market Analysis, Insights and Forecast - by Types
- 10.2.1. Wired
- 10.2.2. Wireless
- 10.1. Market Analysis, Insights and Forecast - by Application
- 11. Asia Pacific Android PDA Scanner Analysis, Insights and Forecast, 2021-2033
- 11.1. Market Analysis, Insights and Forecast - by Application
- 11.1.1. Logistics & Warehousing
- 11.1.2. Industrial Data Storage
- 11.1.3. Healthcare
- 11.1.4. Others
- 11.2. Market Analysis, Insights and Forecast - by Types
- 11.2.1. Wired
- 11.2.2. Wireless
- 11.1. Market Analysis, Insights and Forecast - by Application
- 12. Competitive Analysis
- 12.1. Company Profiles
- 12.1.1 Zebra
- 12.1.1.1. Company Overview
- 12.1.1.2. Products
- 12.1.1.3. Company Financials
- 12.1.1.4. SWOT Analysis
- 12.1.2 Honeywell
- 12.1.2.1. Company Overview
- 12.1.2.2. Products
- 12.1.2.3. Company Financials
- 12.1.2.4. SWOT Analysis
- 12.1.3 Bluebird
- 12.1.3.1. Company Overview
- 12.1.3.2. Products
- 12.1.3.3. Company Financials
- 12.1.3.4. SWOT Analysis
- 12.1.4 Urovo Technology
- 12.1.4.1. Company Overview
- 12.1.4.2. Products
- 12.1.4.3. Company Financials
- 12.1.4.4. SWOT Analysis
- 12.1.5 Datalogic
- 12.1.5.1. Company Overview
- 12.1.5.2. Products
- 12.1.5.3. Company Financials
- 12.1.5.4. SWOT Analysis
- 12.1.6 Newland
- 12.1.6.1. Company Overview
- 12.1.6.2. Products
- 12.1.6.3. Company Financials
- 12.1.6.4. SWOT Analysis
- 12.1.7 CASIO
- 12.1.7.1. Company Overview
- 12.1.7.2. Products
- 12.1.7.3. Company Financials
- 12.1.7.4. SWOT Analysis
- 12.1.8 Denso Wave
- 12.1.8.1. Company Overview
- 12.1.8.2. Products
- 12.1.8.3. Company Financials
- 12.1.8.4. SWOT Analysis
- 12.1.9 Panasonic
- 12.1.9.1. Company Overview
- 12.1.9.2. Products
- 12.1.9.3. Company Financials
- 12.1.9.4. SWOT Analysis
- 12.1.10 Seuic
- 12.1.10.1. Company Overview
- 12.1.10.2. Products
- 12.1.10.3. Company Financials
- 12.1.10.4. SWOT Analysis
- 12.1.11 Shenzhen Chainway
- 12.1.11.1. Company Overview
- 12.1.11.2. Products
- 12.1.11.3. Company Financials
- 12.1.11.4. SWOT Analysis
- 12.1.12 iData
- 12.1.12.1. Company Overview
- 12.1.12.2. Products
- 12.1.12.3. Company Financials
- 12.1.12.4. SWOT Analysis
- 12.1.13 Handheld Group
- 12.1.13.1. Company Overview
- 12.1.13.2. Products
- 12.1.13.3. Company Financials
- 12.1.13.4. SWOT Analysis
- 12.1.14 Supoin
- 12.1.14.1. Company Overview
- 12.1.14.2. Products
- 12.1.14.3. Company Financials
- 12.1.14.4. SWOT Analysis
- 12.1.15 Keyence
- 12.1.15.1. Company Overview
- 12.1.15.2. Products
- 12.1.15.3. Company Financials
- 12.1.15.4. SWOT Analysis
- 12.1.16 Cipherlab
- 12.1.16.1. Company Overview
- 12.1.16.2. Products
- 12.1.16.3. Company Financials
- 12.1.16.4. SWOT Analysis
- 12.1.1 Zebra
- 12.2. Market Entropy
- 12.2.1 Company's Key Areas Served
- 12.2.2 Recent Developments
- 12.3. Company Market Share Analysis 2025
- 12.3.1 Top 5 Companies Market Share Analysis
- 12.3.2 Top 3 Companies Market Share Analysis
- 12.4. List of Potential Customers
- 13. Research Methodology
List of Figures
- Figure 1: Global Android PDA Scanner Revenue Breakdown (billion, %) by Region 2025 & 2033
- Figure 2: Global Android PDA Scanner Volume Breakdown (K, %) by Region 2025 & 2033
- Figure 3: North America Android PDA Scanner Revenue (billion), by Application 2025 & 2033
- Figure 4: North America Android PDA Scanner Volume (K), by Application 2025 & 2033
- Figure 5: North America Android PDA Scanner Revenue Share (%), by Application 2025 & 2033
- Figure 6: North America Android PDA Scanner Volume Share (%), by Application 2025 & 2033
- Figure 7: North America Android PDA Scanner Revenue (billion), by Types 2025 & 2033
- Figure 8: North America Android PDA Scanner Volume (K), by Types 2025 & 2033
- Figure 9: North America Android PDA Scanner Revenue Share (%), by Types 2025 & 2033
- Figure 10: North America Android PDA Scanner Volume Share (%), by Types 2025 & 2033
- Figure 11: North America Android PDA Scanner Revenue (billion), by Country 2025 & 2033
- Figure 12: North America Android PDA Scanner Volume (K), by Country 2025 & 2033
- Figure 13: North America Android PDA Scanner Revenue Share (%), by Country 2025 & 2033
- Figure 14: North America Android PDA Scanner Volume Share (%), by Country 2025 & 2033
- Figure 15: South America Android PDA Scanner Revenue (billion), by Application 2025 & 2033
- Figure 16: South America Android PDA Scanner Volume (K), by Application 2025 & 2033
- Figure 17: South America Android PDA Scanner Revenue Share (%), by Application 2025 & 2033
- Figure 18: South America Android PDA Scanner Volume Share (%), by Application 2025 & 2033
- Figure 19: South America Android PDA Scanner Revenue (billion), by Types 2025 & 2033
- Figure 20: South America Android PDA Scanner Volume (K), by Types 2025 & 2033
- Figure 21: South America Android PDA Scanner Revenue Share (%), by Types 2025 & 2033
- Figure 22: South America Android PDA Scanner Volume Share (%), by Types 2025 & 2033
- Figure 23: South America Android PDA Scanner Revenue (billion), by Country 2025 & 2033
- Figure 24: South America Android PDA Scanner Volume (K), by Country 2025 & 2033
- Figure 25: South America Android PDA Scanner Revenue Share (%), by Country 2025 & 2033
- Figure 26: South America Android PDA Scanner Volume Share (%), by Country 2025 & 2033
- Figure 27: Europe Android PDA Scanner Revenue (billion), by Application 2025 & 2033
- Figure 28: Europe Android PDA Scanner Volume (K), by Application 2025 & 2033
- Figure 29: Europe Android PDA Scanner Revenue Share (%), by Application 2025 & 2033
- Figure 30: Europe Android PDA Scanner Volume Share (%), by Application 2025 & 2033
- Figure 31: Europe Android PDA Scanner Revenue (billion), by Types 2025 & 2033
- Figure 32: Europe Android PDA Scanner Volume (K), by Types 2025 & 2033
- Figure 33: Europe Android PDA Scanner Revenue Share (%), by Types 2025 & 2033
- Figure 34: Europe Android PDA Scanner Volume Share (%), by Types 2025 & 2033
- Figure 35: Europe Android PDA Scanner Revenue (billion), by Country 2025 & 2033
- Figure 36: Europe Android PDA Scanner Volume (K), by Country 2025 & 2033
- Figure 37: Europe Android PDA Scanner Revenue Share (%), by Country 2025 & 2033
- Figure 38: Europe Android PDA Scanner Volume Share (%), by Country 2025 & 2033
- Figure 39: Middle East & Africa Android PDA Scanner Revenue (billion), by Application 2025 & 2033
- Figure 40: Middle East & Africa Android PDA Scanner Volume (K), by Application 2025 & 2033
- Figure 41: Middle East & Africa Android PDA Scanner Revenue Share (%), by Application 2025 & 2033
- Figure 42: Middle East & Africa Android PDA Scanner Volume Share (%), by Application 2025 & 2033
- Figure 43: Middle East & Africa Android PDA Scanner Revenue (billion), by Types 2025 & 2033
- Figure 44: Middle East & Africa Android PDA Scanner Volume (K), by Types 2025 & 2033
- Figure 45: Middle East & Africa Android PDA Scanner Revenue Share (%), by Types 2025 & 2033
- Figure 46: Middle East & Africa Android PDA Scanner Volume Share (%), by Types 2025 & 2033
- Figure 47: Middle East & Africa Android PDA Scanner Revenue (billion), by Country 2025 & 2033
- Figure 48: Middle East & Africa Android PDA Scanner Volume (K), by Country 2025 & 2033
- Figure 49: Middle East & Africa Android PDA Scanner Revenue Share (%), by Country 2025 & 2033
- Figure 50: Middle East & Africa Android PDA Scanner Volume Share (%), by Country 2025 & 2033
- Figure 51: Asia Pacific Android PDA Scanner Revenue (billion), by Application 2025 & 2033
- Figure 52: Asia Pacific Android PDA Scanner Volume (K), by Application 2025 & 2033
- Figure 53: Asia Pacific Android PDA Scanner Revenue Share (%), by Application 2025 & 2033
- Figure 54: Asia Pacific Android PDA Scanner Volume Share (%), by Application 2025 & 2033
- Figure 55: Asia Pacific Android PDA Scanner Revenue (billion), by Types 2025 & 2033
- Figure 56: Asia Pacific Android PDA Scanner Volume (K), by Types 2025 & 2033
- Figure 57: Asia Pacific Android PDA Scanner Revenue Share (%), by Types 2025 & 2033
- Figure 58: Asia Pacific Android PDA Scanner Volume Share (%), by Types 2025 & 2033
- Figure 59: Asia Pacific Android PDA Scanner Revenue (billion), by Country 2025 & 2033
- Figure 60: Asia Pacific Android PDA Scanner Volume (K), by Country 2025 & 2033
- Figure 61: Asia Pacific Android PDA Scanner Revenue Share (%), by Country 2025 & 2033
- Figure 62: Asia Pacific Android PDA Scanner Volume Share (%), by Country 2025 & 2033
List of Tables
- Table 1: Global Android PDA Scanner Revenue billion Forecast, by Application 2020 & 2033
- Table 2: Global Android PDA Scanner Volume K Forecast, by Application 2020 & 2033
- Table 3: Global Android PDA Scanner Revenue billion Forecast, by Types 2020 & 2033
- Table 4: Global Android PDA Scanner Volume K Forecast, by Types 2020 & 2033
- Table 5: Global Android PDA Scanner Revenue billion Forecast, by Region 2020 & 2033
- Table 6: Global Android PDA Scanner Volume K Forecast, by Region 2020 & 2033
- Table 7: Global Android PDA Scanner Revenue billion Forecast, by Application 2020 & 2033
- Table 8: Global Android PDA Scanner Volume K Forecast, by Application 2020 & 2033
- Table 9: Global Android PDA Scanner Revenue billion Forecast, by Types 2020 & 2033
- Table 10: Global Android PDA Scanner Volume K Forecast, by Types 2020 & 2033
- Table 11: Global Android PDA Scanner Revenue billion Forecast, by Country 2020 & 2033
- Table 12: Global Android PDA Scanner Volume K Forecast, by Country 2020 & 2033
- Table 13: United States Android PDA Scanner Revenue (billion) Forecast, by Application 2020 & 2033
- Table 14: United States Android PDA Scanner Volume (K) Forecast, by Application 2020 & 2033
- Table 15: Canada Android PDA Scanner Revenue (billion) Forecast, by Application 2020 & 2033
- Table 16: Canada Android PDA Scanner Volume (K) Forecast, by Application 2020 & 2033
- Table 17: Mexico Android PDA Scanner Revenue (billion) Forecast, by Application 2020 & 2033
- Table 18: Mexico Android PDA Scanner Volume (K) Forecast, by Application 2020 & 2033
- Table 19: Global Android PDA Scanner Revenue billion Forecast, by Application 2020 & 2033
- Table 20: Global Android PDA Scanner Volume K Forecast, by Application 2020 & 2033
- Table 21: Global Android PDA Scanner Revenue billion Forecast, by Types 2020 & 2033
- Table 22: Global Android PDA Scanner Volume K Forecast, by Types 2020 & 2033
- Table 23: Global Android PDA Scanner Revenue billion Forecast, by Country 2020 & 2033
- Table 24: Global Android PDA Scanner Volume K Forecast, by Country 2020 & 2033
- Table 25: Brazil Android PDA Scanner Revenue (billion) Forecast, by Application 2020 & 2033
- Table 26: Brazil Android PDA Scanner Volume (K) Forecast, by Application 2020 & 2033
- Table 27: Argentina Android PDA Scanner Revenue (billion) Forecast, by Application 2020 & 2033
- Table 28: Argentina Android PDA Scanner Volume (K) Forecast, by Application 2020 & 2033
- Table 29: Rest of South America Android PDA Scanner Revenue (billion) Forecast, by Application 2020 & 2033
- Table 30: Rest of South America Android PDA Scanner Volume (K) Forecast, by Application 2020 & 2033
- Table 31: Global Android PDA Scanner Revenue billion Forecast, by Application 2020 & 2033
- Table 32: Global Android PDA Scanner Volume K Forecast, by Application 2020 & 2033
- Table 33: Global Android PDA Scanner Revenue billion Forecast, by Types 2020 & 2033
- Table 34: Global Android PDA Scanner Volume K Forecast, by Types 2020 & 2033
- Table 35: Global Android PDA Scanner Revenue billion Forecast, by Country 2020 & 2033
- Table 36: Global Android PDA Scanner Volume K Forecast, by Country 2020 & 2033
- Table 37: United Kingdom Android PDA Scanner Revenue (billion) Forecast, by Application 2020 & 2033
- Table 38: United Kingdom Android PDA Scanner Volume (K) Forecast, by Application 2020 & 2033
- Table 39: Germany Android PDA Scanner Revenue (billion) Forecast, by Application 2020 & 2033
- Table 40: Germany Android PDA Scanner Volume (K) Forecast, by Application 2020 & 2033
- Table 41: France Android PDA Scanner Revenue (billion) Forecast, by Application 2020 & 2033
- Table 42: France Android PDA Scanner Volume (K) Forecast, by Application 2020 & 2033
- Table 43: Italy Android PDA Scanner Revenue (billion) Forecast, by Application 2020 & 2033
- Table 44: Italy Android PDA Scanner Volume (K) Forecast, by Application 2020 & 2033
- Table 45: Spain Android PDA Scanner Revenue (billion) Forecast, by Application 2020 & 2033
- Table 46: Spain Android PDA Scanner Volume (K) Forecast, by Application 2020 & 2033
- Table 47: Russia Android PDA Scanner Revenue (billion) Forecast, by Application 2020 & 2033
- Table 48: Russia Android PDA Scanner Volume (K) Forecast, by Application 2020 & 2033
- Table 49: Benelux Android PDA Scanner Revenue (billion) Forecast, by Application 2020 & 2033
- Table 50: Benelux Android PDA Scanner Volume (K) Forecast, by Application 2020 & 2033
- Table 51: Nordics Android PDA Scanner Revenue (billion) Forecast, by Application 2020 & 2033
- Table 52: Nordics Android PDA Scanner Volume (K) Forecast, by Application 2020 & 2033
- Table 53: Rest of Europe Android PDA Scanner Revenue (billion) Forecast, by Application 2020 & 2033
- Table 54: Rest of Europe Android PDA Scanner Volume (K) Forecast, by Application 2020 & 2033
- Table 55: Global Android PDA Scanner Revenue billion Forecast, by Application 2020 & 2033
- Table 56: Global Android PDA Scanner Volume K Forecast, by Application 2020 & 2033
- Table 57: Global Android PDA Scanner Revenue billion Forecast, by Types 2020 & 2033
- Table 58: Global Android PDA Scanner Volume K Forecast, by Types 2020 & 2033
- Table 59: Global Android PDA Scanner Revenue billion Forecast, by Country 2020 & 2033
- Table 60: Global Android PDA Scanner Volume K Forecast, by Country 2020 & 2033
- Table 61: Turkey Android PDA Scanner Revenue (billion) Forecast, by Application 2020 & 2033
- Table 62: Turkey Android PDA Scanner Volume (K) Forecast, by Application 2020 & 2033
- Table 63: Israel Android PDA Scanner Revenue (billion) Forecast, by Application 2020 & 2033
- Table 64: Israel Android PDA Scanner Volume (K) Forecast, by Application 2020 & 2033
- Table 65: GCC Android PDA Scanner Revenue (billion) Forecast, by Application 2020 & 2033
- Table 66: GCC Android PDA Scanner Volume (K) Forecast, by Application 2020 & 2033
- Table 67: North Africa Android PDA Scanner Revenue (billion) Forecast, by Application 2020 & 2033
- Table 68: North Africa Android PDA Scanner Volume (K) Forecast, by Application 2020 & 2033
- Table 69: South Africa Android PDA Scanner Revenue (billion) Forecast, by Application 2020 & 2033
- Table 70: South Africa Android PDA Scanner Volume (K) Forecast, by Application 2020 & 2033
- Table 71: Rest of Middle East & Africa Android PDA Scanner Revenue (billion) Forecast, by Application 2020 & 2033
- Table 72: Rest of Middle East & Africa Android PDA Scanner Volume (K) Forecast, by Application 2020 & 2033
- Table 73: Global Android PDA Scanner Revenue billion Forecast, by Application 2020 & 2033
- Table 74: Global Android PDA Scanner Volume K Forecast, by Application 2020 & 2033
- Table 75: Global Android PDA Scanner Revenue billion Forecast, by Types 2020 & 2033
- Table 76: Global Android PDA Scanner Volume K Forecast, by Types 2020 & 2033
- Table 77: Global Android PDA Scanner Revenue billion Forecast, by Country 2020 & 2033
- Table 78: Global Android PDA Scanner Volume K Forecast, by Country 2020 & 2033
- Table 79: China Android PDA Scanner Revenue (billion) Forecast, by Application 2020 & 2033
- Table 80: China Android PDA Scanner Volume (K) Forecast, by Application 2020 & 2033
- Table 81: India Android PDA Scanner Revenue (billion) Forecast, by Application 2020 & 2033
- Table 82: India Android PDA Scanner Volume (K) Forecast, by Application 2020 & 2033
- Table 83: Japan Android PDA Scanner Revenue (billion) Forecast, by Application 2020 & 2033
- Table 84: Japan Android PDA Scanner Volume (K) Forecast, by Application 2020 & 2033
- Table 85: South Korea Android PDA Scanner Revenue (billion) Forecast, by Application 2020 & 2033
- Table 86: South Korea Android PDA Scanner Volume (K) Forecast, by Application 2020 & 2033
- Table 87: ASEAN Android PDA Scanner Revenue (billion) Forecast, by Application 2020 & 2033
- Table 88: ASEAN Android PDA Scanner Volume (K) Forecast, by Application 2020 & 2033
- Table 89: Oceania Android PDA Scanner Revenue (billion) Forecast, by Application 2020 & 2033
- Table 90: Oceania Android PDA Scanner Volume (K) Forecast, by Application 2020 & 2033
- Table 91: Rest of Asia Pacific Android PDA Scanner Revenue (billion) Forecast, by Application 2020 & 2033
- Table 92: Rest of Asia Pacific Android PDA Scanner Volume (K) Forecast, by Application 2020 & 2033
Frequently Asked Questions
1. What is the projected Compound Annual Growth Rate (CAGR) of the Android PDA Scanner?
The projected CAGR is approximately 9.11%.
2. Which companies are prominent players in the Android PDA Scanner?
Key companies in the market include Zebra, Honeywell, Bluebird, Urovo Technology, Datalogic, Newland, CASIO, Denso Wave, Panasonic, Seuic, Shenzhen Chainway, iData, Handheld Group, Supoin, Keyence, Cipherlab.
3. What are the main segments of the Android PDA Scanner?
The market segments include Application, Types.
4. Can you provide details about the market size?
The market size is estimated to be USD 3.42 billion as of 2022.
5. What are some drivers contributing to market growth?
N/A
6. What are the notable trends driving market growth?
N/A
7. Are there any restraints impacting market growth?
N/A
8. Can you provide examples of recent developments in the market?
N/A
9. What pricing options are available for accessing the report?
Pricing options include single-user, multi-user, and enterprise licenses priced at USD 4350.00, USD 6525.00, and USD 8700.00 respectively.
10. Is the market size provided in terms of value or volume?
The market size is provided in terms of value, measured in billion and volume, measured in K.
11. Are there any specific market keywords associated with the report?
Yes, the market keyword associated with the report is "Android PDA Scanner," which aids in identifying and referencing the specific market segment covered.
12. How do I determine which pricing option suits my needs best?
The pricing options vary based on user requirements and access needs. Individual users may opt for single-user licenses, while businesses requiring broader access may choose multi-user or enterprise licenses for cost-effective access to the report.
13. Are there any additional resources or data provided in the Android PDA Scanner report?
While the report offers comprehensive insights, it's advisable to review the specific contents or supplementary materials provided to ascertain if additional resources or data are available.
14. How can I stay updated on further developments or reports in the Android PDA Scanner?
To stay informed about further developments, trends, and reports in the Android PDA Scanner, consider subscribing to industry newsletters, following relevant companies and organizations, or regularly checking reputable industry news sources and publications.
Methodology
Step 1 - Identification of Relevant Samples Size from Population Database


Step 2 - Approaches for Defining Global Market Size (Value, Volume* & Price*)

Note*: In applicable scenarios
Step 3 - Data Sources
Primary Research
- Web Analytics
- Survey Reports
- Research Institute
- Latest Research Reports
- Opinion Leaders
Secondary Research
- Annual Reports
- White Paper
- Latest Press Release
- Industry Association
- Paid Database
- Investor Presentations

Step 4 - Data Triangulation
Involves using different sources of information in order to increase the validity of a study
These sources are likely to be stakeholders in a program - participants, other researchers, program staff, other community members, and so on.
Then we put all data in single framework & apply various statistical tools to find out the dynamic on the market.
During the analysis stage, feedback from the stakeholder groups would be compared to determine areas of agreement as well as areas of divergence