

Key Insights
The Artificial Intelligence of Things (AIoT) Smart Management Solution market is projected for significant expansion, fueled by escalating IoT device adoption and the imperative for advanced data management. AI's integration with IoT facilitates intelligent systems for optimized resource allocation, predictive maintenance, and enhanced operational efficiency. This market is anticipated to reach $5.62 billion, with a Compound Annual Growth Rate (CAGR) of 8.23% during the forecast period from 2025 to 2033. Key growth catalysts include the demand for real-time analytics, robust security, and predictive maintenance across manufacturing, healthcare, and smart city applications. Emerging trends like edge computing and cloud solutions, alongside sophisticated AI algorithms, are driving this momentum. Nevertheless, market adoption faces hurdles such as data security concerns, integration complexities, and substantial upfront investment. The market is segmented by deployment models (cloud, on-premises), applications (industrial automation, smart cities, healthcare), and components (hardware, software, services). Leading vendors are actively innovating, fostering a competitive environment that accelerates market development.
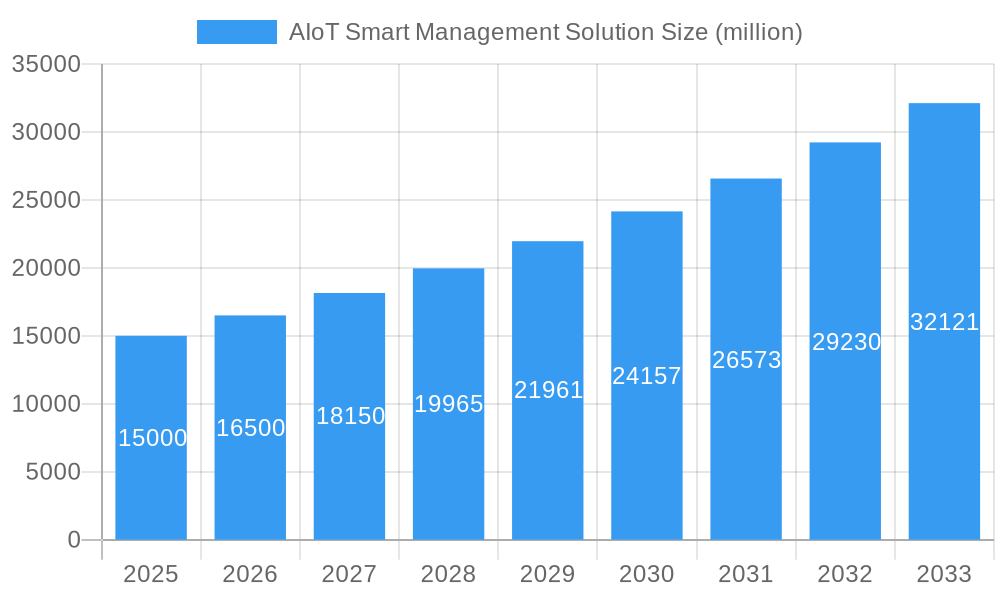
AIoT Smart Management Solution Market Size (In Billion)
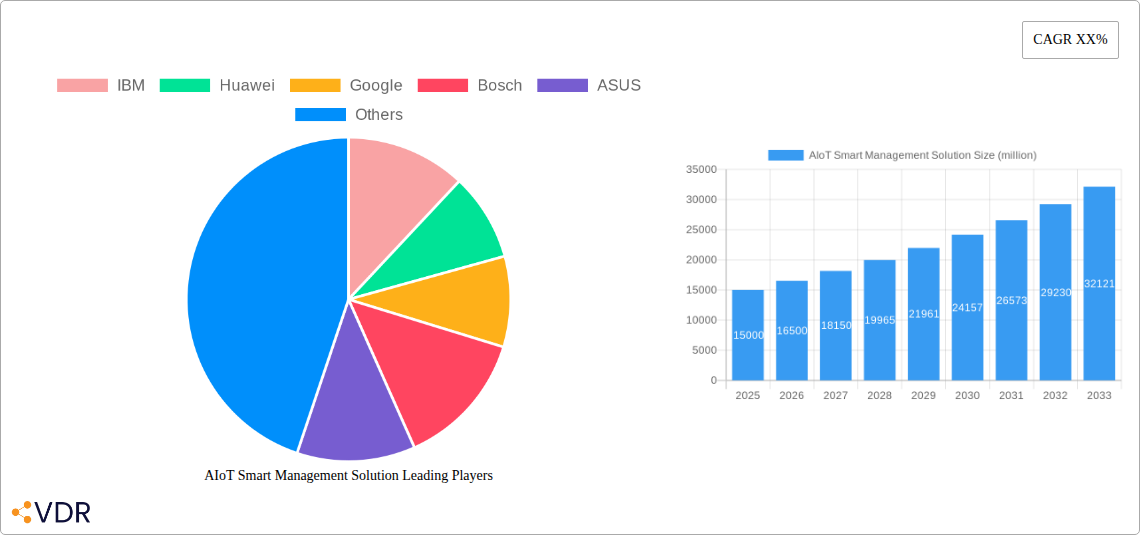
The competitive arena features established technology leaders including IBM, Huawei, and Google, alongside specialized AIoT providers such as ADLINK Technology, Axiomtek, and Milesight. Strategic alliances, mergers, and product innovation are central to their market positioning. Emerging economies with developing IoT infrastructures present substantial growth opportunities for geographical expansion. The market's positive outlook is further supported by ongoing technological advancements that lower implementation barriers and increase solution accessibility. The proliferation of 5G networks and advanced analytics underscore the robust future of AIoT Smart Management Solutions.
AIoT Smart Management Solution Company Market Share
AIoT Smart Management Solution Market Report: 2019-2033
This comprehensive report provides a detailed analysis of the AIoT Smart Management Solution market, encompassing market dynamics, growth trends, regional dominance, product landscape, key players, and future outlook. The study period covers 2019-2033, with 2025 as the base and estimated year. The forecast period is 2025-2033, and the historical period is 2019-2024. The report caters to industry professionals, investors, and businesses seeking insights into this rapidly evolving sector. The market is segmented into [Segment 1], [Segment 2], [Segment 3], and [Segment 4]. The parent market is IoT solutions, and the child market includes smart city management, industrial automation, and smart building management.
AIoT Smart Management Solution Market Dynamics & Structure
The AIoT Smart Management Solution market is experiencing significant growth, driven by technological advancements, increasing adoption across various industries, and favorable government regulations. The market is moderately concentrated, with a few major players holding substantial market share. However, numerous smaller companies are also contributing to innovation and market expansion. The market size in 2025 is estimated at $xx billion, representing a CAGR of xx% from 2019.
- Market Concentration: The top 5 players account for approximately xx% of the market share in 2025.
- Technological Innovation: Advancements in AI algorithms, edge computing, and 5G connectivity are key drivers.
- Regulatory Frameworks: Government initiatives promoting digitalization and smart infrastructure are boosting adoption.
- Competitive Product Substitutes: Traditional management solutions face increasing competition from AIoT-based alternatives.
- End-User Demographics: The primary end-users include governments, industrial manufacturers, and building management companies. Significant adoption is witnessed across smart cities, manufacturing plants, and large commercial buildings.
- M&A Trends: The past five years have seen xx M&A deals, demonstrating a growing interest in market consolidation and technological acquisition.
AIoT Smart Management Solution Growth Trends & Insights
The AIoT Smart Management Solution market demonstrates robust growth, projected to reach $xx billion by 2033, exhibiting a CAGR of xx% during the forecast period. This growth is fueled by several factors. Increasing demand for efficient resource management and operational optimization across diverse sectors is a key driver. The widespread adoption of cloud-based solutions, coupled with decreasing hardware costs, is also contributing to market expansion. Furthermore, consumer preference towards intelligent, automated solutions enhances market adoption rates.
The market penetration rate is currently at xx% and is expected to reach xx% by 2033. Technological disruptions, such as the emergence of AI-powered predictive maintenance and real-time data analytics, are further driving market growth. Shifting consumer behavior towards connected and automated systems plays a crucial role in shaping market trends.
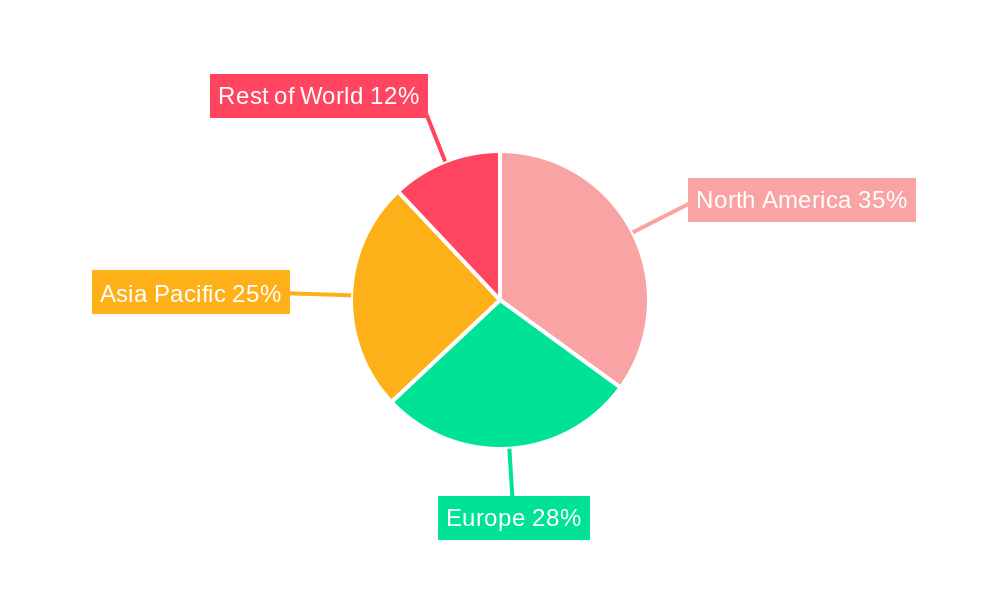
Dominant Regions, Countries, or Segments in AIoT Smart Management Solution
North America currently holds the largest market share, followed by Asia-Pacific. However, Asia-Pacific is projected to witness the highest growth rate during the forecast period due to its large and growing economies, increasing government investments in infrastructure development, and expanding digitalization initiatives across sectors. China and India are significant contributors to this regional growth. Within the market segments, [Segment 1] is currently the leading segment, however, [Segment 2] is expected to show significant growth over the forecast period.
- Key Drivers in Asia-Pacific:
- Massive infrastructure development projects
- Increasing government investments in smart city initiatives
- Favorable regulatory environment encouraging technology adoption
- Dominance Factors: The presence of large technology companies, government support for AIoT technologies, and a high concentration of industries drive North America’s current market leadership.
AIoT Smart Management Solution Product Landscape
The AIoT Smart Management Solution market offers a diverse range of products, including hardware components (sensors, gateways, and edge devices), software platforms (data analytics and visualization tools), and integrated solutions tailored for specific industries. Key innovations include improved sensor accuracy, advanced machine learning algorithms for predictive analytics, and enhanced cybersecurity features to protect sensitive data. These solutions provide improved operational efficiency, reduced costs, and enhanced security.
Key Drivers, Barriers & Challenges in AIoT Smart Management Solution
Key Drivers:
- Rapid technological advancements in AI and IoT.
- Increasing demand for improved operational efficiency and cost reduction across sectors.
- Growing adoption of cloud-based solutions.
- Government initiatives promoting smart cities and Industry 4.0.
Key Challenges:
- High initial investment costs for implementation.
- Data security and privacy concerns.
- Interoperability issues between different systems.
- Lack of skilled workforce to manage and maintain AIoT systems. This contributes to a xx% increase in operational costs for early adopters.
Emerging Opportunities in AIoT Smart Management Solution
- Expanding applications in emerging economies.
- Integration of AIoT with other technologies like blockchain and edge computing.
- Development of niche solutions for specific industries.
- Growing demand for AI-powered predictive maintenance in manufacturing and industrial automation.
Growth Accelerators in the AIoT Smart Management Solution Industry
Strategic partnerships between technology providers and end-users, coupled with technological breakthroughs in AI and IoT, are key growth catalysts. Market expansion strategies targeting untapped markets and developing innovative applications tailored to specific industry needs are crucial for long-term success. Government initiatives promoting digital transformation and favorable regulatory environments further accelerate market growth.
Key Players Shaping the AIoT Smart Management Solution Market
Notable Milestones in AIoT Smart Management Solution Sector
- 2020: Increased government funding for smart city initiatives in several countries.
- 2021: Launch of several new AIoT platforms by major technology companies.
- 2022: Significant increase in M&A activity within the AIoT sector.
- 2023: Development of advanced AI algorithms for predictive maintenance and real-time data analytics.
- 2024: Introduction of new security protocols to improve data protection.
In-Depth AIoT Smart Management Solution Market Outlook
The AIoT Smart Management Solution market is poised for sustained growth over the next decade, driven by continuous technological innovations, expanding adoption across various sectors, and supportive government policies. Strategic partnerships, focused market expansion strategies, and advancements in AI and IoT will unlock significant growth potential. The market is expected to become increasingly sophisticated, with solutions offering enhanced security, scalability, and interoperability.
AIoT Smart Management Solution Segmentation
-
1. Application
- 1.1. Smart Homes
- 1.2. Industrial Automation
- 1.3. Healthcare
- 1.4. Smart Cities
- 1.5. Agriculture
- 1.6. Retail
- 1.7. Transportation
- 1.8. Others
-
2. Types
- 2.1. Hardware
- 2.2. Software and Services
AIoT Smart Management Solution Segmentation By Geography
-
1. North America
- 1.1. United States
- 1.2. Canada
- 1.3. Mexico
-
2. South America
- 2.1. Brazil
- 2.2. Argentina
- 2.3. Rest of South America
-
3. Europe
- 3.1. United Kingdom
- 3.2. Germany
- 3.3. France
- 3.4. Italy
- 3.5. Spain
- 3.6. Russia
- 3.7. Benelux
- 3.8. Nordics
- 3.9. Rest of Europe
-
4. Middle East & Africa
- 4.1. Turkey
- 4.2. Israel
- 4.3. GCC
- 4.4. North Africa
- 4.5. South Africa
- 4.6. Rest of Middle East & Africa
-
5. Asia Pacific
- 5.1. China
- 5.2. India
- 5.3. Japan
- 5.4. South Korea
- 5.5. ASEAN
- 5.6. Oceania
- 5.7. Rest of Asia Pacific
AIoT Smart Management Solution Regional Market Share
Geographic Coverage of AIoT Smart Management Solution
AIoT Smart Management Solution REPORT HIGHLIGHTS
| Aspects | Details |
|---|---|
| Study Period | 2020-2034 |
| Base Year | 2025 |
| Estimated Year | 2026 |
| Forecast Period | 2026-2034 |
| Historical Period | 2020-2025 |
| Growth Rate | CAGR of 8.23% from 2020-2034 |
| Segmentation |
|
Table of Contents
- 1. Introduction
- 1.1. Research Scope
- 1.2. Market Segmentation
- 1.3. Research Objective
- 1.4. Definitions and Assumptions
- 2. Executive Summary
- 2.1. Market Snapshot
- 3. Market Dynamics
- 3.1. Market Drivers
- 3.2. Market Restrains
- 3.3. Market Trends
- 3.4. Market Opportunities
- 4. Market Factor Analysis
- 4.1. Porters Five Forces
- 4.1.1. Bargaining Power of Suppliers
- 4.1.2. Bargaining Power of Buyers
- 4.1.3. Threat of New Entrants
- 4.1.4. Threat of Substitutes
- 4.1.5. Competitive Rivalry
- 4.2. PESTEL analysis
- 4.3. BCG Analysis
- 4.3.1. Stars (High Growth, High Market Share)
- 4.3.2. Cash Cows (Low Growth, High Market Share)
- 4.3.3. Question Mark (High Growth, Low Market Share)
- 4.3.4. Dogs (Low Growth, Low Market Share)
- 4.4. Ansoff Matrix Analysis
- 4.5. Supply Chain Analysis
- 4.6. Regulatory Landscape
- 4.7. Current Market Potential and Opportunity Assessment (TAM–SAM–SOM Framework)
- 4.8. VDR Analyst Note
- 4.1. Porters Five Forces
- 5. Market Analysis, Insights and Forecast 2021-2033
- 5.1. Market Analysis, Insights and Forecast - by Application
- 5.1.1. Smart Homes
- 5.1.2. Industrial Automation
- 5.1.3. Healthcare
- 5.1.4. Smart Cities
- 5.1.5. Agriculture
- 5.1.6. Retail
- 5.1.7. Transportation
- 5.1.8. Others
- 5.2. Market Analysis, Insights and Forecast - by Types
- 5.2.1. Hardware
- 5.2.2. Software and Services
- 5.3. Market Analysis, Insights and Forecast - by Region
- 5.3.1. North America
- 5.3.2. South America
- 5.3.3. Europe
- 5.3.4. Middle East & Africa
- 5.3.5. Asia Pacific
- 5.1. Market Analysis, Insights and Forecast - by Application
- 6. Global AIoT Smart Management Solution Analysis, Insights and Forecast, 2021-2033
- 6.1. Market Analysis, Insights and Forecast - by Application
- 6.1.1. Smart Homes
- 6.1.2. Industrial Automation
- 6.1.3. Healthcare
- 6.1.4. Smart Cities
- 6.1.5. Agriculture
- 6.1.6. Retail
- 6.1.7. Transportation
- 6.1.8. Others
- 6.2. Market Analysis, Insights and Forecast - by Types
- 6.2.1. Hardware
- 6.2.2. Software and Services
- 6.1. Market Analysis, Insights and Forecast - by Application
- 7. North America AIoT Smart Management Solution Analysis, Insights and Forecast, 2021-2033
- 7.1. Market Analysis, Insights and Forecast - by Application
- 7.1.1. Smart Homes
- 7.1.2. Industrial Automation
- 7.1.3. Healthcare
- 7.1.4. Smart Cities
- 7.1.5. Agriculture
- 7.1.6. Retail
- 7.1.7. Transportation
- 7.1.8. Others
- 7.2. Market Analysis, Insights and Forecast - by Types
- 7.2.1. Hardware
- 7.2.2. Software and Services
- 7.1. Market Analysis, Insights and Forecast - by Application
- 8. South America AIoT Smart Management Solution Analysis, Insights and Forecast, 2021-2033
- 8.1. Market Analysis, Insights and Forecast - by Application
- 8.1.1. Smart Homes
- 8.1.2. Industrial Automation
- 8.1.3. Healthcare
- 8.1.4. Smart Cities
- 8.1.5. Agriculture
- 8.1.6. Retail
- 8.1.7. Transportation
- 8.1.8. Others
- 8.2. Market Analysis, Insights and Forecast - by Types
- 8.2.1. Hardware
- 8.2.2. Software and Services
- 8.1. Market Analysis, Insights and Forecast - by Application
- 9. Europe AIoT Smart Management Solution Analysis, Insights and Forecast, 2021-2033
- 9.1. Market Analysis, Insights and Forecast - by Application
- 9.1.1. Smart Homes
- 9.1.2. Industrial Automation
- 9.1.3. Healthcare
- 9.1.4. Smart Cities
- 9.1.5. Agriculture
- 9.1.6. Retail
- 9.1.7. Transportation
- 9.1.8. Others
- 9.2. Market Analysis, Insights and Forecast - by Types
- 9.2.1. Hardware
- 9.2.2. Software and Services
- 9.1. Market Analysis, Insights and Forecast - by Application
- 10. Middle East & Africa AIoT Smart Management Solution Analysis, Insights and Forecast, 2021-2033
- 10.1. Market Analysis, Insights and Forecast - by Application
- 10.1.1. Smart Homes
- 10.1.2. Industrial Automation
- 10.1.3. Healthcare
- 10.1.4. Smart Cities
- 10.1.5. Agriculture
- 10.1.6. Retail
- 10.1.7. Transportation
- 10.1.8. Others
- 10.2. Market Analysis, Insights and Forecast - by Types
- 10.2.1. Hardware
- 10.2.2. Software and Services
- 10.1. Market Analysis, Insights and Forecast - by Application
- 11. Asia Pacific AIoT Smart Management Solution Analysis, Insights and Forecast, 2021-2033
- 11.1. Market Analysis, Insights and Forecast - by Application
- 11.1.1. Smart Homes
- 11.1.2. Industrial Automation
- 11.1.3. Healthcare
- 11.1.4. Smart Cities
- 11.1.5. Agriculture
- 11.1.6. Retail
- 11.1.7. Transportation
- 11.1.8. Others
- 11.2. Market Analysis, Insights and Forecast - by Types
- 11.2.1. Hardware
- 11.2.2. Software and Services
- 11.1. Market Analysis, Insights and Forecast - by Application
- 12. Competitive Analysis
- 12.1. Company Profiles
- 12.1.1 IBM
- 12.1.1.1. Company Overview
- 12.1.1.2. Products
- 12.1.1.3. Company Financials
- 12.1.1.4. SWOT Analysis
- 12.1.2 Huawei
- 12.1.2.1. Company Overview
- 12.1.2.2. Products
- 12.1.2.3. Company Financials
- 12.1.2.4. SWOT Analysis
- 12.1.3 Google
- 12.1.3.1. Company Overview
- 12.1.3.2. Products
- 12.1.3.3. Company Financials
- 12.1.3.4. SWOT Analysis
- 12.1.4 Bosch
- 12.1.4.1. Company Overview
- 12.1.4.2. Products
- 12.1.4.3. Company Financials
- 12.1.4.4. SWOT Analysis
- 12.1.5 ASUS
- 12.1.5.1. Company Overview
- 12.1.5.2. Products
- 12.1.5.3. Company Financials
- 12.1.5.4. SWOT Analysis
- 12.1.6 ADLINK Technology
- 12.1.6.1. Company Overview
- 12.1.6.2. Products
- 12.1.6.3. Company Financials
- 12.1.6.4. SWOT Analysis
- 12.1.7 Dahua Technology
- 12.1.7.1. Company Overview
- 12.1.7.2. Products
- 12.1.7.3. Company Financials
- 12.1.7.4. SWOT Analysis
- 12.1.8 Sharp
- 12.1.8.1. Company Overview
- 12.1.8.2. Products
- 12.1.8.3. Company Financials
- 12.1.8.4. SWOT Analysis
- 12.1.9 Axiomtek
- 12.1.9.1. Company Overview
- 12.1.9.2. Products
- 12.1.9.3. Company Financials
- 12.1.9.4. SWOT Analysis
- 12.1.10 SEMIFIVE
- 12.1.10.1. Company Overview
- 12.1.10.2. Products
- 12.1.10.3. Company Financials
- 12.1.10.4. SWOT Analysis
- 12.1.11 ThunderSoft
- 12.1.11.1. Company Overview
- 12.1.11.2. Products
- 12.1.11.3. Company Financials
- 12.1.11.4. SWOT Analysis
- 12.1.12 Milesight
- 12.1.12.1. Company Overview
- 12.1.12.2. Products
- 12.1.12.3. Company Financials
- 12.1.12.4. SWOT Analysis
- 12.1.13 Epichust
- 12.1.13.1. Company Overview
- 12.1.13.2. Products
- 12.1.13.3. Company Financials
- 12.1.13.4. SWOT Analysis
- 12.1.14 CloudWalk Technology
- 12.1.14.1. Company Overview
- 12.1.14.2. Products
- 12.1.14.3. Company Financials
- 12.1.14.4. SWOT Analysis
- 12.1.15 HuiLan
- 12.1.15.1. Company Overview
- 12.1.15.2. Products
- 12.1.15.3. Company Financials
- 12.1.15.4. SWOT Analysis
- 12.1.16 Kiwi technology Inc.
- 12.1.16.1. Company Overview
- 12.1.16.2. Products
- 12.1.16.3. Company Financials
- 12.1.16.4. SWOT Analysis
- 12.1.17 Elink
- 12.1.17.1. Company Overview
- 12.1.17.2. Products
- 12.1.17.3. Company Financials
- 12.1.17.4. SWOT Analysis
- 12.1.18 Hailong Technology
- 12.1.18.1. Company Overview
- 12.1.18.2. Products
- 12.1.18.3. Company Financials
- 12.1.18.4. SWOT Analysis
- 12.1.19 Hainayun
- 12.1.19.1. Company Overview
- 12.1.19.2. Products
- 12.1.19.3. Company Financials
- 12.1.19.4. SWOT Analysis
- 12.1.20 Wafer System
- 12.1.20.1. Company Overview
- 12.1.20.2. Products
- 12.1.20.3. Company Financials
- 12.1.20.4. SWOT Analysis
- 12.1.21 CMS Info Systems Limited
- 12.1.21.1. Company Overview
- 12.1.21.2. Products
- 12.1.21.3. Company Financials
- 12.1.21.4. SWOT Analysis
- 12.1.22 Innodisk Corporation
- 12.1.22.1. Company Overview
- 12.1.22.2. Products
- 12.1.22.3. Company Financials
- 12.1.22.4. SWOT Analysis
- 12.1.23 DAS Intellitech
- 12.1.23.1. Company Overview
- 12.1.23.2. Products
- 12.1.23.3. Company Financials
- 12.1.23.4. SWOT Analysis
- 12.1.1 IBM
- 12.2. Market Entropy
- 12.2.1 Company's Key Areas Served
- 12.2.2 Recent Developments
- 12.3. Company Market Share Analysis 2025
- 12.3.1 Top 5 Companies Market Share Analysis
- 12.3.2 Top 3 Companies Market Share Analysis
- 12.4. List of Potential Customers
- 13. Research Methodology
List of Figures
- Figure 1: Global AIoT Smart Management Solution Revenue Breakdown (billion, %) by Region 2025 & 2033
- Figure 2: North America AIoT Smart Management Solution Revenue (billion), by Application 2025 & 2033
- Figure 3: North America AIoT Smart Management Solution Revenue Share (%), by Application 2025 & 2033
- Figure 4: North America AIoT Smart Management Solution Revenue (billion), by Types 2025 & 2033
- Figure 5: North America AIoT Smart Management Solution Revenue Share (%), by Types 2025 & 2033
- Figure 6: North America AIoT Smart Management Solution Revenue (billion), by Country 2025 & 2033
- Figure 7: North America AIoT Smart Management Solution Revenue Share (%), by Country 2025 & 2033
- Figure 8: South America AIoT Smart Management Solution Revenue (billion), by Application 2025 & 2033
- Figure 9: South America AIoT Smart Management Solution Revenue Share (%), by Application 2025 & 2033
- Figure 10: South America AIoT Smart Management Solution Revenue (billion), by Types 2025 & 2033
- Figure 11: South America AIoT Smart Management Solution Revenue Share (%), by Types 2025 & 2033
- Figure 12: South America AIoT Smart Management Solution Revenue (billion), by Country 2025 & 2033
- Figure 13: South America AIoT Smart Management Solution Revenue Share (%), by Country 2025 & 2033
- Figure 14: Europe AIoT Smart Management Solution Revenue (billion), by Application 2025 & 2033
- Figure 15: Europe AIoT Smart Management Solution Revenue Share (%), by Application 2025 & 2033
- Figure 16: Europe AIoT Smart Management Solution Revenue (billion), by Types 2025 & 2033
- Figure 17: Europe AIoT Smart Management Solution Revenue Share (%), by Types 2025 & 2033
- Figure 18: Europe AIoT Smart Management Solution Revenue (billion), by Country 2025 & 2033
- Figure 19: Europe AIoT Smart Management Solution Revenue Share (%), by Country 2025 & 2033
- Figure 20: Middle East & Africa AIoT Smart Management Solution Revenue (billion), by Application 2025 & 2033
- Figure 21: Middle East & Africa AIoT Smart Management Solution Revenue Share (%), by Application 2025 & 2033
- Figure 22: Middle East & Africa AIoT Smart Management Solution Revenue (billion), by Types 2025 & 2033
- Figure 23: Middle East & Africa AIoT Smart Management Solution Revenue Share (%), by Types 2025 & 2033
- Figure 24: Middle East & Africa AIoT Smart Management Solution Revenue (billion), by Country 2025 & 2033
- Figure 25: Middle East & Africa AIoT Smart Management Solution Revenue Share (%), by Country 2025 & 2033
- Figure 26: Asia Pacific AIoT Smart Management Solution Revenue (billion), by Application 2025 & 2033
- Figure 27: Asia Pacific AIoT Smart Management Solution Revenue Share (%), by Application 2025 & 2033
- Figure 28: Asia Pacific AIoT Smart Management Solution Revenue (billion), by Types 2025 & 2033
- Figure 29: Asia Pacific AIoT Smart Management Solution Revenue Share (%), by Types 2025 & 2033
- Figure 30: Asia Pacific AIoT Smart Management Solution Revenue (billion), by Country 2025 & 2033
- Figure 31: Asia Pacific AIoT Smart Management Solution Revenue Share (%), by Country 2025 & 2033
List of Tables
- Table 1: Global AIoT Smart Management Solution Revenue billion Forecast, by Application 2020 & 2033
- Table 2: Global AIoT Smart Management Solution Revenue billion Forecast, by Types 2020 & 2033
- Table 3: Global AIoT Smart Management Solution Revenue billion Forecast, by Region 2020 & 2033
- Table 4: Global AIoT Smart Management Solution Revenue billion Forecast, by Application 2020 & 2033
- Table 5: Global AIoT Smart Management Solution Revenue billion Forecast, by Types 2020 & 2033
- Table 6: Global AIoT Smart Management Solution Revenue billion Forecast, by Country 2020 & 2033
- Table 7: United States AIoT Smart Management Solution Revenue (billion) Forecast, by Application 2020 & 2033
- Table 8: Canada AIoT Smart Management Solution Revenue (billion) Forecast, by Application 2020 & 2033
- Table 9: Mexico AIoT Smart Management Solution Revenue (billion) Forecast, by Application 2020 & 2033
- Table 10: Global AIoT Smart Management Solution Revenue billion Forecast, by Application 2020 & 2033
- Table 11: Global AIoT Smart Management Solution Revenue billion Forecast, by Types 2020 & 2033
- Table 12: Global AIoT Smart Management Solution Revenue billion Forecast, by Country 2020 & 2033
- Table 13: Brazil AIoT Smart Management Solution Revenue (billion) Forecast, by Application 2020 & 2033
- Table 14: Argentina AIoT Smart Management Solution Revenue (billion) Forecast, by Application 2020 & 2033
- Table 15: Rest of South America AIoT Smart Management Solution Revenue (billion) Forecast, by Application 2020 & 2033
- Table 16: Global AIoT Smart Management Solution Revenue billion Forecast, by Application 2020 & 2033
- Table 17: Global AIoT Smart Management Solution Revenue billion Forecast, by Types 2020 & 2033
- Table 18: Global AIoT Smart Management Solution Revenue billion Forecast, by Country 2020 & 2033
- Table 19: United Kingdom AIoT Smart Management Solution Revenue (billion) Forecast, by Application 2020 & 2033
- Table 20: Germany AIoT Smart Management Solution Revenue (billion) Forecast, by Application 2020 & 2033
- Table 21: France AIoT Smart Management Solution Revenue (billion) Forecast, by Application 2020 & 2033
- Table 22: Italy AIoT Smart Management Solution Revenue (billion) Forecast, by Application 2020 & 2033
- Table 23: Spain AIoT Smart Management Solution Revenue (billion) Forecast, by Application 2020 & 2033
- Table 24: Russia AIoT Smart Management Solution Revenue (billion) Forecast, by Application 2020 & 2033
- Table 25: Benelux AIoT Smart Management Solution Revenue (billion) Forecast, by Application 2020 & 2033
- Table 26: Nordics AIoT Smart Management Solution Revenue (billion) Forecast, by Application 2020 & 2033
- Table 27: Rest of Europe AIoT Smart Management Solution Revenue (billion) Forecast, by Application 2020 & 2033
- Table 28: Global AIoT Smart Management Solution Revenue billion Forecast, by Application 2020 & 2033
- Table 29: Global AIoT Smart Management Solution Revenue billion Forecast, by Types 2020 & 2033
- Table 30: Global AIoT Smart Management Solution Revenue billion Forecast, by Country 2020 & 2033
- Table 31: Turkey AIoT Smart Management Solution Revenue (billion) Forecast, by Application 2020 & 2033
- Table 32: Israel AIoT Smart Management Solution Revenue (billion) Forecast, by Application 2020 & 2033
- Table 33: GCC AIoT Smart Management Solution Revenue (billion) Forecast, by Application 2020 & 2033
- Table 34: North Africa AIoT Smart Management Solution Revenue (billion) Forecast, by Application 2020 & 2033
- Table 35: South Africa AIoT Smart Management Solution Revenue (billion) Forecast, by Application 2020 & 2033
- Table 36: Rest of Middle East & Africa AIoT Smart Management Solution Revenue (billion) Forecast, by Application 2020 & 2033
- Table 37: Global AIoT Smart Management Solution Revenue billion Forecast, by Application 2020 & 2033
- Table 38: Global AIoT Smart Management Solution Revenue billion Forecast, by Types 2020 & 2033
- Table 39: Global AIoT Smart Management Solution Revenue billion Forecast, by Country 2020 & 2033
- Table 40: China AIoT Smart Management Solution Revenue (billion) Forecast, by Application 2020 & 2033
- Table 41: India AIoT Smart Management Solution Revenue (billion) Forecast, by Application 2020 & 2033
- Table 42: Japan AIoT Smart Management Solution Revenue (billion) Forecast, by Application 2020 & 2033
- Table 43: South Korea AIoT Smart Management Solution Revenue (billion) Forecast, by Application 2020 & 2033
- Table 44: ASEAN AIoT Smart Management Solution Revenue (billion) Forecast, by Application 2020 & 2033
- Table 45: Oceania AIoT Smart Management Solution Revenue (billion) Forecast, by Application 2020 & 2033
- Table 46: Rest of Asia Pacific AIoT Smart Management Solution Revenue (billion) Forecast, by Application 2020 & 2033
Frequently Asked Questions
1. What is the projected Compound Annual Growth Rate (CAGR) of the AIoT Smart Management Solution?
The projected CAGR is approximately 8.23%.
2. Which companies are prominent players in the AIoT Smart Management Solution?
Key companies in the market include IBM, Huawei, Google, Bosch, ASUS, ADLINK Technology, Dahua Technology, Sharp, Axiomtek, SEMIFIVE, ThunderSoft, Milesight, Epichust, CloudWalk Technology, HuiLan, Kiwi technology Inc., Elink, Hailong Technology, Hainayun, Wafer System, CMS Info Systems Limited, Innodisk Corporation, DAS Intellitech.
3. What are the main segments of the AIoT Smart Management Solution?
The market segments include Application, Types.
4. Can you provide details about the market size?
The market size is estimated to be USD 5.62 billion as of 2022.
5. What are some drivers contributing to market growth?
N/A
6. What are the notable trends driving market growth?
N/A
7. Are there any restraints impacting market growth?
N/A
8. Can you provide examples of recent developments in the market?
N/A
9. What pricing options are available for accessing the report?
Pricing options include single-user, multi-user, and enterprise licenses priced at USD 4900.00, USD 7350.00, and USD 9800.00 respectively.
10. Is the market size provided in terms of value or volume?
The market size is provided in terms of value, measured in billion.
11. Are there any specific market keywords associated with the report?
Yes, the market keyword associated with the report is "AIoT Smart Management Solution," which aids in identifying and referencing the specific market segment covered.
12. How do I determine which pricing option suits my needs best?
The pricing options vary based on user requirements and access needs. Individual users may opt for single-user licenses, while businesses requiring broader access may choose multi-user or enterprise licenses for cost-effective access to the report.
13. Are there any additional resources or data provided in the AIoT Smart Management Solution report?
While the report offers comprehensive insights, it's advisable to review the specific contents or supplementary materials provided to ascertain if additional resources or data are available.
14. How can I stay updated on further developments or reports in the AIoT Smart Management Solution?
To stay informed about further developments, trends, and reports in the AIoT Smart Management Solution, consider subscribing to industry newsletters, following relevant companies and organizations, or regularly checking reputable industry news sources and publications.
Methodology
Step 1 - Identification of Relevant Samples Size from Population Database


Step 2 - Approaches for Defining Global Market Size (Value, Volume* & Price*)

Note*: In applicable scenarios
Step 3 - Data Sources
Primary Research
- Web Analytics
- Survey Reports
- Research Institute
- Latest Research Reports
- Opinion Leaders
Secondary Research
- Annual Reports
- White Paper
- Latest Press Release
- Industry Association
- Paid Database
- Investor Presentations

Step 4 - Data Triangulation
Involves using different sources of information in order to increase the validity of a study
These sources are likely to be stakeholders in a program - participants, other researchers, program staff, other community members, and so on.
Then we put all data in single framework & apply various statistical tools to find out the dynamic on the market.
During the analysis stage, feedback from the stakeholder groups would be compared to determine areas of agreement as well as areas of divergence