
Key Insights
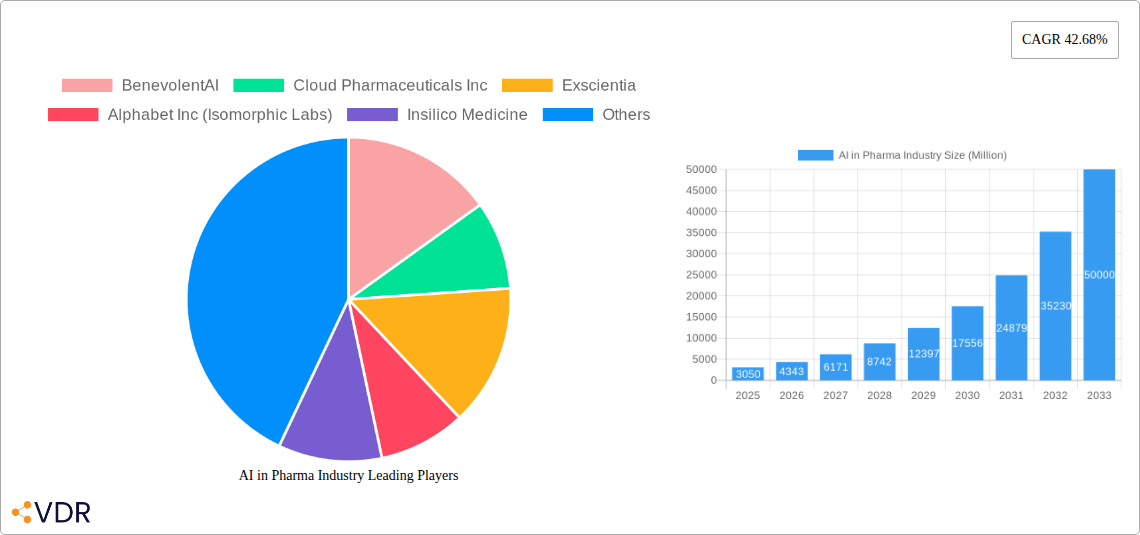
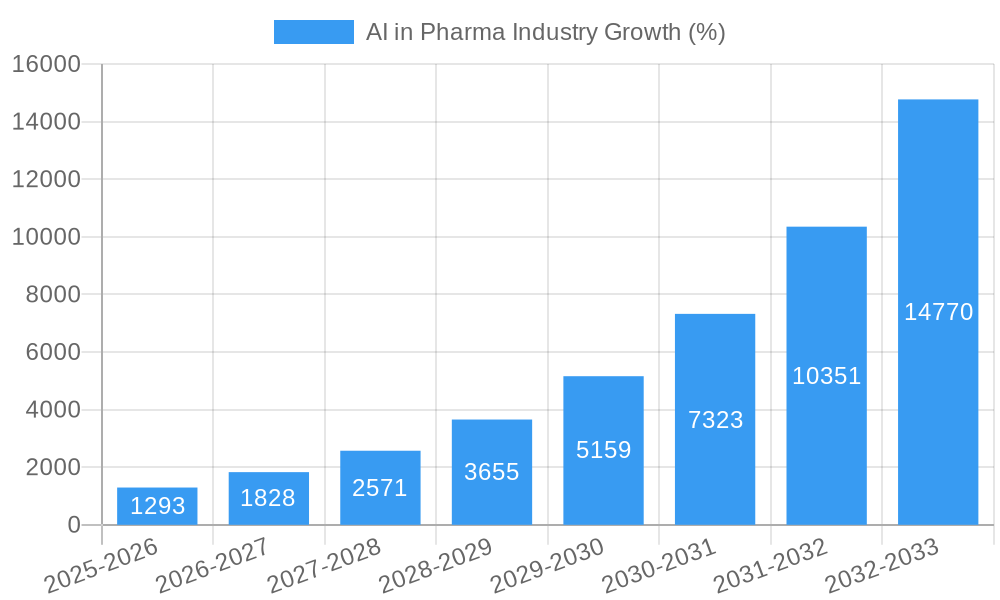
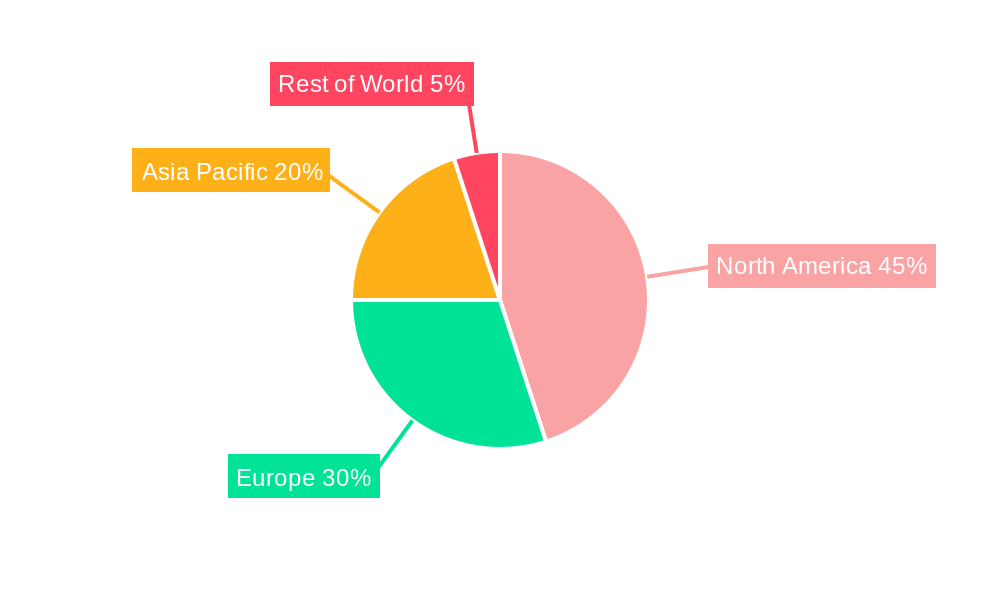
The AI in Pharma market is experiencing explosive growth, projected to reach \$3.05 billion in 2025 and exhibiting a remarkable Compound Annual Growth Rate (CAGR) of 42.68% from 2025 to 2033. This surge is driven by several key factors. Firstly, the increasing complexity of drug discovery and development necessitates advanced analytical tools, with AI offering unparalleled speed and accuracy in identifying potential drug candidates, optimizing clinical trials, and automating laboratory processes. Secondly, the rising volume of biological data generated through genomics and other technologies provides rich datasets for AI algorithms to learn from, leading to faster and more efficient drug development cycles. Thirdly, advancements in machine learning, deep learning, and natural language processing are continuously improving the capabilities of AI systems to tackle complex challenges within the pharmaceutical industry. The market segmentation reveals that software solutions are currently dominant, although the services segment is rapidly gaining ground. Applications span across drug discovery, clinical trials, and laboratory automation, signifying the widespread adoption of AI across various stages of the pharmaceutical value chain. North America currently holds a significant market share, driven by substantial investments in AI research and development and the presence of major pharmaceutical companies. However, Asia-Pacific is anticipated to witness robust growth due to rising healthcare expenditure and technological advancements within the region.
The competitive landscape is dynamic and characterized by both established pharmaceutical giants like Alphabet Inc. (Isomorphic Labs) and innovative startups such as BenevolentAI and Exscientia. These companies are actively developing and deploying AI-powered solutions to address various challenges within the drug discovery and development process. The market's future growth is likely to be influenced by factors such as increasing regulatory approvals for AI-driven therapeutics, the growing adoption of cloud-based AI solutions, and the continuous evolution of AI algorithms. Overcoming challenges such as data privacy concerns, the need for robust validation of AI models, and ensuring equitable access to these technologies will be crucial for realizing the full potential of AI in revolutionizing the pharmaceutical industry.
AI in Pharma Industry Market Report: 2019-2033
This comprehensive report provides a detailed analysis of the AI in Pharma industry, encompassing market dynamics, growth trends, regional segmentation, product landscape, and key players. With a study period spanning 2019-2033, a base year of 2025, and a forecast period of 2025-2033, this report offers invaluable insights for industry professionals, investors, and strategic decision-makers. The report analyzes the parent market of Pharmaceutical Industry and the child market of AI-powered Drug Discovery & Development. The market is expected to reach xx Million by 2033.
AI in Pharma Industry Market Dynamics & Structure
The AI in Pharma industry is experiencing rapid growth driven by technological advancements, increasing demand for faster and more efficient drug discovery processes, and supportive regulatory frameworks. The market exhibits a moderately concentrated structure with a few dominant players and several emerging companies. Significant M&A activity further shapes the competitive landscape.
- Market Concentration: The market is characterized by a mix of large established pharmaceutical companies and agile AI-focused startups, leading to a moderately concentrated structure. The top 5 companies hold approximately xx% of the market share in 2025.
- Technological Innovation: Machine learning (ML), deep learning, and natural language processing (NLP) are key technological drivers, fueling innovation in drug discovery, clinical trials, and regulatory compliance.
- Regulatory Frameworks: Regulatory bodies globally are actively engaging with AI adoption in pharmaceuticals, balancing innovation with safety and efficacy requirements. This leads to a dynamic regulatory environment.
- Competitive Product Substitutes: Traditional drug discovery methods remain prevalent, but AI-driven approaches are progressively gaining traction as a cost-effective and time-saving alternative.
- End-User Demographics: The primary end-users are pharmaceutical companies, CROs (Contract Research Organizations), and academic research institutions. Increasing involvement from smaller biotech firms is also observed.
- M&A Trends: The past few years have witnessed a surge in M&A activity, with larger pharmaceutical companies acquiring AI startups to bolster their R&D capabilities. The number of deals increased by xx% between 2021 and 2024.
AI in Pharma Industry Growth Trends & Insights
The AI in Pharma market exhibits robust growth, fueled by the convergence of advanced AI technologies and the unmet needs within the pharmaceutical sector. The market is witnessing an increasing adoption of AI solutions across various stages of drug development, from target identification to clinical trials. This trend is expected to continue throughout the forecast period. Driven by factors such as increasing R&D spending, rising prevalence of chronic diseases, and technological advancements, the market is predicted to register a CAGR of xx% from 2025 to 2033. Market penetration in drug discovery is expected to reach xx% by 2033. Key technology drivers include the application of machine learning algorithms to analyze vast datasets and predict potential drug candidates and the use of natural language processing to process scientific literature and identify potential drug targets. Consumer behaviour shifts are predominantly seen in increased willingness by the Pharma sector to embrace technological advancements, streamlining processes and improving outcomes.
Dominant Regions, Countries, or Segments in AI in Pharma Industry
North America currently dominates the AI in Pharma market, driven by a robust healthcare infrastructure, strong investment in R&D, and a high concentration of pharmaceutical companies and tech giants. However, the Asia-Pacific region is anticipated to witness substantial growth during the forecast period due to rising healthcare spending, increasing prevalence of chronic diseases, and growing adoption of AI technologies.
- Technology: Machine learning constitutes the largest segment within the technology category, while other emerging technologies are showing promising growth potential.
- Type: The software segment holds the highest market share, followed by services.
- Application: Drug discovery accounts for a substantial portion of the market, showcasing the transformative potential of AI in this critical area of pharmaceutical research. Clinical trials and laboratory automation are emerging as significant application segments.
Key Drivers:
- Strong government support and initiatives driving funding into the AI and healthcare domains.
- Presence of major pharmaceutical companies and AI tech firms fostering innovation and adoption.
- Well-established healthcare infrastructure facilitating easier integration of AI solutions.
AI in Pharma Industry Product Landscape
AI-powered solutions are revolutionizing the pharmaceutical industry, encompassing advanced software platforms for drug discovery, clinical trial optimization tools, and AI-driven laboratory automation systems. These tools are characterized by enhanced accuracy, speed, and efficiency compared to traditional methods. Many platforms incorporate unique selling propositions such as proprietary algorithms or large integrated datasets that enable superior predictions and faster development timelines. The technological advancements seen include the evolution towards more robust and explainable AI models, addressing some of the historic concerns about the "black box" nature of AI.
Key Drivers, Barriers & Challenges in AI in Pharma Industry
Key Drivers:
- The increasing need for faster and more cost-effective drug development.
- Technological breakthroughs in artificial intelligence and machine learning.
- Government initiatives and investments promoting AI adoption in healthcare.
Challenges & Restraints:
- Data privacy and security concerns: Protecting sensitive patient data is paramount, demanding robust security measures.
- Regulatory hurdles and compliance requirements: Navigating complex regulatory frameworks adds time and cost to development.
- Lack of skilled professionals: The need for specialized AI expertise creates a talent shortage, hindering industry growth. This talent shortage costs the industry an estimated xx million annually in lost productivity.
Emerging Opportunities in AI in Pharma Industry
- Expansion into underserved therapeutic areas: AI can accelerate drug discovery and development for neglected diseases.
- Personalized medicine: Tailoring treatments to individual patient characteristics presents a substantial market opportunity.
- AI-driven clinical trial design and optimization: Increasing the efficiency and reducing the costs associated with clinical trials.
Growth Accelerators in the AI in Pharma Industry Industry
Strategic partnerships between pharmaceutical companies and AI technology providers are pivotal for market expansion. Moreover, ongoing technological advancements, coupled with growing investments in R&D and increased funding from venture capitalists, are driving innovation and accelerating market growth. The ability to create faster and more efficient drug discovery pipelines provides considerable ROI incentives.
Key Players Shaping the AI in Pharma Industry Market
- BenevolentAI
- Cloud Pharmaceuticals Inc
- Exscientia
- Alphabet Inc (Isomorphic Labs)
- Insilico Medicine
- Atomwise Inc
- Deargen Inc
- XtalPi Inc
- Cyclica Inc
- Euretos
- Deep Genomics
- InveniAI LLC
Notable Milestones in AI in Pharma Industry Sector
- December 2022: Cyclica Inc and SK Chemicals Co., Ltd. partnered to develop AI-driven therapies.
- October 2022: Deerfield Management and BioSymetrics launched a joint venture focused on cardiovascular and neurological diseases using AI-powered target discovery.
In-Depth AI in Pharma Industry Market Outlook
The future of the AI in Pharma industry appears bright, with significant growth potential driven by continued technological innovation, strategic partnerships, and expanding applications. The market is expected to experience substantial growth, particularly in personalized medicine and the development of novel therapies for currently intractable diseases. Strategic acquisitions and the development of advanced AI algorithms will further contribute to market expansion. The long-term potential for AI to revolutionize drug discovery and development promises significant returns on investment for stakeholders.
AI in Pharma Industry Segmentation
-
1. Technology
- 1.1. Machine Learning
- 1.2. Other Technologies
-
2. Type
- 2.1. Software
- 2.2. Services
-
3. Application
- 3.1. Drug Discovery
- 3.2. Clinical Trial
- 3.3. Laboratory Automation
- 3.4. Other Applications
AI in Pharma Industry Segmentation By Geography
-
1. North America
- 1.1. United States
- 1.2. Canada
- 1.3. Mexico
-
2. Europe
- 2.1. Germany
- 2.2. United Kingdom
- 2.3. France
- 2.4. Italy
- 2.5. Spain
- 2.6. Rest of Europe
-
3. Asia Pacific
- 3.1. China
- 3.2. Japan
- 3.3. India
- 3.4. Australia
- 3.5. South Korea
- 3.6. Rest of Asia Pacific
-
4. Middle East and Africa
- 4.1. GCC
- 4.2. South Africa
- 4.3. Rest of Middle East and Africa
-
5. South America
- 5.1. Brazil
- 5.2. Argentina
- 5.3. Rest of South America
AI in Pharma Industry REPORT HIGHLIGHTS
| Aspects | Details |
|---|---|
| Study Period | 2019-2033 |
| Base Year | 2024 |
| Estimated Year | 2025 |
| Forecast Period | 2025-2033 |
| Historical Period | 2019-2024 |
| Growth Rate | CAGR of 42.68% from 2019-2033 |
| Segmentation |
|
Table of Contents
- 1. Introduction
- 1.1. Research Scope
- 1.2. Market Segmentation
- 1.3. Research Methodology
- 1.4. Definitions and Assumptions
- 2. Executive Summary
- 2.1. Introduction
- 3. Market Dynamics
- 3.1. Introduction
- 3.2. Market Drivers
- 3.2.1. Growing Number of Cross-industry Collaborations and Partnerships; Surge In Adoption of Artificial Intelligence (AI) for Clinical Trials; Increasing Need to Reduce Drug Discovery & Development Costs and Timelines
- 3.3. Market Restrains
- 3.3.1. Inadequate Availability of Skilled Professionals; Incompatible Healthcare IT Infrastructure
- 3.4. Market Trends
- 3.4.1. Drug Discovery Segment is Expected to Witness Significant Growth in the Market Over the Forecast Period
- 4. Market Factor Analysis
- 4.1. Porters Five Forces
- 4.2. Supply/Value Chain
- 4.3. PESTEL analysis
- 4.4. Market Entropy
- 4.5. Patent/Trademark Analysis
- 5. Global AI in Pharma Industry Analysis, Insights and Forecast, 2019-2031
- 5.1. Market Analysis, Insights and Forecast - by Technology
- 5.1.1. Machine Learning
- 5.1.2. Other Technologies
- 5.2. Market Analysis, Insights and Forecast - by Type
- 5.2.1. Software
- 5.2.2. Services
- 5.3. Market Analysis, Insights and Forecast - by Application
- 5.3.1. Drug Discovery
- 5.3.2. Clinical Trial
- 5.3.3. Laboratory Automation
- 5.3.4. Other Applications
- 5.4. Market Analysis, Insights and Forecast - by Region
- 5.4.1. North America
- 5.4.2. Europe
- 5.4.3. Asia Pacific
- 5.4.4. Middle East and Africa
- 5.4.5. South America
- 5.1. Market Analysis, Insights and Forecast - by Technology
- 6. North America AI in Pharma Industry Analysis, Insights and Forecast, 2019-2031
- 6.1. Market Analysis, Insights and Forecast - by Technology
- 6.1.1. Machine Learning
- 6.1.2. Other Technologies
- 6.2. Market Analysis, Insights and Forecast - by Type
- 6.2.1. Software
- 6.2.2. Services
- 6.3. Market Analysis, Insights and Forecast - by Application
- 6.3.1. Drug Discovery
- 6.3.2. Clinical Trial
- 6.3.3. Laboratory Automation
- 6.3.4. Other Applications
- 6.1. Market Analysis, Insights and Forecast - by Technology
- 7. Europe AI in Pharma Industry Analysis, Insights and Forecast, 2019-2031
- 7.1. Market Analysis, Insights and Forecast - by Technology
- 7.1.1. Machine Learning
- 7.1.2. Other Technologies
- 7.2. Market Analysis, Insights and Forecast - by Type
- 7.2.1. Software
- 7.2.2. Services
- 7.3. Market Analysis, Insights and Forecast - by Application
- 7.3.1. Drug Discovery
- 7.3.2. Clinical Trial
- 7.3.3. Laboratory Automation
- 7.3.4. Other Applications
- 7.1. Market Analysis, Insights and Forecast - by Technology
- 8. Asia Pacific AI in Pharma Industry Analysis, Insights and Forecast, 2019-2031
- 8.1. Market Analysis, Insights and Forecast - by Technology
- 8.1.1. Machine Learning
- 8.1.2. Other Technologies
- 8.2. Market Analysis, Insights and Forecast - by Type
- 8.2.1. Software
- 8.2.2. Services
- 8.3. Market Analysis, Insights and Forecast - by Application
- 8.3.1. Drug Discovery
- 8.3.2. Clinical Trial
- 8.3.3. Laboratory Automation
- 8.3.4. Other Applications
- 8.1. Market Analysis, Insights and Forecast - by Technology
- 9. Middle East and Africa AI in Pharma Industry Analysis, Insights and Forecast, 2019-2031
- 9.1. Market Analysis, Insights and Forecast - by Technology
- 9.1.1. Machine Learning
- 9.1.2. Other Technologies
- 9.2. Market Analysis, Insights and Forecast - by Type
- 9.2.1. Software
- 9.2.2. Services
- 9.3. Market Analysis, Insights and Forecast - by Application
- 9.3.1. Drug Discovery
- 9.3.2. Clinical Trial
- 9.3.3. Laboratory Automation
- 9.3.4. Other Applications
- 9.1. Market Analysis, Insights and Forecast - by Technology
- 10. South America AI in Pharma Industry Analysis, Insights and Forecast, 2019-2031
- 10.1. Market Analysis, Insights and Forecast - by Technology
- 10.1.1. Machine Learning
- 10.1.2. Other Technologies
- 10.2. Market Analysis, Insights and Forecast - by Type
- 10.2.1. Software
- 10.2.2. Services
- 10.3. Market Analysis, Insights and Forecast - by Application
- 10.3.1. Drug Discovery
- 10.3.2. Clinical Trial
- 10.3.3. Laboratory Automation
- 10.3.4. Other Applications
- 10.1. Market Analysis, Insights and Forecast - by Technology
- 11. North America AI in Pharma Industry Analysis, Insights and Forecast, 2019-2031
- 11.1. Market Analysis, Insights and Forecast - By Country/Sub-region
- 11.1.1 United States
- 11.1.2 Canada
- 11.1.3 Mexico
- 12. Europe AI in Pharma Industry Analysis, Insights and Forecast, 2019-2031
- 12.1. Market Analysis, Insights and Forecast - By Country/Sub-region
- 12.1.1 Germany
- 12.1.2 United Kingdom
- 12.1.3 France
- 12.1.4 Italy
- 12.1.5 Spain
- 12.1.6 Rest of Europe
- 13. Asia Pacific AI in Pharma Industry Analysis, Insights and Forecast, 2019-2031
- 13.1. Market Analysis, Insights and Forecast - By Country/Sub-region
- 13.1.1 China
- 13.1.2 Japan
- 13.1.3 India
- 13.1.4 Australia
- 13.1.5 South Korea
- 13.1.6 Rest of Asia Pacific
- 14. Middle East and Africa AI in Pharma Industry Analysis, Insights and Forecast, 2019-2031
- 14.1. Market Analysis, Insights and Forecast - By Country/Sub-region
- 14.1.1 GCC
- 14.1.2 South Africa
- 14.1.3 Rest of Middle East and Africa
- 15. South America AI in Pharma Industry Analysis, Insights and Forecast, 2019-2031
- 15.1. Market Analysis, Insights and Forecast - By Country/Sub-region
- 15.1.1 Brazil
- 15.1.2 Argentina
- 15.1.3 Rest of South America
- 16. Competitive Analysis
- 16.1. Global Market Share Analysis 2024
- 16.2. Company Profiles
- 16.2.1 BenevolentAI
- 16.2.1.1. Overview
- 16.2.1.2. Products
- 16.2.1.3. SWOT Analysis
- 16.2.1.4. Recent Developments
- 16.2.1.5. Financials (Based on Availability)
- 16.2.2 Cloud Pharmaceuticals Inc
- 16.2.2.1. Overview
- 16.2.2.2. Products
- 16.2.2.3. SWOT Analysis
- 16.2.2.4. Recent Developments
- 16.2.2.5. Financials (Based on Availability)
- 16.2.3 Exscientia
- 16.2.3.1. Overview
- 16.2.3.2. Products
- 16.2.3.3. SWOT Analysis
- 16.2.3.4. Recent Developments
- 16.2.3.5. Financials (Based on Availability)
- 16.2.4 Alphabet Inc (Isomorphic Labs)
- 16.2.4.1. Overview
- 16.2.4.2. Products
- 16.2.4.3. SWOT Analysis
- 16.2.4.4. Recent Developments
- 16.2.4.5. Financials (Based on Availability)
- 16.2.5 Insilico Medicine
- 16.2.5.1. Overview
- 16.2.5.2. Products
- 16.2.5.3. SWOT Analysis
- 16.2.5.4. Recent Developments
- 16.2.5.5. Financials (Based on Availability)
- 16.2.6 Atomwise Inc
- 16.2.6.1. Overview
- 16.2.6.2. Products
- 16.2.6.3. SWOT Analysis
- 16.2.6.4. Recent Developments
- 16.2.6.5. Financials (Based on Availability)
- 16.2.7 Deargen Inc
- 16.2.7.1. Overview
- 16.2.7.2. Products
- 16.2.7.3. SWOT Analysis
- 16.2.7.4. Recent Developments
- 16.2.7.5. Financials (Based on Availability)
- 16.2.8 XtalPi Inc
- 16.2.8.1. Overview
- 16.2.8.2. Products
- 16.2.8.3. SWOT Analysis
- 16.2.8.4. Recent Developments
- 16.2.8.5. Financials (Based on Availability)
- 16.2.9 Cyclica Inc
- 16.2.9.1. Overview
- 16.2.9.2. Products
- 16.2.9.3. SWOT Analysis
- 16.2.9.4. Recent Developments
- 16.2.9.5. Financials (Based on Availability)
- 16.2.10 Euretos
- 16.2.10.1. Overview
- 16.2.10.2. Products
- 16.2.10.3. SWOT Analysis
- 16.2.10.4. Recent Developments
- 16.2.10.5. Financials (Based on Availability)
- 16.2.11 Deep Genomics
- 16.2.11.1. Overview
- 16.2.11.2. Products
- 16.2.11.3. SWOT Analysis
- 16.2.11.4. Recent Developments
- 16.2.11.5. Financials (Based on Availability)
- 16.2.12 InveniAI LLC
- 16.2.12.1. Overview
- 16.2.12.2. Products
- 16.2.12.3. SWOT Analysis
- 16.2.12.4. Recent Developments
- 16.2.12.5. Financials (Based on Availability)
- 16.2.1 BenevolentAI
List of Figures
- Figure 1: Global AI in Pharma Industry Revenue Breakdown (Million, %) by Region 2024 & 2032
- Figure 2: Global AI in Pharma Industry Volume Breakdown (K Unit, %) by Region 2024 & 2032
- Figure 3: North America AI in Pharma Industry Revenue (Million), by Country 2024 & 2032
- Figure 4: North America AI in Pharma Industry Volume (K Unit), by Country 2024 & 2032
- Figure 5: North America AI in Pharma Industry Revenue Share (%), by Country 2024 & 2032
- Figure 6: North America AI in Pharma Industry Volume Share (%), by Country 2024 & 2032
- Figure 7: Europe AI in Pharma Industry Revenue (Million), by Country 2024 & 2032
- Figure 8: Europe AI in Pharma Industry Volume (K Unit), by Country 2024 & 2032
- Figure 9: Europe AI in Pharma Industry Revenue Share (%), by Country 2024 & 2032
- Figure 10: Europe AI in Pharma Industry Volume Share (%), by Country 2024 & 2032
- Figure 11: Asia Pacific AI in Pharma Industry Revenue (Million), by Country 2024 & 2032
- Figure 12: Asia Pacific AI in Pharma Industry Volume (K Unit), by Country 2024 & 2032
- Figure 13: Asia Pacific AI in Pharma Industry Revenue Share (%), by Country 2024 & 2032
- Figure 14: Asia Pacific AI in Pharma Industry Volume Share (%), by Country 2024 & 2032
- Figure 15: Middle East and Africa AI in Pharma Industry Revenue (Million), by Country 2024 & 2032
- Figure 16: Middle East and Africa AI in Pharma Industry Volume (K Unit), by Country 2024 & 2032
- Figure 17: Middle East and Africa AI in Pharma Industry Revenue Share (%), by Country 2024 & 2032
- Figure 18: Middle East and Africa AI in Pharma Industry Volume Share (%), by Country 2024 & 2032
- Figure 19: South America AI in Pharma Industry Revenue (Million), by Country 2024 & 2032
- Figure 20: South America AI in Pharma Industry Volume (K Unit), by Country 2024 & 2032
- Figure 21: South America AI in Pharma Industry Revenue Share (%), by Country 2024 & 2032
- Figure 22: South America AI in Pharma Industry Volume Share (%), by Country 2024 & 2032
- Figure 23: North America AI in Pharma Industry Revenue (Million), by Technology 2024 & 2032
- Figure 24: North America AI in Pharma Industry Volume (K Unit), by Technology 2024 & 2032
- Figure 25: North America AI in Pharma Industry Revenue Share (%), by Technology 2024 & 2032
- Figure 26: North America AI in Pharma Industry Volume Share (%), by Technology 2024 & 2032
- Figure 27: North America AI in Pharma Industry Revenue (Million), by Type 2024 & 2032
- Figure 28: North America AI in Pharma Industry Volume (K Unit), by Type 2024 & 2032
- Figure 29: North America AI in Pharma Industry Revenue Share (%), by Type 2024 & 2032
- Figure 30: North America AI in Pharma Industry Volume Share (%), by Type 2024 & 2032
- Figure 31: North America AI in Pharma Industry Revenue (Million), by Application 2024 & 2032
- Figure 32: North America AI in Pharma Industry Volume (K Unit), by Application 2024 & 2032
- Figure 33: North America AI in Pharma Industry Revenue Share (%), by Application 2024 & 2032
- Figure 34: North America AI in Pharma Industry Volume Share (%), by Application 2024 & 2032
- Figure 35: North America AI in Pharma Industry Revenue (Million), by Country 2024 & 2032
- Figure 36: North America AI in Pharma Industry Volume (K Unit), by Country 2024 & 2032
- Figure 37: North America AI in Pharma Industry Revenue Share (%), by Country 2024 & 2032
- Figure 38: North America AI in Pharma Industry Volume Share (%), by Country 2024 & 2032
- Figure 39: Europe AI in Pharma Industry Revenue (Million), by Technology 2024 & 2032
- Figure 40: Europe AI in Pharma Industry Volume (K Unit), by Technology 2024 & 2032
- Figure 41: Europe AI in Pharma Industry Revenue Share (%), by Technology 2024 & 2032
- Figure 42: Europe AI in Pharma Industry Volume Share (%), by Technology 2024 & 2032
- Figure 43: Europe AI in Pharma Industry Revenue (Million), by Type 2024 & 2032
- Figure 44: Europe AI in Pharma Industry Volume (K Unit), by Type 2024 & 2032
- Figure 45: Europe AI in Pharma Industry Revenue Share (%), by Type 2024 & 2032
- Figure 46: Europe AI in Pharma Industry Volume Share (%), by Type 2024 & 2032
- Figure 47: Europe AI in Pharma Industry Revenue (Million), by Application 2024 & 2032
- Figure 48: Europe AI in Pharma Industry Volume (K Unit), by Application 2024 & 2032
- Figure 49: Europe AI in Pharma Industry Revenue Share (%), by Application 2024 & 2032
- Figure 50: Europe AI in Pharma Industry Volume Share (%), by Application 2024 & 2032
- Figure 51: Europe AI in Pharma Industry Revenue (Million), by Country 2024 & 2032
- Figure 52: Europe AI in Pharma Industry Volume (K Unit), by Country 2024 & 2032
- Figure 53: Europe AI in Pharma Industry Revenue Share (%), by Country 2024 & 2032
- Figure 54: Europe AI in Pharma Industry Volume Share (%), by Country 2024 & 2032
- Figure 55: Asia Pacific AI in Pharma Industry Revenue (Million), by Technology 2024 & 2032
- Figure 56: Asia Pacific AI in Pharma Industry Volume (K Unit), by Technology 2024 & 2032
- Figure 57: Asia Pacific AI in Pharma Industry Revenue Share (%), by Technology 2024 & 2032
- Figure 58: Asia Pacific AI in Pharma Industry Volume Share (%), by Technology 2024 & 2032
- Figure 59: Asia Pacific AI in Pharma Industry Revenue (Million), by Type 2024 & 2032
- Figure 60: Asia Pacific AI in Pharma Industry Volume (K Unit), by Type 2024 & 2032
- Figure 61: Asia Pacific AI in Pharma Industry Revenue Share (%), by Type 2024 & 2032
- Figure 62: Asia Pacific AI in Pharma Industry Volume Share (%), by Type 2024 & 2032
- Figure 63: Asia Pacific AI in Pharma Industry Revenue (Million), by Application 2024 & 2032
- Figure 64: Asia Pacific AI in Pharma Industry Volume (K Unit), by Application 2024 & 2032
- Figure 65: Asia Pacific AI in Pharma Industry Revenue Share (%), by Application 2024 & 2032
- Figure 66: Asia Pacific AI in Pharma Industry Volume Share (%), by Application 2024 & 2032
- Figure 67: Asia Pacific AI in Pharma Industry Revenue (Million), by Country 2024 & 2032
- Figure 68: Asia Pacific AI in Pharma Industry Volume (K Unit), by Country 2024 & 2032
- Figure 69: Asia Pacific AI in Pharma Industry Revenue Share (%), by Country 2024 & 2032
- Figure 70: Asia Pacific AI in Pharma Industry Volume Share (%), by Country 2024 & 2032
- Figure 71: Middle East and Africa AI in Pharma Industry Revenue (Million), by Technology 2024 & 2032
- Figure 72: Middle East and Africa AI in Pharma Industry Volume (K Unit), by Technology 2024 & 2032
- Figure 73: Middle East and Africa AI in Pharma Industry Revenue Share (%), by Technology 2024 & 2032
- Figure 74: Middle East and Africa AI in Pharma Industry Volume Share (%), by Technology 2024 & 2032
- Figure 75: Middle East and Africa AI in Pharma Industry Revenue (Million), by Type 2024 & 2032
- Figure 76: Middle East and Africa AI in Pharma Industry Volume (K Unit), by Type 2024 & 2032
- Figure 77: Middle East and Africa AI in Pharma Industry Revenue Share (%), by Type 2024 & 2032
- Figure 78: Middle East and Africa AI in Pharma Industry Volume Share (%), by Type 2024 & 2032
- Figure 79: Middle East and Africa AI in Pharma Industry Revenue (Million), by Application 2024 & 2032
- Figure 80: Middle East and Africa AI in Pharma Industry Volume (K Unit), by Application 2024 & 2032
- Figure 81: Middle East and Africa AI in Pharma Industry Revenue Share (%), by Application 2024 & 2032
- Figure 82: Middle East and Africa AI in Pharma Industry Volume Share (%), by Application 2024 & 2032
- Figure 83: Middle East and Africa AI in Pharma Industry Revenue (Million), by Country 2024 & 2032
- Figure 84: Middle East and Africa AI in Pharma Industry Volume (K Unit), by Country 2024 & 2032
- Figure 85: Middle East and Africa AI in Pharma Industry Revenue Share (%), by Country 2024 & 2032
- Figure 86: Middle East and Africa AI in Pharma Industry Volume Share (%), by Country 2024 & 2032
- Figure 87: South America AI in Pharma Industry Revenue (Million), by Technology 2024 & 2032
- Figure 88: South America AI in Pharma Industry Volume (K Unit), by Technology 2024 & 2032
- Figure 89: South America AI in Pharma Industry Revenue Share (%), by Technology 2024 & 2032
- Figure 90: South America AI in Pharma Industry Volume Share (%), by Technology 2024 & 2032
- Figure 91: South America AI in Pharma Industry Revenue (Million), by Type 2024 & 2032
- Figure 92: South America AI in Pharma Industry Volume (K Unit), by Type 2024 & 2032
- Figure 93: South America AI in Pharma Industry Revenue Share (%), by Type 2024 & 2032
- Figure 94: South America AI in Pharma Industry Volume Share (%), by Type 2024 & 2032
- Figure 95: South America AI in Pharma Industry Revenue (Million), by Application 2024 & 2032
- Figure 96: South America AI in Pharma Industry Volume (K Unit), by Application 2024 & 2032
- Figure 97: South America AI in Pharma Industry Revenue Share (%), by Application 2024 & 2032
- Figure 98: South America AI in Pharma Industry Volume Share (%), by Application 2024 & 2032
- Figure 99: South America AI in Pharma Industry Revenue (Million), by Country 2024 & 2032
- Figure 100: South America AI in Pharma Industry Volume (K Unit), by Country 2024 & 2032
- Figure 101: South America AI in Pharma Industry Revenue Share (%), by Country 2024 & 2032
- Figure 102: South America AI in Pharma Industry Volume Share (%), by Country 2024 & 2032
List of Tables
- Table 1: Global AI in Pharma Industry Revenue Million Forecast, by Region 2019 & 2032
- Table 2: Global AI in Pharma Industry Volume K Unit Forecast, by Region 2019 & 2032
- Table 3: Global AI in Pharma Industry Revenue Million Forecast, by Technology 2019 & 2032
- Table 4: Global AI in Pharma Industry Volume K Unit Forecast, by Technology 2019 & 2032
- Table 5: Global AI in Pharma Industry Revenue Million Forecast, by Type 2019 & 2032
- Table 6: Global AI in Pharma Industry Volume K Unit Forecast, by Type 2019 & 2032
- Table 7: Global AI in Pharma Industry Revenue Million Forecast, by Application 2019 & 2032
- Table 8: Global AI in Pharma Industry Volume K Unit Forecast, by Application 2019 & 2032
- Table 9: Global AI in Pharma Industry Revenue Million Forecast, by Region 2019 & 2032
- Table 10: Global AI in Pharma Industry Volume K Unit Forecast, by Region 2019 & 2032
- Table 11: Global AI in Pharma Industry Revenue Million Forecast, by Country 2019 & 2032
- Table 12: Global AI in Pharma Industry Volume K Unit Forecast, by Country 2019 & 2032
- Table 13: United States AI in Pharma Industry Revenue (Million) Forecast, by Application 2019 & 2032
- Table 14: United States AI in Pharma Industry Volume (K Unit) Forecast, by Application 2019 & 2032
- Table 15: Canada AI in Pharma Industry Revenue (Million) Forecast, by Application 2019 & 2032
- Table 16: Canada AI in Pharma Industry Volume (K Unit) Forecast, by Application 2019 & 2032
- Table 17: Mexico AI in Pharma Industry Revenue (Million) Forecast, by Application 2019 & 2032
- Table 18: Mexico AI in Pharma Industry Volume (K Unit) Forecast, by Application 2019 & 2032
- Table 19: Global AI in Pharma Industry Revenue Million Forecast, by Country 2019 & 2032
- Table 20: Global AI in Pharma Industry Volume K Unit Forecast, by Country 2019 & 2032
- Table 21: Germany AI in Pharma Industry Revenue (Million) Forecast, by Application 2019 & 2032
- Table 22: Germany AI in Pharma Industry Volume (K Unit) Forecast, by Application 2019 & 2032
- Table 23: United Kingdom AI in Pharma Industry Revenue (Million) Forecast, by Application 2019 & 2032
- Table 24: United Kingdom AI in Pharma Industry Volume (K Unit) Forecast, by Application 2019 & 2032
- Table 25: France AI in Pharma Industry Revenue (Million) Forecast, by Application 2019 & 2032
- Table 26: France AI in Pharma Industry Volume (K Unit) Forecast, by Application 2019 & 2032
- Table 27: Italy AI in Pharma Industry Revenue (Million) Forecast, by Application 2019 & 2032
- Table 28: Italy AI in Pharma Industry Volume (K Unit) Forecast, by Application 2019 & 2032
- Table 29: Spain AI in Pharma Industry Revenue (Million) Forecast, by Application 2019 & 2032
- Table 30: Spain AI in Pharma Industry Volume (K Unit) Forecast, by Application 2019 & 2032
- Table 31: Rest of Europe AI in Pharma Industry Revenue (Million) Forecast, by Application 2019 & 2032
- Table 32: Rest of Europe AI in Pharma Industry Volume (K Unit) Forecast, by Application 2019 & 2032
- Table 33: Global AI in Pharma Industry Revenue Million Forecast, by Country 2019 & 2032
- Table 34: Global AI in Pharma Industry Volume K Unit Forecast, by Country 2019 & 2032
- Table 35: China AI in Pharma Industry Revenue (Million) Forecast, by Application 2019 & 2032
- Table 36: China AI in Pharma Industry Volume (K Unit) Forecast, by Application 2019 & 2032
- Table 37: Japan AI in Pharma Industry Revenue (Million) Forecast, by Application 2019 & 2032
- Table 38: Japan AI in Pharma Industry Volume (K Unit) Forecast, by Application 2019 & 2032
- Table 39: India AI in Pharma Industry Revenue (Million) Forecast, by Application 2019 & 2032
- Table 40: India AI in Pharma Industry Volume (K Unit) Forecast, by Application 2019 & 2032
- Table 41: Australia AI in Pharma Industry Revenue (Million) Forecast, by Application 2019 & 2032
- Table 42: Australia AI in Pharma Industry Volume (K Unit) Forecast, by Application 2019 & 2032
- Table 43: South Korea AI in Pharma Industry Revenue (Million) Forecast, by Application 2019 & 2032
- Table 44: South Korea AI in Pharma Industry Volume (K Unit) Forecast, by Application 2019 & 2032
- Table 45: Rest of Asia Pacific AI in Pharma Industry Revenue (Million) Forecast, by Application 2019 & 2032
- Table 46: Rest of Asia Pacific AI in Pharma Industry Volume (K Unit) Forecast, by Application 2019 & 2032
- Table 47: Global AI in Pharma Industry Revenue Million Forecast, by Country 2019 & 2032
- Table 48: Global AI in Pharma Industry Volume K Unit Forecast, by Country 2019 & 2032
- Table 49: GCC AI in Pharma Industry Revenue (Million) Forecast, by Application 2019 & 2032
- Table 50: GCC AI in Pharma Industry Volume (K Unit) Forecast, by Application 2019 & 2032
- Table 51: South Africa AI in Pharma Industry Revenue (Million) Forecast, by Application 2019 & 2032
- Table 52: South Africa AI in Pharma Industry Volume (K Unit) Forecast, by Application 2019 & 2032
- Table 53: Rest of Middle East and Africa AI in Pharma Industry Revenue (Million) Forecast, by Application 2019 & 2032
- Table 54: Rest of Middle East and Africa AI in Pharma Industry Volume (K Unit) Forecast, by Application 2019 & 2032
- Table 55: Global AI in Pharma Industry Revenue Million Forecast, by Country 2019 & 2032
- Table 56: Global AI in Pharma Industry Volume K Unit Forecast, by Country 2019 & 2032
- Table 57: Brazil AI in Pharma Industry Revenue (Million) Forecast, by Application 2019 & 2032
- Table 58: Brazil AI in Pharma Industry Volume (K Unit) Forecast, by Application 2019 & 2032
- Table 59: Argentina AI in Pharma Industry Revenue (Million) Forecast, by Application 2019 & 2032
- Table 60: Argentina AI in Pharma Industry Volume (K Unit) Forecast, by Application 2019 & 2032
- Table 61: Rest of South America AI in Pharma Industry Revenue (Million) Forecast, by Application 2019 & 2032
- Table 62: Rest of South America AI in Pharma Industry Volume (K Unit) Forecast, by Application 2019 & 2032
- Table 63: Global AI in Pharma Industry Revenue Million Forecast, by Technology 2019 & 2032
- Table 64: Global AI in Pharma Industry Volume K Unit Forecast, by Technology 2019 & 2032
- Table 65: Global AI in Pharma Industry Revenue Million Forecast, by Type 2019 & 2032
- Table 66: Global AI in Pharma Industry Volume K Unit Forecast, by Type 2019 & 2032
- Table 67: Global AI in Pharma Industry Revenue Million Forecast, by Application 2019 & 2032
- Table 68: Global AI in Pharma Industry Volume K Unit Forecast, by Application 2019 & 2032
- Table 69: Global AI in Pharma Industry Revenue Million Forecast, by Country 2019 & 2032
- Table 70: Global AI in Pharma Industry Volume K Unit Forecast, by Country 2019 & 2032
- Table 71: United States AI in Pharma Industry Revenue (Million) Forecast, by Application 2019 & 2032
- Table 72: United States AI in Pharma Industry Volume (K Unit) Forecast, by Application 2019 & 2032
- Table 73: Canada AI in Pharma Industry Revenue (Million) Forecast, by Application 2019 & 2032
- Table 74: Canada AI in Pharma Industry Volume (K Unit) Forecast, by Application 2019 & 2032
- Table 75: Mexico AI in Pharma Industry Revenue (Million) Forecast, by Application 2019 & 2032
- Table 76: Mexico AI in Pharma Industry Volume (K Unit) Forecast, by Application 2019 & 2032
- Table 77: Global AI in Pharma Industry Revenue Million Forecast, by Technology 2019 & 2032
- Table 78: Global AI in Pharma Industry Volume K Unit Forecast, by Technology 2019 & 2032
- Table 79: Global AI in Pharma Industry Revenue Million Forecast, by Type 2019 & 2032
- Table 80: Global AI in Pharma Industry Volume K Unit Forecast, by Type 2019 & 2032
- Table 81: Global AI in Pharma Industry Revenue Million Forecast, by Application 2019 & 2032
- Table 82: Global AI in Pharma Industry Volume K Unit Forecast, by Application 2019 & 2032
- Table 83: Global AI in Pharma Industry Revenue Million Forecast, by Country 2019 & 2032
- Table 84: Global AI in Pharma Industry Volume K Unit Forecast, by Country 2019 & 2032
- Table 85: Germany AI in Pharma Industry Revenue (Million) Forecast, by Application 2019 & 2032
- Table 86: Germany AI in Pharma Industry Volume (K Unit) Forecast, by Application 2019 & 2032
- Table 87: United Kingdom AI in Pharma Industry Revenue (Million) Forecast, by Application 2019 & 2032
- Table 88: United Kingdom AI in Pharma Industry Volume (K Unit) Forecast, by Application 2019 & 2032
- Table 89: France AI in Pharma Industry Revenue (Million) Forecast, by Application 2019 & 2032
- Table 90: France AI in Pharma Industry Volume (K Unit) Forecast, by Application 2019 & 2032
- Table 91: Italy AI in Pharma Industry Revenue (Million) Forecast, by Application 2019 & 2032
- Table 92: Italy AI in Pharma Industry Volume (K Unit) Forecast, by Application 2019 & 2032
- Table 93: Spain AI in Pharma Industry Revenue (Million) Forecast, by Application 2019 & 2032
- Table 94: Spain AI in Pharma Industry Volume (K Unit) Forecast, by Application 2019 & 2032
- Table 95: Rest of Europe AI in Pharma Industry Revenue (Million) Forecast, by Application 2019 & 2032
- Table 96: Rest of Europe AI in Pharma Industry Volume (K Unit) Forecast, by Application 2019 & 2032
- Table 97: Global AI in Pharma Industry Revenue Million Forecast, by Technology 2019 & 2032
- Table 98: Global AI in Pharma Industry Volume K Unit Forecast, by Technology 2019 & 2032
- Table 99: Global AI in Pharma Industry Revenue Million Forecast, by Type 2019 & 2032
- Table 100: Global AI in Pharma Industry Volume K Unit Forecast, by Type 2019 & 2032
- Table 101: Global AI in Pharma Industry Revenue Million Forecast, by Application 2019 & 2032
- Table 102: Global AI in Pharma Industry Volume K Unit Forecast, by Application 2019 & 2032
- Table 103: Global AI in Pharma Industry Revenue Million Forecast, by Country 2019 & 2032
- Table 104: Global AI in Pharma Industry Volume K Unit Forecast, by Country 2019 & 2032
- Table 105: China AI in Pharma Industry Revenue (Million) Forecast, by Application 2019 & 2032
- Table 106: China AI in Pharma Industry Volume (K Unit) Forecast, by Application 2019 & 2032
- Table 107: Japan AI in Pharma Industry Revenue (Million) Forecast, by Application 2019 & 2032
- Table 108: Japan AI in Pharma Industry Volume (K Unit) Forecast, by Application 2019 & 2032
- Table 109: India AI in Pharma Industry Revenue (Million) Forecast, by Application 2019 & 2032
- Table 110: India AI in Pharma Industry Volume (K Unit) Forecast, by Application 2019 & 2032
- Table 111: Australia AI in Pharma Industry Revenue (Million) Forecast, by Application 2019 & 2032
- Table 112: Australia AI in Pharma Industry Volume (K Unit) Forecast, by Application 2019 & 2032
- Table 113: South Korea AI in Pharma Industry Revenue (Million) Forecast, by Application 2019 & 2032
- Table 114: South Korea AI in Pharma Industry Volume (K Unit) Forecast, by Application 2019 & 2032
- Table 115: Rest of Asia Pacific AI in Pharma Industry Revenue (Million) Forecast, by Application 2019 & 2032
- Table 116: Rest of Asia Pacific AI in Pharma Industry Volume (K Unit) Forecast, by Application 2019 & 2032
- Table 117: Global AI in Pharma Industry Revenue Million Forecast, by Technology 2019 & 2032
- Table 118: Global AI in Pharma Industry Volume K Unit Forecast, by Technology 2019 & 2032
- Table 119: Global AI in Pharma Industry Revenue Million Forecast, by Type 2019 & 2032
- Table 120: Global AI in Pharma Industry Volume K Unit Forecast, by Type 2019 & 2032
- Table 121: Global AI in Pharma Industry Revenue Million Forecast, by Application 2019 & 2032
- Table 122: Global AI in Pharma Industry Volume K Unit Forecast, by Application 2019 & 2032
- Table 123: Global AI in Pharma Industry Revenue Million Forecast, by Country 2019 & 2032
- Table 124: Global AI in Pharma Industry Volume K Unit Forecast, by Country 2019 & 2032
- Table 125: GCC AI in Pharma Industry Revenue (Million) Forecast, by Application 2019 & 2032
- Table 126: GCC AI in Pharma Industry Volume (K Unit) Forecast, by Application 2019 & 2032
- Table 127: South Africa AI in Pharma Industry Revenue (Million) Forecast, by Application 2019 & 2032
- Table 128: South Africa AI in Pharma Industry Volume (K Unit) Forecast, by Application 2019 & 2032
- Table 129: Rest of Middle East and Africa AI in Pharma Industry Revenue (Million) Forecast, by Application 2019 & 2032
- Table 130: Rest of Middle East and Africa AI in Pharma Industry Volume (K Unit) Forecast, by Application 2019 & 2032
- Table 131: Global AI in Pharma Industry Revenue Million Forecast, by Technology 2019 & 2032
- Table 132: Global AI in Pharma Industry Volume K Unit Forecast, by Technology 2019 & 2032
- Table 133: Global AI in Pharma Industry Revenue Million Forecast, by Type 2019 & 2032
- Table 134: Global AI in Pharma Industry Volume K Unit Forecast, by Type 2019 & 2032
- Table 135: Global AI in Pharma Industry Revenue Million Forecast, by Application 2019 & 2032
- Table 136: Global AI in Pharma Industry Volume K Unit Forecast, by Application 2019 & 2032
- Table 137: Global AI in Pharma Industry Revenue Million Forecast, by Country 2019 & 2032
- Table 138: Global AI in Pharma Industry Volume K Unit Forecast, by Country 2019 & 2032
- Table 139: Brazil AI in Pharma Industry Revenue (Million) Forecast, by Application 2019 & 2032
- Table 140: Brazil AI in Pharma Industry Volume (K Unit) Forecast, by Application 2019 & 2032
- Table 141: Argentina AI in Pharma Industry Revenue (Million) Forecast, by Application 2019 & 2032
- Table 142: Argentina AI in Pharma Industry Volume (K Unit) Forecast, by Application 2019 & 2032
- Table 143: Rest of South America AI in Pharma Industry Revenue (Million) Forecast, by Application 2019 & 2032
- Table 144: Rest of South America AI in Pharma Industry Volume (K Unit) Forecast, by Application 2019 & 2032
Frequently Asked Questions
1. What is the projected Compound Annual Growth Rate (CAGR) of the AI in Pharma Industry?
The projected CAGR is approximately 42.68%.
2. Which companies are prominent players in the AI in Pharma Industry?
Key companies in the market include BenevolentAI, Cloud Pharmaceuticals Inc, Exscientia, Alphabet Inc (Isomorphic Labs), Insilico Medicine, Atomwise Inc, Deargen Inc, XtalPi Inc, Cyclica Inc, Euretos, Deep Genomics, InveniAI LLC.
3. What are the main segments of the AI in Pharma Industry?
The market segments include Technology, Type, Application.
4. Can you provide details about the market size?
The market size is estimated to be USD 3.05 Million as of 2022.
5. What are some drivers contributing to market growth?
Growing Number of Cross-industry Collaborations and Partnerships; Surge In Adoption of Artificial Intelligence (AI) for Clinical Trials; Increasing Need to Reduce Drug Discovery & Development Costs and Timelines.
6. What are the notable trends driving market growth?
Drug Discovery Segment is Expected to Witness Significant Growth in the Market Over the Forecast Period.
7. Are there any restraints impacting market growth?
Inadequate Availability of Skilled Professionals; Incompatible Healthcare IT Infrastructure.
8. Can you provide examples of recent developments in the market?
December 2022: Cyclica Inc and SK Chemicals Co., Ltd. entered an artificial intelligence (AI)-driven drug discovery and development partnership to develop therapies across a range of disease areas. Under the collaboration with SK Chemicals, Cyclica will deploy its robust, proprietary drug discovery platforms to identify novel drug candidates for challenging biological targets across therapeutic areas of mutual interest to Cyclica and SK Chemicals.
9. What pricing options are available for accessing the report?
Pricing options include single-user, multi-user, and enterprise licenses priced at USD 4750, USD 5250, and USD 8750 respectively.
10. Is the market size provided in terms of value or volume?
The market size is provided in terms of value, measured in Million and volume, measured in K Unit.
11. Are there any specific market keywords associated with the report?
Yes, the market keyword associated with the report is "AI in Pharma Industry," which aids in identifying and referencing the specific market segment covered.
12. How do I determine which pricing option suits my needs best?
The pricing options vary based on user requirements and access needs. Individual users may opt for single-user licenses, while businesses requiring broader access may choose multi-user or enterprise licenses for cost-effective access to the report.
13. Are there any additional resources or data provided in the AI in Pharma Industry report?
While the report offers comprehensive insights, it's advisable to review the specific contents or supplementary materials provided to ascertain if additional resources or data are available.
14. How can I stay updated on further developments or reports in the AI in Pharma Industry?
To stay informed about further developments, trends, and reports in the AI in Pharma Industry, consider subscribing to industry newsletters, following relevant companies and organizations, or regularly checking reputable industry news sources and publications.
Methodology
Step 1 - Identification of Relevant Samples Size from Population Database


Step 2 - Approaches for Defining Global Market Size (Value, Volume* & Price*)

Note*: In applicable scenarios
Step 3 - Data Sources
Primary Research
- Web Analytics
- Survey Reports
- Research Institute
- Latest Research Reports
- Opinion Leaders
Secondary Research
- Annual Reports
- White Paper
- Latest Press Release
- Industry Association
- Paid Database
- Investor Presentations

Step 4 - Data Triangulation
Involves using different sources of information in order to increase the validity of a study
These sources are likely to be stakeholders in a program - participants, other researchers, program staff, other community members, and so on.
Then we put all data in single framework & apply various statistical tools to find out the dynamic on the market.
During the analysis stage, feedback from the stakeholder groups would be compared to determine areas of agreement as well as areas of divergence


