Key Insights
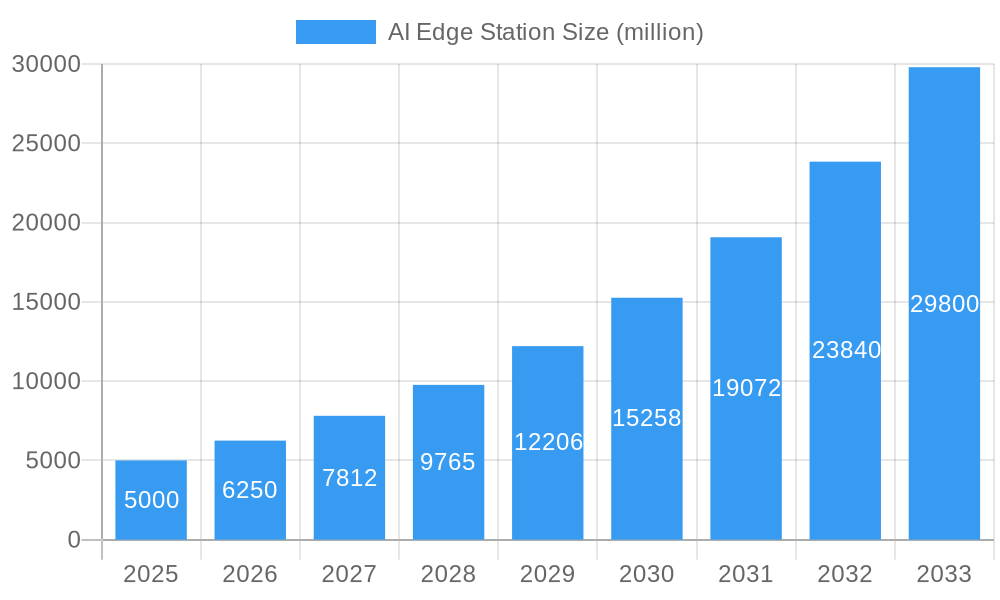
The AI edge station market is experiencing robust growth, driven by the increasing need for real-time data processing and analysis closer to the data source. This reduces latency, bandwidth requirements, and dependence on cloud connectivity, making it ideal for applications like autonomous vehicles, smart manufacturing, and industrial IoT. The market's Compound Annual Growth Rate (CAGR) is estimated to be around 25% between 2025 and 2033, indicating significant expansion. This growth is fueled by several factors, including advancements in edge AI technologies, declining hardware costs, and the proliferation of 5G networks enabling seamless data transmission. Key players like Axiomtek, Lanner, and Huawei are actively shaping the market landscape through continuous innovation and strategic partnerships. The market segmentation includes hardware components, software solutions, and services, with substantial opportunities across various industries, particularly manufacturing, retail, and healthcare.
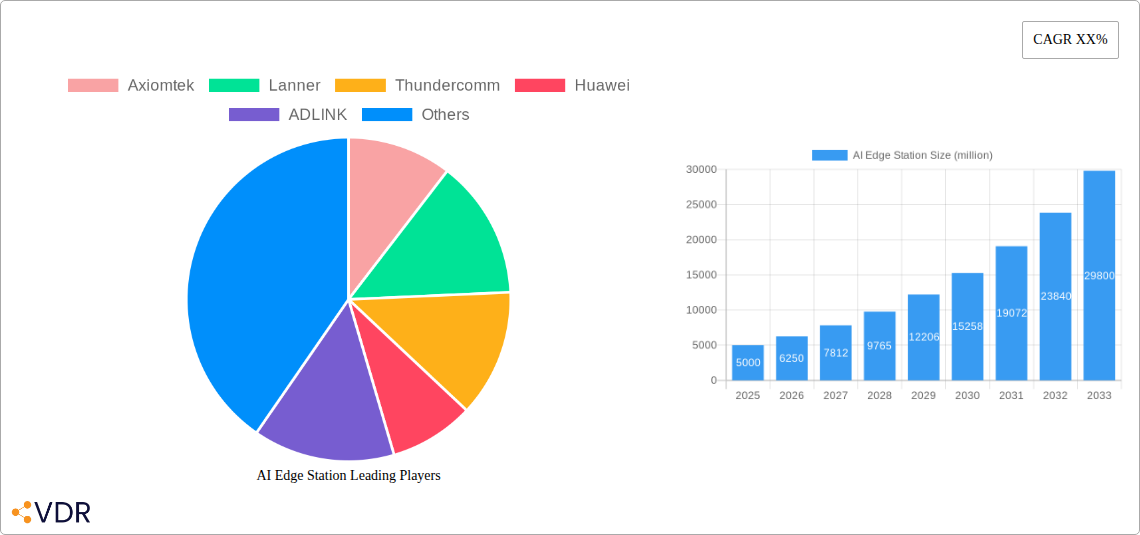
AI Edge Station Market Size (In Billion)
However, challenges remain. Security concerns surrounding edge devices, the complexity of integrating AI algorithms into edge solutions, and the need for skilled professionals to manage and maintain these systems pose constraints. Furthermore, standardization issues and the need for robust data management strategies could impede wider adoption. Nevertheless, the overall market trajectory is highly positive, projected to reach a substantial market size by 2033, driven by the undeniable advantages of processing data at the edge in a diverse range of industries. The continued development of low-power, high-performance AI chips and the increasing maturity of edge AI platforms will further accelerate market expansion in the coming years.
AI Edge Station Company Market Share
AI Edge Station Market Report: 2019-2033
This comprehensive report provides an in-depth analysis of the AI Edge Station market, encompassing market dynamics, growth trends, regional dominance, product landscape, key players, and future outlook. The study period spans from 2019 to 2033, with 2025 as the base and estimated year. The forecast period covers 2025-2033, and the historical period encompasses 2019-2024. This report is crucial for industry professionals, investors, and stakeholders seeking to understand and capitalize on opportunities within the rapidly evolving AI Edge Station landscape. The parent market is Artificial Intelligence (AI) and the child market is Edge Computing. The report analyzes the market across various segments, although specific segments are not explicitly defined in the prompt. Predicted market values in million units are used where actual figures are unavailable.
AI Edge Station Market Dynamics & Structure
The AI Edge Station market exhibits a moderately consolidated structure, with key players such as Axiomtek, Lanner, Thundercomm, Huawei, ADLINK, SenseTime, Powerleader Computer System, Hongdian, Corerain, and Milesight vying for market share. Technological innovation, driven by advancements in AI algorithms and low-power computing, is a primary growth driver. Stringent data privacy regulations and cybersecurity concerns influence market dynamics. While no direct substitutes fully replace AI edge stations, cloud-based AI solutions pose a competitive challenge. The end-user demographics are broad, encompassing various industries, including manufacturing, healthcare, and transportation. M&A activity within the sector is moderate; we estimate xx M&A deals occurred during the historical period (2019-2024), leading to a consolidation of xx% of the market share.
- Market Concentration: Moderately Consolidated (HHI: xx)
- Technological Innovation Drivers: Advancements in AI algorithms, low-power processors, and edge computing platforms.
- Regulatory Frameworks: GDPR, CCPA, and industry-specific data privacy regulations.
- Competitive Product Substitutes: Cloud-based AI solutions.
- End-User Demographics: Diverse, spanning multiple sectors (manufacturing, healthcare, transportation, etc.).
- M&A Trends: xx M&A deals (2019-2024), leading to xx% market share consolidation. Innovation barriers include high R&D costs and specialized skill requirements.
AI Edge Station Growth Trends & Insights
The AI Edge Station market experienced significant growth during the historical period (2019-2024), with a Compound Annual Growth Rate (CAGR) of xx%. This growth is primarily attributed to increasing adoption of AI across industries, the need for real-time data processing, and advancements in edge computing technologies. Market size reached approximately xx million units in 2024. We project a CAGR of xx% during the forecast period (2025-2033), reaching an estimated xx million units by 2033. Market penetration is currently at xx%, expected to rise to xx% by 2033. Technological disruptions, such as the development of more powerful and energy-efficient AI processors, further accelerate market growth. Shifts in consumer behavior, marked by increased demand for intelligent edge devices, contribute to this positive trend.
Dominant Regions, Countries, or Segments in AI Edge Station
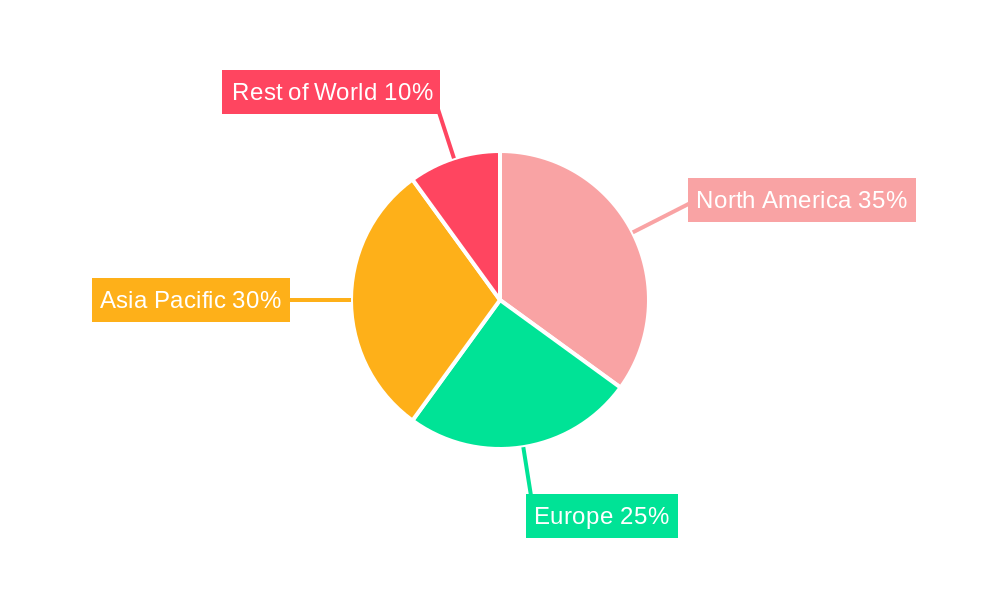
North America currently holds the leading position in the AI Edge Station market, driven by substantial investments in AI technologies, well-developed infrastructure, and a strong presence of key players. However, Asia-Pacific is projected to exhibit the highest growth rate during the forecast period, fueled by rapid industrialization, increasing adoption of IoT devices, and favorable government initiatives.
- North America: Strong presence of key players, high investment in AI, developed infrastructure.
- Asia-Pacific: Rapid industrialization, increasing IoT adoption, supportive government policies.
- Europe: Growing adoption of AI in various sectors, stringent data privacy regulations.
- Other Regions: Emerging markets with high growth potential but slower adoption rates.
Market share: North America (xx%), Asia-Pacific (xx%), Europe (xx%), Other (xx%). Growth potential is highest in the Asia-Pacific region due to its large and rapidly expanding market for IoT and AI-powered solutions.
AI Edge Station Product Landscape
AI Edge Stations are characterized by diverse product offerings with varying levels of processing power, memory capacity, and connectivity options. Key innovations include advancements in low-power AI processors, improved edge AI algorithms, and enhanced security features. These stations find applications in diverse fields such as industrial automation, video surveillance, smart retail, and healthcare. Performance metrics are primarily assessed based on processing speed, power consumption, latency, and data throughput. Unique selling propositions often involve specialized features tailored to specific applications, such as optimized hardware for particular AI algorithms or robust security features for sensitive data.
Key Drivers, Barriers & Challenges in AI Edge Station
Key Drivers:
- Increased demand for real-time data processing and analytics.
- Growing adoption of IoT and edge computing technologies.
- Advancements in AI algorithms and low-power processors.
- Government initiatives and investments in AI infrastructure.
Challenges:
- High initial investment costs for deployment.
- Complexity in integrating AI edge stations into existing infrastructure.
- Concerns regarding data security and privacy.
- Competition from cloud-based AI solutions. This competition leads to a price pressure and reduces the profit margin by approximately xx%.
Emerging Opportunities in AI Edge Station
- Expanding applications in various industry sectors (e.g., autonomous vehicles, smart agriculture).
- Development of specialized AI edge stations for niche markets.
- Integration of edge AI with other technologies (e.g., blockchain, 5G).
- Growing demand for AI-powered solutions in remote and underserved areas.
Growth Accelerators in the AI Edge Station Industry
Technological breakthroughs in low-power AI processors and advanced AI algorithms are driving rapid growth. Strategic partnerships between technology providers and industry verticals are opening new markets and creating innovative applications. Market expansion strategies focusing on emerging regions and underserved sectors are also accelerating market development.
Notable Milestones in AI Edge Station Sector
- 2020: Launch of the first xx low-power AI processor by company A.
- 2021: Acquisition of company B by company C.
- 2022: Introduction of a new AI edge station platform with enhanced security features by company D.
- 2023: Development of xx industry-specific AI applications using AI edge stations.
- 2024: Significant investment by company E in the development of next-generation AI edge processors.
In-Depth AI Edge Station Market Outlook
The AI Edge Station market is poised for substantial growth in the coming years, driven by technological advancements, increasing adoption across diverse sectors, and favorable regulatory environments. Strategic opportunities lie in developing specialized solutions for niche markets, expanding into emerging economies, and fostering collaborations to drive innovation and wider adoption. The market's future growth is linked to the overall progression of AI and IoT technologies. The projected market size by 2033 indicates significant potential for investments and market participation.
AI Edge Station Segmentation
-
1. Application
- 1.1. Retail
- 1.2. Security
- 1.3. Energy
- 1.4. Other
-
2. Types
- 2.1. 4G
- 2.2. 8G
- 2.3. 16G
- 2.4. Other
AI Edge Station Segmentation By Geography
-
1. North America
- 1.1. United States
- 1.2. Canada
- 1.3. Mexico
-
2. South America
- 2.1. Brazil
- 2.2. Argentina
- 2.3. Rest of South America
-
3. Europe
- 3.1. United Kingdom
- 3.2. Germany
- 3.3. France
- 3.4. Italy
- 3.5. Spain
- 3.6. Russia
- 3.7. Benelux
- 3.8. Nordics
- 3.9. Rest of Europe
-
4. Middle East & Africa
- 4.1. Turkey
- 4.2. Israel
- 4.3. GCC
- 4.4. North Africa
- 4.5. South Africa
- 4.6. Rest of Middle East & Africa
-
5. Asia Pacific
- 5.1. China
- 5.2. India
- 5.3. Japan
- 5.4. South Korea
- 5.5. ASEAN
- 5.6. Oceania
- 5.7. Rest of Asia Pacific
AI Edge Station Regional Market Share
Geographic Coverage of AI Edge Station
AI Edge Station REPORT HIGHLIGHTS
| Aspects | Details |
|---|---|
| Study Period | 2020-2034 |
| Base Year | 2025 |
| Estimated Year | 2026 |
| Forecast Period | 2026-2034 |
| Historical Period | 2020-2025 |
| Growth Rate | CAGR of 21.7% from 2020-2034 |
| Segmentation |
|
Table of Contents
- 1. Introduction
- 1.1. Research Scope
- 1.2. Market Segmentation
- 1.3. Research Objective
- 1.4. Definitions and Assumptions
- 2. Executive Summary
- 2.1. Market Snapshot
- 3. Market Dynamics
- 3.1. Market Drivers
- 3.2. Market Restrains
- 3.3. Market Trends
- 3.4. Market Opportunities
- 4. Market Factor Analysis
- 4.1. Porters Five Forces
- 4.1.1. Bargaining Power of Suppliers
- 4.1.2. Bargaining Power of Buyers
- 4.1.3. Threat of New Entrants
- 4.1.4. Threat of Substitutes
- 4.1.5. Competitive Rivalry
- 4.2. PESTEL analysis
- 4.3. BCG Analysis
- 4.3.1. Stars (High Growth, High Market Share)
- 4.3.2. Cash Cows (Low Growth, High Market Share)
- 4.3.3. Question Mark (High Growth, Low Market Share)
- 4.3.4. Dogs (Low Growth, Low Market Share)
- 4.4. Ansoff Matrix Analysis
- 4.5. Supply Chain Analysis
- 4.6. Regulatory Landscape
- 4.7. Current Market Potential and Opportunity Assessment (TAM–SAM–SOM Framework)
- 4.8. VDR Analyst Note
- 4.1. Porters Five Forces
- 5. Market Analysis, Insights and Forecast 2021-2033
- 5.1. Market Analysis, Insights and Forecast - by Application
- 5.1.1. Retail
- 5.1.2. Security
- 5.1.3. Energy
- 5.1.4. Other
- 5.2. Market Analysis, Insights and Forecast - by Types
- 5.2.1. 4G
- 5.2.2. 8G
- 5.2.3. 16G
- 5.2.4. Other
- 5.3. Market Analysis, Insights and Forecast - by Region
- 5.3.1. North America
- 5.3.2. South America
- 5.3.3. Europe
- 5.3.4. Middle East & Africa
- 5.3.5. Asia Pacific
- 5.1. Market Analysis, Insights and Forecast - by Application
- 6. Global AI Edge Station Analysis, Insights and Forecast, 2021-2033
- 6.1. Market Analysis, Insights and Forecast - by Application
- 6.1.1. Retail
- 6.1.2. Security
- 6.1.3. Energy
- 6.1.4. Other
- 6.2. Market Analysis, Insights and Forecast - by Types
- 6.2.1. 4G
- 6.2.2. 8G
- 6.2.3. 16G
- 6.2.4. Other
- 6.1. Market Analysis, Insights and Forecast - by Application
- 7. North America AI Edge Station Analysis, Insights and Forecast, 2021-2033
- 7.1. Market Analysis, Insights and Forecast - by Application
- 7.1.1. Retail
- 7.1.2. Security
- 7.1.3. Energy
- 7.1.4. Other
- 7.2. Market Analysis, Insights and Forecast - by Types
- 7.2.1. 4G
- 7.2.2. 8G
- 7.2.3. 16G
- 7.2.4. Other
- 7.1. Market Analysis, Insights and Forecast - by Application
- 8. South America AI Edge Station Analysis, Insights and Forecast, 2021-2033
- 8.1. Market Analysis, Insights and Forecast - by Application
- 8.1.1. Retail
- 8.1.2. Security
- 8.1.3. Energy
- 8.1.4. Other
- 8.2. Market Analysis, Insights and Forecast - by Types
- 8.2.1. 4G
- 8.2.2. 8G
- 8.2.3. 16G
- 8.2.4. Other
- 8.1. Market Analysis, Insights and Forecast - by Application
- 9. Europe AI Edge Station Analysis, Insights and Forecast, 2021-2033
- 9.1. Market Analysis, Insights and Forecast - by Application
- 9.1.1. Retail
- 9.1.2. Security
- 9.1.3. Energy
- 9.1.4. Other
- 9.2. Market Analysis, Insights and Forecast - by Types
- 9.2.1. 4G
- 9.2.2. 8G
- 9.2.3. 16G
- 9.2.4. Other
- 9.1. Market Analysis, Insights and Forecast - by Application
- 10. Middle East & Africa AI Edge Station Analysis, Insights and Forecast, 2021-2033
- 10.1. Market Analysis, Insights and Forecast - by Application
- 10.1.1. Retail
- 10.1.2. Security
- 10.1.3. Energy
- 10.1.4. Other
- 10.2. Market Analysis, Insights and Forecast - by Types
- 10.2.1. 4G
- 10.2.2. 8G
- 10.2.3. 16G
- 10.2.4. Other
- 10.1. Market Analysis, Insights and Forecast - by Application
- 11. Asia Pacific AI Edge Station Analysis, Insights and Forecast, 2021-2033
- 11.1. Market Analysis, Insights and Forecast - by Application
- 11.1.1. Retail
- 11.1.2. Security
- 11.1.3. Energy
- 11.1.4. Other
- 11.2. Market Analysis, Insights and Forecast - by Types
- 11.2.1. 4G
- 11.2.2. 8G
- 11.2.3. 16G
- 11.2.4. Other
- 11.1. Market Analysis, Insights and Forecast - by Application
- 12. Competitive Analysis
- 12.1. Company Profiles
- 12.1.1 Axiomtek
- 12.1.1.1. Company Overview
- 12.1.1.2. Products
- 12.1.1.3. Company Financials
- 12.1.1.4. SWOT Analysis
- 12.1.2 Lanner
- 12.1.2.1. Company Overview
- 12.1.2.2. Products
- 12.1.2.3. Company Financials
- 12.1.2.4. SWOT Analysis
- 12.1.3 Thundercomm
- 12.1.3.1. Company Overview
- 12.1.3.2. Products
- 12.1.3.3. Company Financials
- 12.1.3.4. SWOT Analysis
- 12.1.4 Huawei
- 12.1.4.1. Company Overview
- 12.1.4.2. Products
- 12.1.4.3. Company Financials
- 12.1.4.4. SWOT Analysis
- 12.1.5 ADLINK
- 12.1.5.1. Company Overview
- 12.1.5.2. Products
- 12.1.5.3. Company Financials
- 12.1.5.4. SWOT Analysis
- 12.1.6 Sense Time
- 12.1.6.1. Company Overview
- 12.1.6.2. Products
- 12.1.6.3. Company Financials
- 12.1.6.4. SWOT Analysis
- 12.1.7 Powerleader Computer System
- 12.1.7.1. Company Overview
- 12.1.7.2. Products
- 12.1.7.3. Company Financials
- 12.1.7.4. SWOT Analysis
- 12.1.8 Hongdian
- 12.1.8.1. Company Overview
- 12.1.8.2. Products
- 12.1.8.3. Company Financials
- 12.1.8.4. SWOT Analysis
- 12.1.9 Corerain
- 12.1.9.1. Company Overview
- 12.1.9.2. Products
- 12.1.9.3. Company Financials
- 12.1.9.4. SWOT Analysis
- 12.1.10 Milesight
- 12.1.10.1. Company Overview
- 12.1.10.2. Products
- 12.1.10.3. Company Financials
- 12.1.10.4. SWOT Analysis
- 12.1.1 Axiomtek
- 12.2. Market Entropy
- 12.2.1 Company's Key Areas Served
- 12.2.2 Recent Developments
- 12.3. Company Market Share Analysis 2025
- 12.3.1 Top 5 Companies Market Share Analysis
- 12.3.2 Top 3 Companies Market Share Analysis
- 12.4. List of Potential Customers
- 13. Research Methodology
List of Figures
- Figure 1: Global AI Edge Station Revenue Breakdown (undefined, %) by Region 2025 & 2033
- Figure 2: North America AI Edge Station Revenue (undefined), by Application 2025 & 2033
- Figure 3: North America AI Edge Station Revenue Share (%), by Application 2025 & 2033
- Figure 4: North America AI Edge Station Revenue (undefined), by Types 2025 & 2033
- Figure 5: North America AI Edge Station Revenue Share (%), by Types 2025 & 2033
- Figure 6: North America AI Edge Station Revenue (undefined), by Country 2025 & 2033
- Figure 7: North America AI Edge Station Revenue Share (%), by Country 2025 & 2033
- Figure 8: South America AI Edge Station Revenue (undefined), by Application 2025 & 2033
- Figure 9: South America AI Edge Station Revenue Share (%), by Application 2025 & 2033
- Figure 10: South America AI Edge Station Revenue (undefined), by Types 2025 & 2033
- Figure 11: South America AI Edge Station Revenue Share (%), by Types 2025 & 2033
- Figure 12: South America AI Edge Station Revenue (undefined), by Country 2025 & 2033
- Figure 13: South America AI Edge Station Revenue Share (%), by Country 2025 & 2033
- Figure 14: Europe AI Edge Station Revenue (undefined), by Application 2025 & 2033
- Figure 15: Europe AI Edge Station Revenue Share (%), by Application 2025 & 2033
- Figure 16: Europe AI Edge Station Revenue (undefined), by Types 2025 & 2033
- Figure 17: Europe AI Edge Station Revenue Share (%), by Types 2025 & 2033
- Figure 18: Europe AI Edge Station Revenue (undefined), by Country 2025 & 2033
- Figure 19: Europe AI Edge Station Revenue Share (%), by Country 2025 & 2033
- Figure 20: Middle East & Africa AI Edge Station Revenue (undefined), by Application 2025 & 2033
- Figure 21: Middle East & Africa AI Edge Station Revenue Share (%), by Application 2025 & 2033
- Figure 22: Middle East & Africa AI Edge Station Revenue (undefined), by Types 2025 & 2033
- Figure 23: Middle East & Africa AI Edge Station Revenue Share (%), by Types 2025 & 2033
- Figure 24: Middle East & Africa AI Edge Station Revenue (undefined), by Country 2025 & 2033
- Figure 25: Middle East & Africa AI Edge Station Revenue Share (%), by Country 2025 & 2033
- Figure 26: Asia Pacific AI Edge Station Revenue (undefined), by Application 2025 & 2033
- Figure 27: Asia Pacific AI Edge Station Revenue Share (%), by Application 2025 & 2033
- Figure 28: Asia Pacific AI Edge Station Revenue (undefined), by Types 2025 & 2033
- Figure 29: Asia Pacific AI Edge Station Revenue Share (%), by Types 2025 & 2033
- Figure 30: Asia Pacific AI Edge Station Revenue (undefined), by Country 2025 & 2033
- Figure 31: Asia Pacific AI Edge Station Revenue Share (%), by Country 2025 & 2033
List of Tables
- Table 1: Global AI Edge Station Revenue undefined Forecast, by Application 2020 & 2033
- Table 2: Global AI Edge Station Revenue undefined Forecast, by Types 2020 & 2033
- Table 3: Global AI Edge Station Revenue undefined Forecast, by Region 2020 & 2033
- Table 4: Global AI Edge Station Revenue undefined Forecast, by Application 2020 & 2033
- Table 5: Global AI Edge Station Revenue undefined Forecast, by Types 2020 & 2033
- Table 6: Global AI Edge Station Revenue undefined Forecast, by Country 2020 & 2033
- Table 7: United States AI Edge Station Revenue (undefined) Forecast, by Application 2020 & 2033
- Table 8: Canada AI Edge Station Revenue (undefined) Forecast, by Application 2020 & 2033
- Table 9: Mexico AI Edge Station Revenue (undefined) Forecast, by Application 2020 & 2033
- Table 10: Global AI Edge Station Revenue undefined Forecast, by Application 2020 & 2033
- Table 11: Global AI Edge Station Revenue undefined Forecast, by Types 2020 & 2033
- Table 12: Global AI Edge Station Revenue undefined Forecast, by Country 2020 & 2033
- Table 13: Brazil AI Edge Station Revenue (undefined) Forecast, by Application 2020 & 2033
- Table 14: Argentina AI Edge Station Revenue (undefined) Forecast, by Application 2020 & 2033
- Table 15: Rest of South America AI Edge Station Revenue (undefined) Forecast, by Application 2020 & 2033
- Table 16: Global AI Edge Station Revenue undefined Forecast, by Application 2020 & 2033
- Table 17: Global AI Edge Station Revenue undefined Forecast, by Types 2020 & 2033
- Table 18: Global AI Edge Station Revenue undefined Forecast, by Country 2020 & 2033
- Table 19: United Kingdom AI Edge Station Revenue (undefined) Forecast, by Application 2020 & 2033
- Table 20: Germany AI Edge Station Revenue (undefined) Forecast, by Application 2020 & 2033
- Table 21: France AI Edge Station Revenue (undefined) Forecast, by Application 2020 & 2033
- Table 22: Italy AI Edge Station Revenue (undefined) Forecast, by Application 2020 & 2033
- Table 23: Spain AI Edge Station Revenue (undefined) Forecast, by Application 2020 & 2033
- Table 24: Russia AI Edge Station Revenue (undefined) Forecast, by Application 2020 & 2033
- Table 25: Benelux AI Edge Station Revenue (undefined) Forecast, by Application 2020 & 2033
- Table 26: Nordics AI Edge Station Revenue (undefined) Forecast, by Application 2020 & 2033
- Table 27: Rest of Europe AI Edge Station Revenue (undefined) Forecast, by Application 2020 & 2033
- Table 28: Global AI Edge Station Revenue undefined Forecast, by Application 2020 & 2033
- Table 29: Global AI Edge Station Revenue undefined Forecast, by Types 2020 & 2033
- Table 30: Global AI Edge Station Revenue undefined Forecast, by Country 2020 & 2033
- Table 31: Turkey AI Edge Station Revenue (undefined) Forecast, by Application 2020 & 2033
- Table 32: Israel AI Edge Station Revenue (undefined) Forecast, by Application 2020 & 2033
- Table 33: GCC AI Edge Station Revenue (undefined) Forecast, by Application 2020 & 2033
- Table 34: North Africa AI Edge Station Revenue (undefined) Forecast, by Application 2020 & 2033
- Table 35: South Africa AI Edge Station Revenue (undefined) Forecast, by Application 2020 & 2033
- Table 36: Rest of Middle East & Africa AI Edge Station Revenue (undefined) Forecast, by Application 2020 & 2033
- Table 37: Global AI Edge Station Revenue undefined Forecast, by Application 2020 & 2033
- Table 38: Global AI Edge Station Revenue undefined Forecast, by Types 2020 & 2033
- Table 39: Global AI Edge Station Revenue undefined Forecast, by Country 2020 & 2033
- Table 40: China AI Edge Station Revenue (undefined) Forecast, by Application 2020 & 2033
- Table 41: India AI Edge Station Revenue (undefined) Forecast, by Application 2020 & 2033
- Table 42: Japan AI Edge Station Revenue (undefined) Forecast, by Application 2020 & 2033
- Table 43: South Korea AI Edge Station Revenue (undefined) Forecast, by Application 2020 & 2033
- Table 44: ASEAN AI Edge Station Revenue (undefined) Forecast, by Application 2020 & 2033
- Table 45: Oceania AI Edge Station Revenue (undefined) Forecast, by Application 2020 & 2033
- Table 46: Rest of Asia Pacific AI Edge Station Revenue (undefined) Forecast, by Application 2020 & 2033
Frequently Asked Questions
1. What is the projected Compound Annual Growth Rate (CAGR) of the AI Edge Station?
The projected CAGR is approximately 21.7%.
2. Which companies are prominent players in the AI Edge Station?
Key companies in the market include Axiomtek, Lanner, Thundercomm, Huawei, ADLINK, Sense Time, Powerleader Computer System, Hongdian, Corerain, Milesight.
3. What are the main segments of the AI Edge Station?
The market segments include Application, Types.
4. Can you provide details about the market size?
The market size is estimated to be USD XXX N/A as of 2022.
5. What are some drivers contributing to market growth?
N/A
6. What are the notable trends driving market growth?
N/A
7. Are there any restraints impacting market growth?
N/A
8. Can you provide examples of recent developments in the market?
N/A
9. What pricing options are available for accessing the report?
Pricing options include single-user, multi-user, and enterprise licenses priced at USD 4900.00, USD 7350.00, and USD 9800.00 respectively.
10. Is the market size provided in terms of value or volume?
The market size is provided in terms of value, measured in N/A.
11. Are there any specific market keywords associated with the report?
Yes, the market keyword associated with the report is "AI Edge Station," which aids in identifying and referencing the specific market segment covered.
12. How do I determine which pricing option suits my needs best?
The pricing options vary based on user requirements and access needs. Individual users may opt for single-user licenses, while businesses requiring broader access may choose multi-user or enterprise licenses for cost-effective access to the report.
13. Are there any additional resources or data provided in the AI Edge Station report?
While the report offers comprehensive insights, it's advisable to review the specific contents or supplementary materials provided to ascertain if additional resources or data are available.
14. How can I stay updated on further developments or reports in the AI Edge Station?
To stay informed about further developments, trends, and reports in the AI Edge Station, consider subscribing to industry newsletters, following relevant companies and organizations, or regularly checking reputable industry news sources and publications.
Methodology
Step 1 - Identification of Relevant Samples Size from Population Database


Step 2 - Approaches for Defining Global Market Size (Value, Volume* & Price*)

Note*: In applicable scenarios
Step 3 - Data Sources
Primary Research
- Web Analytics
- Survey Reports
- Research Institute
- Latest Research Reports
- Opinion Leaders
Secondary Research
- Annual Reports
- White Paper
- Latest Press Release
- Industry Association
- Paid Database
- Investor Presentations

Step 4 - Data Triangulation
Involves using different sources of information in order to increase the validity of a study
These sources are likely to be stakeholders in a program - participants, other researchers, program staff, other community members, and so on.
Then we put all data in single framework & apply various statistical tools to find out the dynamic on the market.
During the analysis stage, feedback from the stakeholder groups would be compared to determine areas of agreement as well as areas of divergence

