

Key Insights
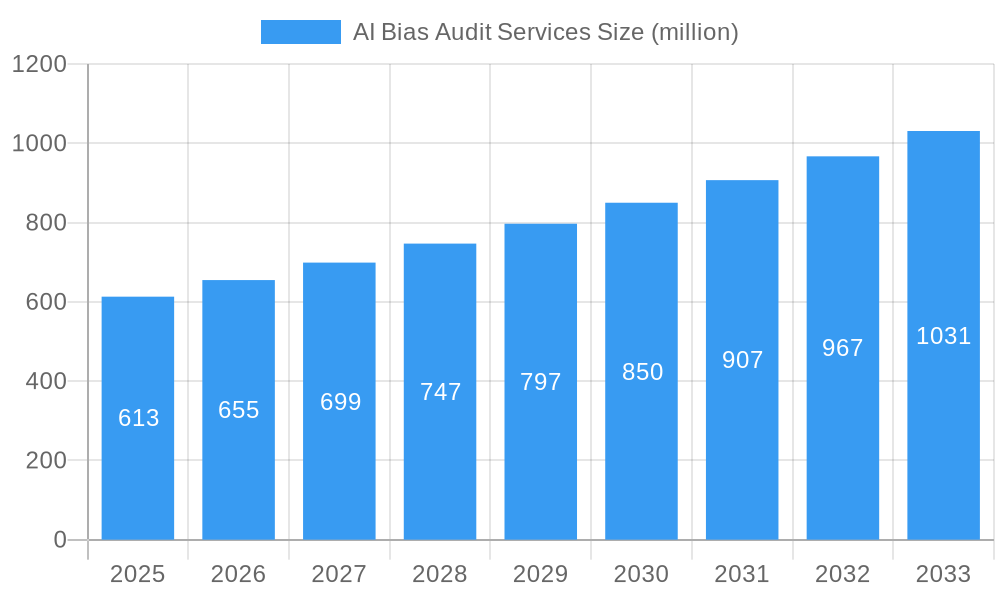
The AI Bias Audit Services market, currently valued at $613 million in 2025, is projected to experience robust growth, driven by increasing awareness of algorithmic bias and the growing demand for fairness and accountability in AI systems across various sectors. The 6.7% CAGR indicates a steady expansion over the forecast period (2025-2033), fueled by stringent regulations regarding AI ethics and the rising adoption of AI in critical decision-making processes like hiring, loan applications, and criminal justice. Key drivers include the increasing sophistication of AI algorithms, leading to more complex biases that require specialized auditing services, and a growing understanding among businesses of the reputational and financial risks associated with biased AI. The market is segmented by service type (e.g., data bias audits, model bias audits, impact assessments), industry (e.g., finance, healthcare, technology), and deployment model (cloud, on-premises). Leading companies like Resolution Economics, Mosaic Data Science, and Kanarys are shaping the market landscape through innovative solutions and expanding service offerings. While the market faces restraints such as the high cost of audits and a shortage of skilled professionals, the long-term outlook remains positive due to increased regulatory scrutiny and corporate social responsibility initiatives.
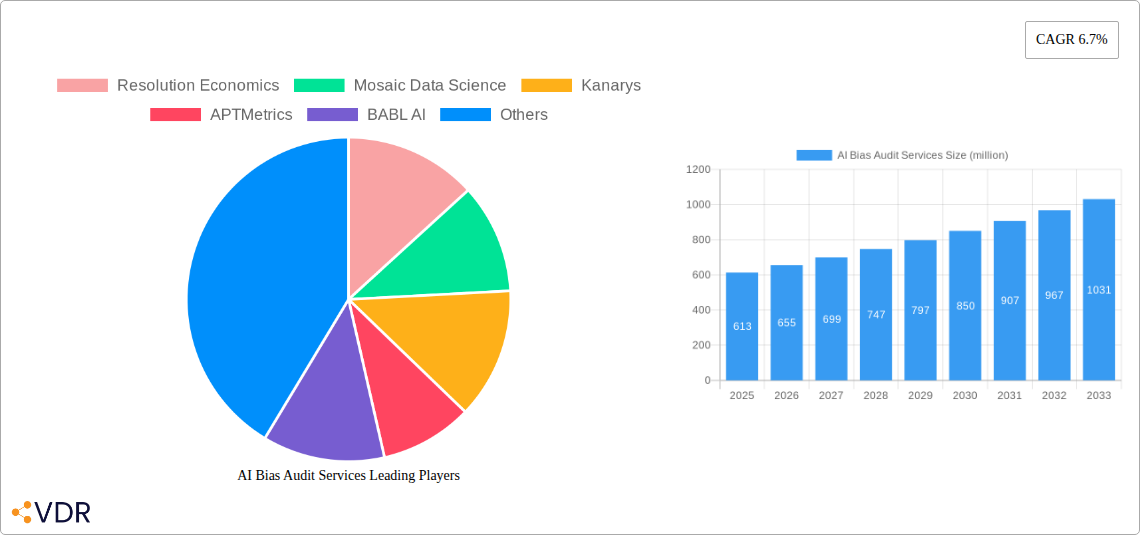
AI Bias Audit Services Market Size (In Million)
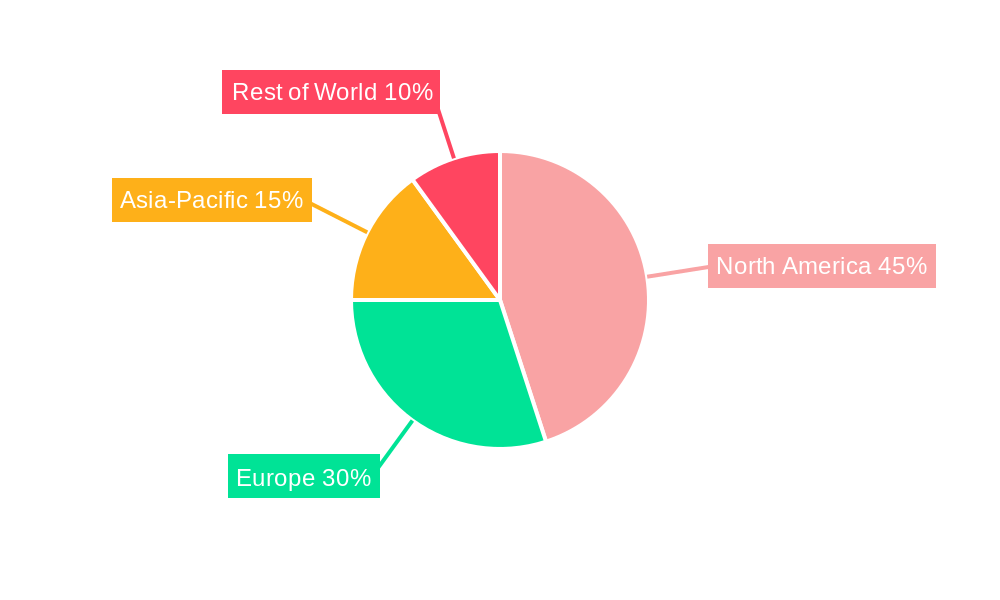
The market's growth trajectory suggests significant opportunities for existing players and new entrants. Companies are increasingly investing in R&D to develop advanced techniques for detecting and mitigating bias, while also focusing on partnerships to broaden their reach and service offerings. The North American market is expected to dominate initially due to early adoption and stringent regulations. However, Europe and Asia-Pacific are anticipated to witness significant growth in the coming years driven by increasing AI adoption and growing regulatory frameworks. Overall, the AI Bias Audit Services market is poised for substantial expansion, driven by the crucial need for ethical and unbiased AI across all industries.
AI Bias Audit Services Company Market Share
AI Bias Audit Services Market Report: 2019-2033
This comprehensive report provides a detailed analysis of the AI Bias Audit Services market, projecting substantial growth from $xx million in 2025 to $xx million by 2033. The study covers the period 2019-2033, with a focus on the forecast period 2025-2033 and a base year of 2025. It caters to businesses across various industries, including technology, finance, healthcare, and HR, seeking to mitigate bias in their AI systems. This report is crucial for investors, industry professionals, and technology providers navigating the rapidly evolving landscape of responsible AI development.
AI Bias Audit Services Market Dynamics & Structure
The AI Bias Audit Services market is characterized by moderate concentration, with a few key players holding significant market share (see Key Players section). Technological innovation is a primary driver, with new methodologies and tools constantly emerging to detect and address bias in algorithms. Stringent regulatory frameworks, particularly in regions like the EU and California, are increasingly shaping market demand. While there are no direct substitutes for specialized AI bias audits, businesses might attempt internal bias mitigation, often with less robust results. The end-user base comprises diverse industries, with a growing focus on sectors with high ethical and regulatory scrutiny. M&A activity within the market has been relatively limited in the historical period (2019-2024), with an estimated xx number of deals, but increased consolidation is predicted for the forecast period.
- Market Concentration: Moderately concentrated, with top 5 players holding approximately xx% market share in 2025.
- Technological Innovation: Rapid advancements in explainable AI (XAI) and fairness-aware machine learning are key drivers.
- Regulatory Landscape: GDPR, CCPA, and emerging AI ethics regulations are fueling demand.
- M&A Activity: xx deals recorded between 2019-2024; a predicted increase to xx deals between 2025-2033.
- Innovation Barriers: High cost of developing and validating new audit methodologies; lack of standardized benchmarks.
AI Bias Audit Services Growth Trends & Insights
The AI Bias Audit Services market experienced significant growth during the historical period (2019-2024), with an estimated CAGR of xx%. This growth is driven by increasing awareness of AI bias, growing regulatory scrutiny, and heightened societal focus on fairness and accountability in AI applications. Market penetration remains relatively low, particularly in smaller businesses and developing economies, presenting significant untapped potential. Technological disruptions, such as the rise of automated bias detection tools, are further accelerating market expansion. Shifts in consumer behavior, particularly increased demand for ethical and transparent AI products and services, are also driving market growth. We project a CAGR of xx% during the forecast period (2025-2033), leading to a market size of $xx million by 2033.
Dominant Regions, Countries, or Segments in AI Bias Audit Services
North America currently holds the largest market share in AI Bias Audit Services, driven by stringent data privacy regulations (e.g., CCPA), a strong technology ecosystem, and early adoption of AI technologies. Europe is also a key region with substantial growth potential, influenced by the GDPR and a growing focus on AI ethics. Specific countries like the US and UK are leading the way, owing to mature AI ecosystems and substantial venture capital investment. The financial services and healthcare sectors are major contributors, due to the high-stakes nature of their AI applications and the potential for significant reputational and financial damage from biased systems.
- Key Drivers in North America: Stringent regulations (CCPA), high AI adoption rates, significant venture capital investment.
- Key Drivers in Europe: GDPR compliance needs, growing awareness of ethical AI concerns.
- Segment Dominance: Financial services and healthcare represent the largest segments due to high-risk applications.
AI Bias Audit Services Product Landscape
The AI bias audit services market offers a range of products, from manual audits to automated tools leveraging machine learning. These tools can detect various types of bias, including demographic, gender, and racial bias. Unique selling propositions include the accuracy of bias detection, the ease of use of the auditing tools, and the comprehensiveness of the reports generated. Recent technological advancements include the integration of explainable AI (XAI) techniques to enhance the transparency and understanding of bias detection outcomes.
Key Drivers, Barriers & Challenges in AI Bias Audit Services
Key Drivers: Growing awareness of AI bias, increasing regulatory pressures, demand for ethical and responsible AI, and advancements in bias detection technologies.
Challenges: The high cost of audits can be a barrier for smaller businesses; lack of standardized methodologies and metrics makes comparisons difficult; competition from internal bias mitigation efforts and the complexity of interpreting audit results present significant challenges.
Emerging Opportunities in AI Bias Audit Services
Emerging opportunities include expanding into new industries (e.g., education, transportation), developing more specialized audit tools to target specific biases, and offering consulting services to help businesses implement bias mitigation strategies. Further opportunities exist in developing tools for continuous monitoring of AI systems to prevent future bias.
Growth Accelerators in the AI Bias Audit Services Industry
Strategic partnerships between AI developers and audit service providers can accelerate market growth. Technological advancements, particularly in automated bias detection and explainable AI, will drive demand. Expansion into new geographic markets and further development of training and educational resources will further fuel market expansion.
Key Players Shaping the AI Bias Audit Services Market
- Resolution Economics
- Mosaic Data Science
- Kanarys
- APTMetrics
- BABL AI
- DCI Consulting
- Elevate
- Eticas
- Idiro Analytics
- NYC Bias Audit
- ORCAA
- Rocket-Hire
- Holistic AI
- Vervoe
Notable Milestones in AI Bias Audit Services Sector
- 2020: Increased regulatory focus on AI fairness leads to significant market interest.
- 2021: Several major technology companies publicly commit to conducting regular AI bias audits.
- 2022: Introduction of several automated bias detection tools into the market.
- 2023: First major M&A deal in the AI bias audit space. (xx Million USD Transaction)
- 2024: Several universities launch AI ethics programs, increasing the supply of skilled professionals.
In-Depth AI Bias Audit Services Market Outlook
The AI Bias Audit Services market is poised for continued robust growth, driven by increasing regulatory scrutiny and a rising societal demand for responsible AI. Future opportunities lie in the development of more sophisticated and automated audit tools, expansion into new market segments, and continued focus on building trust and transparency in AI systems. Strategic partnerships and investments in R&D will be key to maximizing the market's potential.
AI Bias Audit Services Segmentation
-
1. Application
- 1.1. Large Enterprises
- 1.2. SMEs
-
2. Types
- 2.1. Cloud Based
- 2.2. On Premise
AI Bias Audit Services Segmentation By Geography
-
1. North America
- 1.1. United States
- 1.2. Canada
- 1.3. Mexico
-
2. South America
- 2.1. Brazil
- 2.2. Argentina
- 2.3. Rest of South America
-
3. Europe
- 3.1. United Kingdom
- 3.2. Germany
- 3.3. France
- 3.4. Italy
- 3.5. Spain
- 3.6. Russia
- 3.7. Benelux
- 3.8. Nordics
- 3.9. Rest of Europe
-
4. Middle East & Africa
- 4.1. Turkey
- 4.2. Israel
- 4.3. GCC
- 4.4. North Africa
- 4.5. South Africa
- 4.6. Rest of Middle East & Africa
-
5. Asia Pacific
- 5.1. China
- 5.2. India
- 5.3. Japan
- 5.4. South Korea
- 5.5. ASEAN
- 5.6. Oceania
- 5.7. Rest of Asia Pacific
AI Bias Audit Services Regional Market Share
Geographic Coverage of AI Bias Audit Services
AI Bias Audit Services REPORT HIGHLIGHTS
| Aspects | Details |
|---|---|
| Study Period | 2020-2034 |
| Base Year | 2025 |
| Estimated Year | 2026 |
| Forecast Period | 2026-2034 |
| Historical Period | 2020-2025 |
| Growth Rate | CAGR of 6.7% from 2020-2034 |
| Segmentation |
|
Table of Contents
- 1. Introduction
- 1.1. Research Scope
- 1.2. Market Segmentation
- 1.3. Research Objective
- 1.4. Definitions and Assumptions
- 2. Executive Summary
- 2.1. Market Snapshot
- 3. Market Dynamics
- 3.1. Market Drivers
- 3.2. Market Restrains
- 3.3. Market Trends
- 3.4. Market Opportunities
- 4. Market Factor Analysis
- 4.1. Porters Five Forces
- 4.1.1. Bargaining Power of Suppliers
- 4.1.2. Bargaining Power of Buyers
- 4.1.3. Threat of New Entrants
- 4.1.4. Threat of Substitutes
- 4.1.5. Competitive Rivalry
- 4.2. PESTEL analysis
- 4.3. BCG Analysis
- 4.3.1. Stars (High Growth, High Market Share)
- 4.3.2. Cash Cows (Low Growth, High Market Share)
- 4.3.3. Question Mark (High Growth, Low Market Share)
- 4.3.4. Dogs (Low Growth, Low Market Share)
- 4.4. Ansoff Matrix Analysis
- 4.5. Supply Chain Analysis
- 4.6. Regulatory Landscape
- 4.7. Current Market Potential and Opportunity Assessment (TAM–SAM–SOM Framework)
- 4.8. VDR Analyst Note
- 4.1. Porters Five Forces
- 5. Market Analysis, Insights and Forecast 2021-2033
- 5.1. Market Analysis, Insights and Forecast - by Application
- 5.1.1. Large Enterprises
- 5.1.2. SMEs
- 5.2. Market Analysis, Insights and Forecast - by Types
- 5.2.1. Cloud Based
- 5.2.2. On Premise
- 5.3. Market Analysis, Insights and Forecast - by Region
- 5.3.1. North America
- 5.3.2. South America
- 5.3.3. Europe
- 5.3.4. Middle East & Africa
- 5.3.5. Asia Pacific
- 5.1. Market Analysis, Insights and Forecast - by Application
- 6. Global AI Bias Audit Services Analysis, Insights and Forecast, 2021-2033
- 6.1. Market Analysis, Insights and Forecast - by Application
- 6.1.1. Large Enterprises
- 6.1.2. SMEs
- 6.2. Market Analysis, Insights and Forecast - by Types
- 6.2.1. Cloud Based
- 6.2.2. On Premise
- 6.1. Market Analysis, Insights and Forecast - by Application
- 7. North America AI Bias Audit Services Analysis, Insights and Forecast, 2021-2033
- 7.1. Market Analysis, Insights and Forecast - by Application
- 7.1.1. Large Enterprises
- 7.1.2. SMEs
- 7.2. Market Analysis, Insights and Forecast - by Types
- 7.2.1. Cloud Based
- 7.2.2. On Premise
- 7.1. Market Analysis, Insights and Forecast - by Application
- 8. South America AI Bias Audit Services Analysis, Insights and Forecast, 2021-2033
- 8.1. Market Analysis, Insights and Forecast - by Application
- 8.1.1. Large Enterprises
- 8.1.2. SMEs
- 8.2. Market Analysis, Insights and Forecast - by Types
- 8.2.1. Cloud Based
- 8.2.2. On Premise
- 8.1. Market Analysis, Insights and Forecast - by Application
- 9. Europe AI Bias Audit Services Analysis, Insights and Forecast, 2021-2033
- 9.1. Market Analysis, Insights and Forecast - by Application
- 9.1.1. Large Enterprises
- 9.1.2. SMEs
- 9.2. Market Analysis, Insights and Forecast - by Types
- 9.2.1. Cloud Based
- 9.2.2. On Premise
- 9.1. Market Analysis, Insights and Forecast - by Application
- 10. Middle East & Africa AI Bias Audit Services Analysis, Insights and Forecast, 2021-2033
- 10.1. Market Analysis, Insights and Forecast - by Application
- 10.1.1. Large Enterprises
- 10.1.2. SMEs
- 10.2. Market Analysis, Insights and Forecast - by Types
- 10.2.1. Cloud Based
- 10.2.2. On Premise
- 10.1. Market Analysis, Insights and Forecast - by Application
- 11. Asia Pacific AI Bias Audit Services Analysis, Insights and Forecast, 2021-2033
- 11.1. Market Analysis, Insights and Forecast - by Application
- 11.1.1. Large Enterprises
- 11.1.2. SMEs
- 11.2. Market Analysis, Insights and Forecast - by Types
- 11.2.1. Cloud Based
- 11.2.2. On Premise
- 11.1. Market Analysis, Insights and Forecast - by Application
- 12. Competitive Analysis
- 12.1. Company Profiles
- 12.1.1 Resolution Economics
- 12.1.1.1. Company Overview
- 12.1.1.2. Products
- 12.1.1.3. Company Financials
- 12.1.1.4. SWOT Analysis
- 12.1.2 Mosaic Data Science
- 12.1.2.1. Company Overview
- 12.1.2.2. Products
- 12.1.2.3. Company Financials
- 12.1.2.4. SWOT Analysis
- 12.1.3 Kanarys
- 12.1.3.1. Company Overview
- 12.1.3.2. Products
- 12.1.3.3. Company Financials
- 12.1.3.4. SWOT Analysis
- 12.1.4 APTMetrics
- 12.1.4.1. Company Overview
- 12.1.4.2. Products
- 12.1.4.3. Company Financials
- 12.1.4.4. SWOT Analysis
- 12.1.5 BABL AI
- 12.1.5.1. Company Overview
- 12.1.5.2. Products
- 12.1.5.3. Company Financials
- 12.1.5.4. SWOT Analysis
- 12.1.6 DCI Consulting
- 12.1.6.1. Company Overview
- 12.1.6.2. Products
- 12.1.6.3. Company Financials
- 12.1.6.4. SWOT Analysis
- 12.1.7 Elevate
- 12.1.7.1. Company Overview
- 12.1.7.2. Products
- 12.1.7.3. Company Financials
- 12.1.7.4. SWOT Analysis
- 12.1.8 Eticas
- 12.1.8.1. Company Overview
- 12.1.8.2. Products
- 12.1.8.3. Company Financials
- 12.1.8.4. SWOT Analysis
- 12.1.9 Idiro Analytics
- 12.1.9.1. Company Overview
- 12.1.9.2. Products
- 12.1.9.3. Company Financials
- 12.1.9.4. SWOT Analysis
- 12.1.10 NYC Bias Audit
- 12.1.10.1. Company Overview
- 12.1.10.2. Products
- 12.1.10.3. Company Financials
- 12.1.10.4. SWOT Analysis
- 12.1.11 ORCAA
- 12.1.11.1. Company Overview
- 12.1.11.2. Products
- 12.1.11.3. Company Financials
- 12.1.11.4. SWOT Analysis
- 12.1.12 Rocket-Hire
- 12.1.12.1. Company Overview
- 12.1.12.2. Products
- 12.1.12.3. Company Financials
- 12.1.12.4. SWOT Analysis
- 12.1.13 Holistic AI
- 12.1.13.1. Company Overview
- 12.1.13.2. Products
- 12.1.13.3. Company Financials
- 12.1.13.4. SWOT Analysis
- 12.1.14 Vervoe
- 12.1.14.1. Company Overview
- 12.1.14.2. Products
- 12.1.14.3. Company Financials
- 12.1.14.4. SWOT Analysis
- 12.1.1 Resolution Economics
- 12.2. Market Entropy
- 12.2.1 Company's Key Areas Served
- 12.2.2 Recent Developments
- 12.3. Company Market Share Analysis 2025
- 12.3.1 Top 5 Companies Market Share Analysis
- 12.3.2 Top 3 Companies Market Share Analysis
- 12.4. List of Potential Customers
- 13. Research Methodology
List of Figures
- Figure 1: Global AI Bias Audit Services Revenue Breakdown (million, %) by Region 2025 & 2033
- Figure 2: North America AI Bias Audit Services Revenue (million), by Application 2025 & 2033
- Figure 3: North America AI Bias Audit Services Revenue Share (%), by Application 2025 & 2033
- Figure 4: North America AI Bias Audit Services Revenue (million), by Types 2025 & 2033
- Figure 5: North America AI Bias Audit Services Revenue Share (%), by Types 2025 & 2033
- Figure 6: North America AI Bias Audit Services Revenue (million), by Country 2025 & 2033
- Figure 7: North America AI Bias Audit Services Revenue Share (%), by Country 2025 & 2033
- Figure 8: South America AI Bias Audit Services Revenue (million), by Application 2025 & 2033
- Figure 9: South America AI Bias Audit Services Revenue Share (%), by Application 2025 & 2033
- Figure 10: South America AI Bias Audit Services Revenue (million), by Types 2025 & 2033
- Figure 11: South America AI Bias Audit Services Revenue Share (%), by Types 2025 & 2033
- Figure 12: South America AI Bias Audit Services Revenue (million), by Country 2025 & 2033
- Figure 13: South America AI Bias Audit Services Revenue Share (%), by Country 2025 & 2033
- Figure 14: Europe AI Bias Audit Services Revenue (million), by Application 2025 & 2033
- Figure 15: Europe AI Bias Audit Services Revenue Share (%), by Application 2025 & 2033
- Figure 16: Europe AI Bias Audit Services Revenue (million), by Types 2025 & 2033
- Figure 17: Europe AI Bias Audit Services Revenue Share (%), by Types 2025 & 2033
- Figure 18: Europe AI Bias Audit Services Revenue (million), by Country 2025 & 2033
- Figure 19: Europe AI Bias Audit Services Revenue Share (%), by Country 2025 & 2033
- Figure 20: Middle East & Africa AI Bias Audit Services Revenue (million), by Application 2025 & 2033
- Figure 21: Middle East & Africa AI Bias Audit Services Revenue Share (%), by Application 2025 & 2033
- Figure 22: Middle East & Africa AI Bias Audit Services Revenue (million), by Types 2025 & 2033
- Figure 23: Middle East & Africa AI Bias Audit Services Revenue Share (%), by Types 2025 & 2033
- Figure 24: Middle East & Africa AI Bias Audit Services Revenue (million), by Country 2025 & 2033
- Figure 25: Middle East & Africa AI Bias Audit Services Revenue Share (%), by Country 2025 & 2033
- Figure 26: Asia Pacific AI Bias Audit Services Revenue (million), by Application 2025 & 2033
- Figure 27: Asia Pacific AI Bias Audit Services Revenue Share (%), by Application 2025 & 2033
- Figure 28: Asia Pacific AI Bias Audit Services Revenue (million), by Types 2025 & 2033
- Figure 29: Asia Pacific AI Bias Audit Services Revenue Share (%), by Types 2025 & 2033
- Figure 30: Asia Pacific AI Bias Audit Services Revenue (million), by Country 2025 & 2033
- Figure 31: Asia Pacific AI Bias Audit Services Revenue Share (%), by Country 2025 & 2033
List of Tables
- Table 1: Global AI Bias Audit Services Revenue million Forecast, by Application 2020 & 2033
- Table 2: Global AI Bias Audit Services Revenue million Forecast, by Types 2020 & 2033
- Table 3: Global AI Bias Audit Services Revenue million Forecast, by Region 2020 & 2033
- Table 4: Global AI Bias Audit Services Revenue million Forecast, by Application 2020 & 2033
- Table 5: Global AI Bias Audit Services Revenue million Forecast, by Types 2020 & 2033
- Table 6: Global AI Bias Audit Services Revenue million Forecast, by Country 2020 & 2033
- Table 7: United States AI Bias Audit Services Revenue (million) Forecast, by Application 2020 & 2033
- Table 8: Canada AI Bias Audit Services Revenue (million) Forecast, by Application 2020 & 2033
- Table 9: Mexico AI Bias Audit Services Revenue (million) Forecast, by Application 2020 & 2033
- Table 10: Global AI Bias Audit Services Revenue million Forecast, by Application 2020 & 2033
- Table 11: Global AI Bias Audit Services Revenue million Forecast, by Types 2020 & 2033
- Table 12: Global AI Bias Audit Services Revenue million Forecast, by Country 2020 & 2033
- Table 13: Brazil AI Bias Audit Services Revenue (million) Forecast, by Application 2020 & 2033
- Table 14: Argentina AI Bias Audit Services Revenue (million) Forecast, by Application 2020 & 2033
- Table 15: Rest of South America AI Bias Audit Services Revenue (million) Forecast, by Application 2020 & 2033
- Table 16: Global AI Bias Audit Services Revenue million Forecast, by Application 2020 & 2033
- Table 17: Global AI Bias Audit Services Revenue million Forecast, by Types 2020 & 2033
- Table 18: Global AI Bias Audit Services Revenue million Forecast, by Country 2020 & 2033
- Table 19: United Kingdom AI Bias Audit Services Revenue (million) Forecast, by Application 2020 & 2033
- Table 20: Germany AI Bias Audit Services Revenue (million) Forecast, by Application 2020 & 2033
- Table 21: France AI Bias Audit Services Revenue (million) Forecast, by Application 2020 & 2033
- Table 22: Italy AI Bias Audit Services Revenue (million) Forecast, by Application 2020 & 2033
- Table 23: Spain AI Bias Audit Services Revenue (million) Forecast, by Application 2020 & 2033
- Table 24: Russia AI Bias Audit Services Revenue (million) Forecast, by Application 2020 & 2033
- Table 25: Benelux AI Bias Audit Services Revenue (million) Forecast, by Application 2020 & 2033
- Table 26: Nordics AI Bias Audit Services Revenue (million) Forecast, by Application 2020 & 2033
- Table 27: Rest of Europe AI Bias Audit Services Revenue (million) Forecast, by Application 2020 & 2033
- Table 28: Global AI Bias Audit Services Revenue million Forecast, by Application 2020 & 2033
- Table 29: Global AI Bias Audit Services Revenue million Forecast, by Types 2020 & 2033
- Table 30: Global AI Bias Audit Services Revenue million Forecast, by Country 2020 & 2033
- Table 31: Turkey AI Bias Audit Services Revenue (million) Forecast, by Application 2020 & 2033
- Table 32: Israel AI Bias Audit Services Revenue (million) Forecast, by Application 2020 & 2033
- Table 33: GCC AI Bias Audit Services Revenue (million) Forecast, by Application 2020 & 2033
- Table 34: North Africa AI Bias Audit Services Revenue (million) Forecast, by Application 2020 & 2033
- Table 35: South Africa AI Bias Audit Services Revenue (million) Forecast, by Application 2020 & 2033
- Table 36: Rest of Middle East & Africa AI Bias Audit Services Revenue (million) Forecast, by Application 2020 & 2033
- Table 37: Global AI Bias Audit Services Revenue million Forecast, by Application 2020 & 2033
- Table 38: Global AI Bias Audit Services Revenue million Forecast, by Types 2020 & 2033
- Table 39: Global AI Bias Audit Services Revenue million Forecast, by Country 2020 & 2033
- Table 40: China AI Bias Audit Services Revenue (million) Forecast, by Application 2020 & 2033
- Table 41: India AI Bias Audit Services Revenue (million) Forecast, by Application 2020 & 2033
- Table 42: Japan AI Bias Audit Services Revenue (million) Forecast, by Application 2020 & 2033
- Table 43: South Korea AI Bias Audit Services Revenue (million) Forecast, by Application 2020 & 2033
- Table 44: ASEAN AI Bias Audit Services Revenue (million) Forecast, by Application 2020 & 2033
- Table 45: Oceania AI Bias Audit Services Revenue (million) Forecast, by Application 2020 & 2033
- Table 46: Rest of Asia Pacific AI Bias Audit Services Revenue (million) Forecast, by Application 2020 & 2033
Frequently Asked Questions
1. What is the projected Compound Annual Growth Rate (CAGR) of the AI Bias Audit Services?
The projected CAGR is approximately 6.7%.
2. Which companies are prominent players in the AI Bias Audit Services?
Key companies in the market include Resolution Economics, Mosaic Data Science, Kanarys, APTMetrics, BABL AI, DCI Consulting, Elevate, Eticas, Idiro Analytics, NYC Bias Audit, ORCAA, Rocket-Hire, Holistic AI, Vervoe.
3. What are the main segments of the AI Bias Audit Services?
The market segments include Application, Types.
4. Can you provide details about the market size?
The market size is estimated to be USD 613 million as of 2022.
5. What are some drivers contributing to market growth?
N/A
6. What are the notable trends driving market growth?
N/A
7. Are there any restraints impacting market growth?
N/A
8. Can you provide examples of recent developments in the market?
N/A
9. What pricing options are available for accessing the report?
Pricing options include single-user, multi-user, and enterprise licenses priced at USD 4350.00, USD 6525.00, and USD 8700.00 respectively.
10. Is the market size provided in terms of value or volume?
The market size is provided in terms of value, measured in million.
11. Are there any specific market keywords associated with the report?
Yes, the market keyword associated with the report is "AI Bias Audit Services," which aids in identifying and referencing the specific market segment covered.
12. How do I determine which pricing option suits my needs best?
The pricing options vary based on user requirements and access needs. Individual users may opt for single-user licenses, while businesses requiring broader access may choose multi-user or enterprise licenses for cost-effective access to the report.
13. Are there any additional resources or data provided in the AI Bias Audit Services report?
While the report offers comprehensive insights, it's advisable to review the specific contents or supplementary materials provided to ascertain if additional resources or data are available.
14. How can I stay updated on further developments or reports in the AI Bias Audit Services?
To stay informed about further developments, trends, and reports in the AI Bias Audit Services, consider subscribing to industry newsletters, following relevant companies and organizations, or regularly checking reputable industry news sources and publications.
Methodology
Step 1 - Identification of Relevant Samples Size from Population Database


Step 2 - Approaches for Defining Global Market Size (Value, Volume* & Price*)

Note*: In applicable scenarios
Step 3 - Data Sources
Primary Research
- Web Analytics
- Survey Reports
- Research Institute
- Latest Research Reports
- Opinion Leaders
Secondary Research
- Annual Reports
- White Paper
- Latest Press Release
- Industry Association
- Paid Database
- Investor Presentations

Step 4 - Data Triangulation
Involves using different sources of information in order to increase the validity of a study
These sources are likely to be stakeholders in a program - participants, other researchers, program staff, other community members, and so on.
Then we put all data in single framework & apply various statistical tools to find out the dynamic on the market.
During the analysis stage, feedback from the stakeholder groups would be compared to determine areas of agreement as well as areas of divergence