
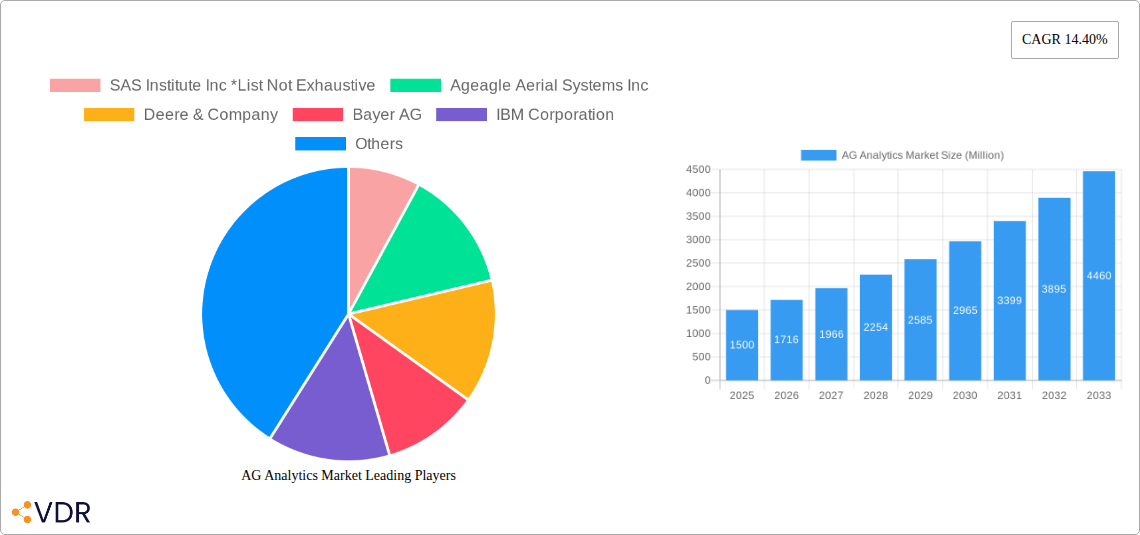
Key Insights
The global agricultural analytics market is experiencing robust growth, driven by the increasing adoption of precision farming techniques and the growing need for data-driven decision-making in agriculture. A compound annual growth rate (CAGR) of 14.40% from 2019 to 2024 suggests a significant expansion, likely continuing into the forecast period (2025-2033). Key drivers include the rising demand for higher crop yields, increasing pressure to optimize resource utilization (water, fertilizer, pesticides), and the growing adoption of IoT devices and sensors in farming operations. The market is segmented by deployment type (on-premise and cloud), farm size (small and medium farms, large farms), component type (solutions and services), and analytics type (farm analytics and livestock analytics). The cloud deployment model is expected to witness substantial growth due to its scalability and cost-effectiveness. Large farms are currently the major consumers of these analytics solutions, given their resources and higher operational complexities. However, the increasing affordability and accessibility of these technologies are driving adoption among small and medium-sized farms. While data security and privacy concerns pose a restraint, the overall market outlook remains positive due to continuous technological advancements and government initiatives supporting precision agriculture. The increasing availability of data from various sources, including satellites, drones, and field sensors, fuels the development of advanced analytics solutions, improving efficiency and profitability for farmers globally.
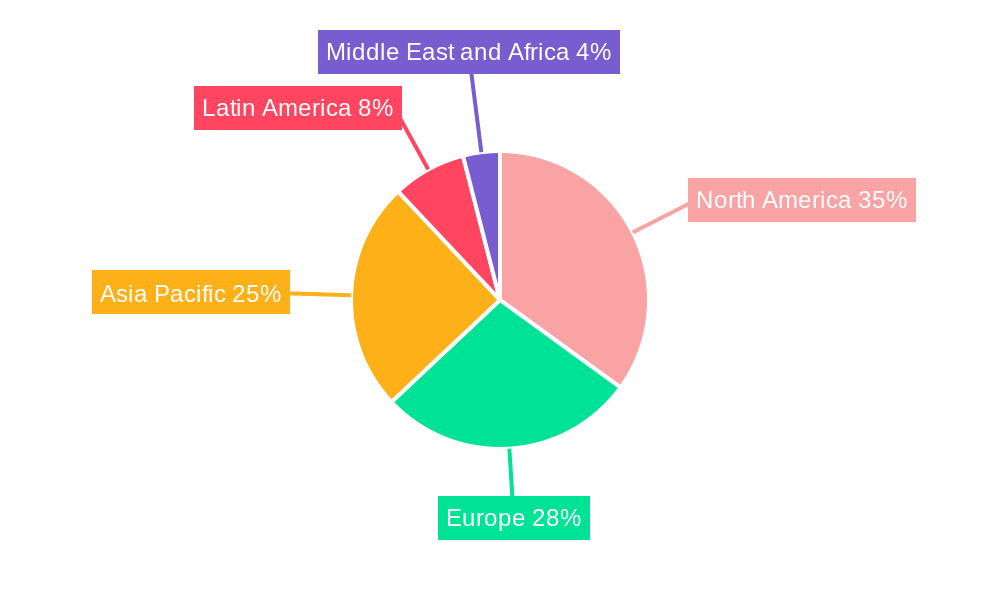
The competitive landscape comprises a mix of established agricultural technology companies, software giants, and specialized analytics providers. Companies like Deere & Company, Bayer AG, and IBM Corporation are leveraging their existing expertise and market presence to offer comprehensive solutions. Smaller, specialized companies like Ageagle Aerial Systems Inc and PrecisionHawk Inc are contributing innovative technologies, particularly in the area of data acquisition using drones and aerial imagery. The regional distribution is likely skewed towards North America and Europe initially, given the early adoption of precision agriculture technologies in these regions. However, rapidly developing economies in Asia Pacific and Latin America are expected to witness significant growth in the coming years, driven by increasing agricultural production and investments in agricultural modernization. The market's future growth will be strongly influenced by further technological innovations in AI, machine learning, and data integration, along with increasing government support and favorable regulatory environments across different regions.
This comprehensive report provides an in-depth analysis of the AG Analytics Market, encompassing market dynamics, growth trends, regional dominance, product landscape, key players, and future outlook. The study covers the period 2019-2033, with a base year of 2025 and a forecast period of 2025-2033. This report is invaluable for industry professionals, investors, and stakeholders seeking to understand and capitalize on the burgeoning opportunities within this dynamic sector. The parent market is Agriculture Technology and the child market is precision farming. The market size is predicted to reach xx Million by 2033.
AG Analytics Market Market Dynamics & Structure
The AG Analytics market is characterized by moderate concentration, with a few major players holding significant market share, while numerous smaller companies compete in niche segments. Technological innovation, particularly in AI, machine learning, and IoT, is a primary growth driver, enabling more precise data collection and analysis. Stringent regulations concerning data privacy and security are shaping market practices. Competitive substitutes, such as traditional farming methods, are gradually being replaced as the value proposition of data-driven decision-making becomes clearer. The end-user demographic primarily consists of large-scale commercial farms, but adoption is increasing among small and medium-sized farms. Consolidation through mergers and acquisitions (M&A) is a recurring trend, with xx M&A deals recorded between 2019 and 2024 representing a xx% increase compared to the previous period.
- Market Concentration: Moderately concentrated, with top 5 players holding approximately xx% market share in 2024.
- Technological Innovation: AI, ML, and IoT are key drivers, boosting data analytics capabilities.
- Regulatory Framework: Data privacy and security regulations influence market strategies.
- Competitive Substitutes: Traditional farming methods face increasing competition.
- End-User Demographics: Large farms dominate, but adoption among small and medium farms is rising.
- M&A Trends: xx M&A deals between 2019 and 2024, indicating market consolidation.
AG Analytics Market Growth Trends & Insights
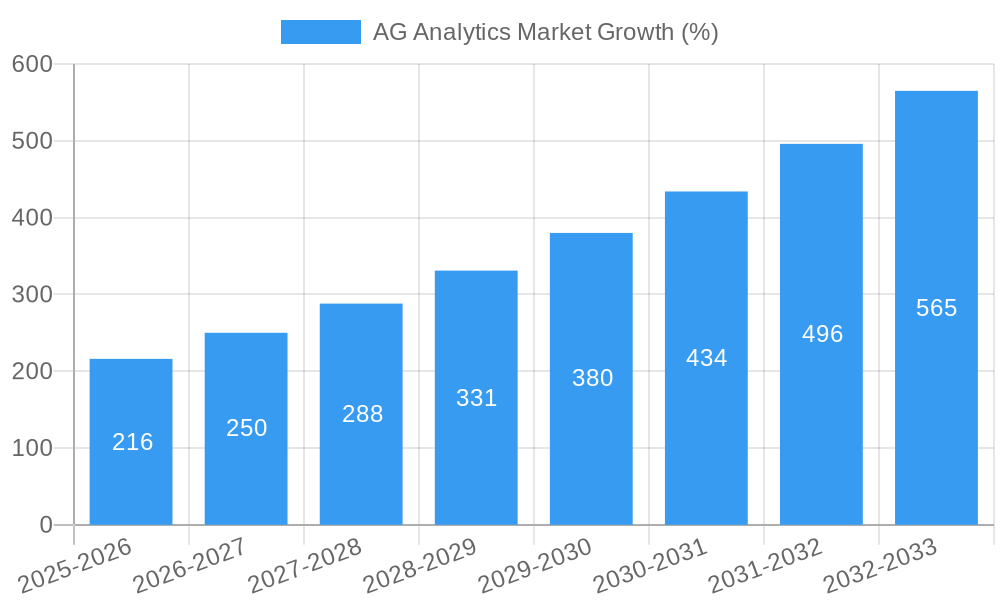
The AG Analytics market has exhibited robust growth, with a Compound Annual Growth Rate (CAGR) of xx% during the historical period (2019-2024). This growth is driven by the increasing adoption of precision agriculture techniques, improved data accessibility, and the rising demand for enhanced farm efficiency and yield optimization. Technological disruptions, such as the proliferation of sensor technology and cloud-based analytics platforms, are significantly accelerating market expansion. Consumer behavior shifts towards data-driven decision-making are further fueling market growth. Market penetration in 2024 is estimated at xx%, with significant potential for future expansion, particularly in developing economies. By 2033, the market is projected to reach xx Million, showcasing significant growth potential.
Dominant Regions, Countries, or Segments in AG Analytics Market
North America currently holds the largest market share, driven by early adoption of technology, robust agricultural infrastructure, and supportive government policies. Within this region, the United States leads in terms of both market size and growth rate. The cloud deployment type is experiencing the fastest growth, propelled by scalability, accessibility, and cost-effectiveness. Large farms are the primary adopters of AG analytics solutions, due to their higher investment capacity and potential for significant returns on investment. The Farm Analytics segment currently dominates, but Livestock Analytics is showing rapid growth potential, driven by the increasing demand for efficient livestock management.
- Key Drivers:
- North America: Advanced technology adoption, strong agricultural infrastructure, supportive government policies.
- Cloud Deployment: Scalability, accessibility, cost-effectiveness.
- Large Farms: Higher investment capacity, significant ROI potential.
- Farm Analytics: Established market segment with proven ROI.
- Dominance Factors: Early adoption, robust infrastructure, supportive policies, and high ROI potential.
AG Analytics Market Product Landscape
The AG Analytics market offers a range of solutions and services, from basic data collection and analysis tools to sophisticated AI-powered predictive models. Product innovation focuses on improving data accuracy, enhancing analytical capabilities, and integrating with existing farm management systems. Unique selling propositions include real-time insights, predictive analytics, and customized solutions tailored to specific farming needs. Technological advancements such as advanced sensor technologies, cloud computing, and AI are constantly enhancing the capabilities and efficacy of AG analytics products.
Key Drivers, Barriers & Challenges in AG Analytics Market
Key Drivers:
- Increasing demand for improved farm efficiency and yield optimization.
- Growing adoption of precision agriculture techniques.
- Advancements in sensor technology, AI, and cloud computing.
- Government initiatives promoting technological adoption in agriculture.
Challenges and Restraints:
- High initial investment costs for technology adoption.
- Data security and privacy concerns.
- Lack of digital literacy among farmers.
- Interoperability issues between different systems.
- The impact of these challenges is estimated to reduce the market growth by approximately xx% in 2025.
Emerging Opportunities in AG Analytics Market
- Expansion into untapped markets in developing countries.
- Development of specialized solutions for specific crops and livestock.
- Integration of AG analytics with other farm management tools.
- Growing demand for sustainable and environmentally friendly agricultural practices.
- Increased focus on data-driven decision making for risk management.
Growth Accelerators in the AG Analytics Market Industry
Technological advancements, particularly in AI and machine learning, will continue to drive market growth. Strategic partnerships between technology providers and agricultural businesses will facilitate wider adoption. Expansion into new geographic markets, especially in developing countries, offers significant growth potential. Government initiatives promoting digital agriculture will further accelerate market expansion. The increasing awareness among farmers regarding the benefits of data-driven agriculture will accelerate adoption.
Key Players Shaping the AG Analytics Market Market
- SAS Institute Inc
- Ageagle Aerial Systems Inc
- Deere & Company
- Bayer AG
- IBM Corporation
- Conservis Corporation
- PrecisionHawk Inc
- Trimble Inc
- Vistex Inc
- Iteris Inc
- Agrivi
Notable Milestones in AG Analytics Market Sector
- 2020, Q4: Launch of a new AI-powered predictive analytics platform by SAS Institute Inc.
- 2021, Q2: Acquisition of a precision agriculture technology company by Deere & Company.
- 2022, Q3: Introduction of a new IoT-enabled sensor network by Trimble Inc.
- 2023, Q1: Partnership between Bayer AG and a leading agricultural data analytics provider. (Further milestones require specific data.)
In-Depth AG Analytics Market Market Outlook
The AG Analytics market is poised for continued strong growth, driven by technological innovation, increased adoption rates, and expanding applications. Strategic partnerships, market expansion into new geographies, and the development of innovative solutions will shape future market dynamics. The potential for enhanced farm efficiency, yield optimization, and sustainable agricultural practices makes AG analytics a vital component of the future of agriculture. The market is projected to reach xx Million by 2033, driven primarily by technological advancements and increasing adoption across diverse farming segments.
AG Analytics Market Segmentation
-
1. Component Type
- 1.1. Solutions
- 1.2. Services
-
2. Type
- 2.1. Farm Analytics
- 2.2. Livestock Analytics
-
3. Deployment Type
- 3.1. On-Premise
- 3.2. Cloud
-
4. Farm Size
- 4.1. Small and Medium Farms
- 4.2. Large Farms
AG Analytics Market Segmentation By Geography
- 1. North America
- 2. Europe
- 3. Asia Pacific
- 4. Latin America
- 5. Middle East and Africa
AG Analytics Market REPORT HIGHLIGHTS
| Aspects | Details |
|---|---|
| Study Period | 2019-2033 |
| Base Year | 2024 |
| Estimated Year | 2025 |
| Forecast Period | 2025-2033 |
| Historical Period | 2019-2024 |
| Growth Rate | CAGR of 14.40% from 2019-2033 |
| Segmentation |
|
Table of Contents
- 1. Introduction
- 1.1. Research Scope
- 1.2. Market Segmentation
- 1.3. Research Methodology
- 1.4. Definitions and Assumptions
- 2. Executive Summary
- 2.1. Introduction
- 3. Market Dynamics
- 3.1. Introduction
- 3.2. Market Drivers
- 3.2.1. ; Rising Usage of Cutting-edge Technology-based Solutions for Farming
- 3.3. Market Restrains
- 3.3.1. ; High Capital Cost and Complexity Regarding System Upgrades
- 3.4. Market Trends
- 3.4.1. Farm Analytics is Expected to Grow at a Significant Rate Over the Forecast Period
- 4. Market Factor Analysis
- 4.1. Porters Five Forces
- 4.2. Supply/Value Chain
- 4.3. PESTEL analysis
- 4.4. Market Entropy
- 4.5. Patent/Trademark Analysis
- 5. Global AG Analytics Market Analysis, Insights and Forecast, 2019-2031
- 5.1. Market Analysis, Insights and Forecast - by Component Type
- 5.1.1. Solutions
- 5.1.2. Services
- 5.2. Market Analysis, Insights and Forecast - by Type
- 5.2.1. Farm Analytics
- 5.2.2. Livestock Analytics
- 5.3. Market Analysis, Insights and Forecast - by Deployment Type
- 5.3.1. On-Premise
- 5.3.2. Cloud
- 5.4. Market Analysis, Insights and Forecast - by Farm Size
- 5.4.1. Small and Medium Farms
- 5.4.2. Large Farms
- 5.5. Market Analysis, Insights and Forecast - by Region
- 5.5.1. North America
- 5.5.2. Europe
- 5.5.3. Asia Pacific
- 5.5.4. Latin America
- 5.5.5. Middle East and Africa
- 5.1. Market Analysis, Insights and Forecast - by Component Type
- 6. North America AG Analytics Market Analysis, Insights and Forecast, 2019-2031
- 6.1. Market Analysis, Insights and Forecast - by Component Type
- 6.1.1. Solutions
- 6.1.2. Services
- 6.2. Market Analysis, Insights and Forecast - by Type
- 6.2.1. Farm Analytics
- 6.2.2. Livestock Analytics
- 6.3. Market Analysis, Insights and Forecast - by Deployment Type
- 6.3.1. On-Premise
- 6.3.2. Cloud
- 6.4. Market Analysis, Insights and Forecast - by Farm Size
- 6.4.1. Small and Medium Farms
- 6.4.2. Large Farms
- 6.1. Market Analysis, Insights and Forecast - by Component Type
- 7. Europe AG Analytics Market Analysis, Insights and Forecast, 2019-2031
- 7.1. Market Analysis, Insights and Forecast - by Component Type
- 7.1.1. Solutions
- 7.1.2. Services
- 7.2. Market Analysis, Insights and Forecast - by Type
- 7.2.1. Farm Analytics
- 7.2.2. Livestock Analytics
- 7.3. Market Analysis, Insights and Forecast - by Deployment Type
- 7.3.1. On-Premise
- 7.3.2. Cloud
- 7.4. Market Analysis, Insights and Forecast - by Farm Size
- 7.4.1. Small and Medium Farms
- 7.4.2. Large Farms
- 7.1. Market Analysis, Insights and Forecast - by Component Type
- 8. Asia Pacific AG Analytics Market Analysis, Insights and Forecast, 2019-2031
- 8.1. Market Analysis, Insights and Forecast - by Component Type
- 8.1.1. Solutions
- 8.1.2. Services
- 8.2. Market Analysis, Insights and Forecast - by Type
- 8.2.1. Farm Analytics
- 8.2.2. Livestock Analytics
- 8.3. Market Analysis, Insights and Forecast - by Deployment Type
- 8.3.1. On-Premise
- 8.3.2. Cloud
- 8.4. Market Analysis, Insights and Forecast - by Farm Size
- 8.4.1. Small and Medium Farms
- 8.4.2. Large Farms
- 8.1. Market Analysis, Insights and Forecast - by Component Type
- 9. Latin America AG Analytics Market Analysis, Insights and Forecast, 2019-2031
- 9.1. Market Analysis, Insights and Forecast - by Component Type
- 9.1.1. Solutions
- 9.1.2. Services
- 9.2. Market Analysis, Insights and Forecast - by Type
- 9.2.1. Farm Analytics
- 9.2.2. Livestock Analytics
- 9.3. Market Analysis, Insights and Forecast - by Deployment Type
- 9.3.1. On-Premise
- 9.3.2. Cloud
- 9.4. Market Analysis, Insights and Forecast - by Farm Size
- 9.4.1. Small and Medium Farms
- 9.4.2. Large Farms
- 9.1. Market Analysis, Insights and Forecast - by Component Type
- 10. Middle East and Africa AG Analytics Market Analysis, Insights and Forecast, 2019-2031
- 10.1. Market Analysis, Insights and Forecast - by Component Type
- 10.1.1. Solutions
- 10.1.2. Services
- 10.2. Market Analysis, Insights and Forecast - by Type
- 10.2.1. Farm Analytics
- 10.2.2. Livestock Analytics
- 10.3. Market Analysis, Insights and Forecast - by Deployment Type
- 10.3.1. On-Premise
- 10.3.2. Cloud
- 10.4. Market Analysis, Insights and Forecast - by Farm Size
- 10.4.1. Small and Medium Farms
- 10.4.2. Large Farms
- 10.1. Market Analysis, Insights and Forecast - by Component Type
- 11. North America AG Analytics Market Analysis, Insights and Forecast, 2019-2031
- 11.1. Market Analysis, Insights and Forecast - By Country/Sub-region
- 11.1.1.
- 12. Europe AG Analytics Market Analysis, Insights and Forecast, 2019-2031
- 12.1. Market Analysis, Insights and Forecast - By Country/Sub-region
- 12.1.1.
- 13. Asia Pacific AG Analytics Market Analysis, Insights and Forecast, 2019-2031
- 13.1. Market Analysis, Insights and Forecast - By Country/Sub-region
- 13.1.1.
- 14. Latin America AG Analytics Market Analysis, Insights and Forecast, 2019-2031
- 14.1. Market Analysis, Insights and Forecast - By Country/Sub-region
- 14.1.1.
- 15. Middle East and Africa AG Analytics Market Analysis, Insights and Forecast, 2019-2031
- 15.1. Market Analysis, Insights and Forecast - By Country/Sub-region
- 15.1.1.
- 16. Competitive Analysis
- 16.1. Global Market Share Analysis 2024
- 16.2. Company Profiles
- 16.2.1 SAS Institute Inc *List Not Exhaustive
- 16.2.1.1. Overview
- 16.2.1.2. Products
- 16.2.1.3. SWOT Analysis
- 16.2.1.4. Recent Developments
- 16.2.1.5. Financials (Based on Availability)
- 16.2.2 Ageagle Aerial Systems Inc
- 16.2.2.1. Overview
- 16.2.2.2. Products
- 16.2.2.3. SWOT Analysis
- 16.2.2.4. Recent Developments
- 16.2.2.5. Financials (Based on Availability)
- 16.2.3 Deere & Company
- 16.2.3.1. Overview
- 16.2.3.2. Products
- 16.2.3.3. SWOT Analysis
- 16.2.3.4. Recent Developments
- 16.2.3.5. Financials (Based on Availability)
- 16.2.4 Bayer AG
- 16.2.4.1. Overview
- 16.2.4.2. Products
- 16.2.4.3. SWOT Analysis
- 16.2.4.4. Recent Developments
- 16.2.4.5. Financials (Based on Availability)
- 16.2.5 IBM Corporation
- 16.2.5.1. Overview
- 16.2.5.2. Products
- 16.2.5.3. SWOT Analysis
- 16.2.5.4. Recent Developments
- 16.2.5.5. Financials (Based on Availability)
- 16.2.6 Conservis Corporation
- 16.2.6.1. Overview
- 16.2.6.2. Products
- 16.2.6.3. SWOT Analysis
- 16.2.6.4. Recent Developments
- 16.2.6.5. Financials (Based on Availability)
- 16.2.7 PrecisionHawk Inc
- 16.2.7.1. Overview
- 16.2.7.2. Products
- 16.2.7.3. SWOT Analysis
- 16.2.7.4. Recent Developments
- 16.2.7.5. Financials (Based on Availability)
- 16.2.8 Trimble Inc
- 16.2.8.1. Overview
- 16.2.8.2. Products
- 16.2.8.3. SWOT Analysis
- 16.2.8.4. Recent Developments
- 16.2.8.5. Financials (Based on Availability)
- 16.2.9 Vistex Inc
- 16.2.9.1. Overview
- 16.2.9.2. Products
- 16.2.9.3. SWOT Analysis
- 16.2.9.4. Recent Developments
- 16.2.9.5. Financials (Based on Availability)
- 16.2.10 Iteris Inc
- 16.2.10.1. Overview
- 16.2.10.2. Products
- 16.2.10.3. SWOT Analysis
- 16.2.10.4. Recent Developments
- 16.2.10.5. Financials (Based on Availability)
- 16.2.11 Agrivi
- 16.2.11.1. Overview
- 16.2.11.2. Products
- 16.2.11.3. SWOT Analysis
- 16.2.11.4. Recent Developments
- 16.2.11.5. Financials (Based on Availability)
- 16.2.1 SAS Institute Inc *List Not Exhaustive
List of Figures
- Figure 1: Global AG Analytics Market Revenue Breakdown (Million, %) by Region 2024 & 2032
- Figure 2: North America AG Analytics Market Revenue (Million), by Country 2024 & 2032
- Figure 3: North America AG Analytics Market Revenue Share (%), by Country 2024 & 2032
- Figure 4: Europe AG Analytics Market Revenue (Million), by Country 2024 & 2032
- Figure 5: Europe AG Analytics Market Revenue Share (%), by Country 2024 & 2032
- Figure 6: Asia Pacific AG Analytics Market Revenue (Million), by Country 2024 & 2032
- Figure 7: Asia Pacific AG Analytics Market Revenue Share (%), by Country 2024 & 2032
- Figure 8: Latin America AG Analytics Market Revenue (Million), by Country 2024 & 2032
- Figure 9: Latin America AG Analytics Market Revenue Share (%), by Country 2024 & 2032
- Figure 10: Middle East and Africa AG Analytics Market Revenue (Million), by Country 2024 & 2032
- Figure 11: Middle East and Africa AG Analytics Market Revenue Share (%), by Country 2024 & 2032
- Figure 12: North America AG Analytics Market Revenue (Million), by Component Type 2024 & 2032
- Figure 13: North America AG Analytics Market Revenue Share (%), by Component Type 2024 & 2032
- Figure 14: North America AG Analytics Market Revenue (Million), by Type 2024 & 2032
- Figure 15: North America AG Analytics Market Revenue Share (%), by Type 2024 & 2032
- Figure 16: North America AG Analytics Market Revenue (Million), by Deployment Type 2024 & 2032
- Figure 17: North America AG Analytics Market Revenue Share (%), by Deployment Type 2024 & 2032
- Figure 18: North America AG Analytics Market Revenue (Million), by Farm Size 2024 & 2032
- Figure 19: North America AG Analytics Market Revenue Share (%), by Farm Size 2024 & 2032
- Figure 20: North America AG Analytics Market Revenue (Million), by Country 2024 & 2032
- Figure 21: North America AG Analytics Market Revenue Share (%), by Country 2024 & 2032
- Figure 22: Europe AG Analytics Market Revenue (Million), by Component Type 2024 & 2032
- Figure 23: Europe AG Analytics Market Revenue Share (%), by Component Type 2024 & 2032
- Figure 24: Europe AG Analytics Market Revenue (Million), by Type 2024 & 2032
- Figure 25: Europe AG Analytics Market Revenue Share (%), by Type 2024 & 2032
- Figure 26: Europe AG Analytics Market Revenue (Million), by Deployment Type 2024 & 2032
- Figure 27: Europe AG Analytics Market Revenue Share (%), by Deployment Type 2024 & 2032
- Figure 28: Europe AG Analytics Market Revenue (Million), by Farm Size 2024 & 2032
- Figure 29: Europe AG Analytics Market Revenue Share (%), by Farm Size 2024 & 2032
- Figure 30: Europe AG Analytics Market Revenue (Million), by Country 2024 & 2032
- Figure 31: Europe AG Analytics Market Revenue Share (%), by Country 2024 & 2032
- Figure 32: Asia Pacific AG Analytics Market Revenue (Million), by Component Type 2024 & 2032
- Figure 33: Asia Pacific AG Analytics Market Revenue Share (%), by Component Type 2024 & 2032
- Figure 34: Asia Pacific AG Analytics Market Revenue (Million), by Type 2024 & 2032
- Figure 35: Asia Pacific AG Analytics Market Revenue Share (%), by Type 2024 & 2032
- Figure 36: Asia Pacific AG Analytics Market Revenue (Million), by Deployment Type 2024 & 2032
- Figure 37: Asia Pacific AG Analytics Market Revenue Share (%), by Deployment Type 2024 & 2032
- Figure 38: Asia Pacific AG Analytics Market Revenue (Million), by Farm Size 2024 & 2032
- Figure 39: Asia Pacific AG Analytics Market Revenue Share (%), by Farm Size 2024 & 2032
- Figure 40: Asia Pacific AG Analytics Market Revenue (Million), by Country 2024 & 2032
- Figure 41: Asia Pacific AG Analytics Market Revenue Share (%), by Country 2024 & 2032
- Figure 42: Latin America AG Analytics Market Revenue (Million), by Component Type 2024 & 2032
- Figure 43: Latin America AG Analytics Market Revenue Share (%), by Component Type 2024 & 2032
- Figure 44: Latin America AG Analytics Market Revenue (Million), by Type 2024 & 2032
- Figure 45: Latin America AG Analytics Market Revenue Share (%), by Type 2024 & 2032
- Figure 46: Latin America AG Analytics Market Revenue (Million), by Deployment Type 2024 & 2032
- Figure 47: Latin America AG Analytics Market Revenue Share (%), by Deployment Type 2024 & 2032
- Figure 48: Latin America AG Analytics Market Revenue (Million), by Farm Size 2024 & 2032
- Figure 49: Latin America AG Analytics Market Revenue Share (%), by Farm Size 2024 & 2032
- Figure 50: Latin America AG Analytics Market Revenue (Million), by Country 2024 & 2032
- Figure 51: Latin America AG Analytics Market Revenue Share (%), by Country 2024 & 2032
- Figure 52: Middle East and Africa AG Analytics Market Revenue (Million), by Component Type 2024 & 2032
- Figure 53: Middle East and Africa AG Analytics Market Revenue Share (%), by Component Type 2024 & 2032
- Figure 54: Middle East and Africa AG Analytics Market Revenue (Million), by Type 2024 & 2032
- Figure 55: Middle East and Africa AG Analytics Market Revenue Share (%), by Type 2024 & 2032
- Figure 56: Middle East and Africa AG Analytics Market Revenue (Million), by Deployment Type 2024 & 2032
- Figure 57: Middle East and Africa AG Analytics Market Revenue Share (%), by Deployment Type 2024 & 2032
- Figure 58: Middle East and Africa AG Analytics Market Revenue (Million), by Farm Size 2024 & 2032
- Figure 59: Middle East and Africa AG Analytics Market Revenue Share (%), by Farm Size 2024 & 2032
- Figure 60: Middle East and Africa AG Analytics Market Revenue (Million), by Country 2024 & 2032
- Figure 61: Middle East and Africa AG Analytics Market Revenue Share (%), by Country 2024 & 2032
List of Tables
- Table 1: Global AG Analytics Market Revenue Million Forecast, by Region 2019 & 2032
- Table 2: Global AG Analytics Market Revenue Million Forecast, by Component Type 2019 & 2032
- Table 3: Global AG Analytics Market Revenue Million Forecast, by Type 2019 & 2032
- Table 4: Global AG Analytics Market Revenue Million Forecast, by Deployment Type 2019 & 2032
- Table 5: Global AG Analytics Market Revenue Million Forecast, by Farm Size 2019 & 2032
- Table 6: Global AG Analytics Market Revenue Million Forecast, by Region 2019 & 2032
- Table 7: Global AG Analytics Market Revenue Million Forecast, by Country 2019 & 2032
- Table 8: AG Analytics Market Revenue (Million) Forecast, by Application 2019 & 2032
- Table 9: Global AG Analytics Market Revenue Million Forecast, by Country 2019 & 2032
- Table 10: AG Analytics Market Revenue (Million) Forecast, by Application 2019 & 2032
- Table 11: Global AG Analytics Market Revenue Million Forecast, by Country 2019 & 2032
- Table 12: AG Analytics Market Revenue (Million) Forecast, by Application 2019 & 2032
- Table 13: Global AG Analytics Market Revenue Million Forecast, by Country 2019 & 2032
- Table 14: AG Analytics Market Revenue (Million) Forecast, by Application 2019 & 2032
- Table 15: Global AG Analytics Market Revenue Million Forecast, by Country 2019 & 2032
- Table 16: AG Analytics Market Revenue (Million) Forecast, by Application 2019 & 2032
- Table 17: Global AG Analytics Market Revenue Million Forecast, by Component Type 2019 & 2032
- Table 18: Global AG Analytics Market Revenue Million Forecast, by Type 2019 & 2032
- Table 19: Global AG Analytics Market Revenue Million Forecast, by Deployment Type 2019 & 2032
- Table 20: Global AG Analytics Market Revenue Million Forecast, by Farm Size 2019 & 2032
- Table 21: Global AG Analytics Market Revenue Million Forecast, by Country 2019 & 2032
- Table 22: Global AG Analytics Market Revenue Million Forecast, by Component Type 2019 & 2032
- Table 23: Global AG Analytics Market Revenue Million Forecast, by Type 2019 & 2032
- Table 24: Global AG Analytics Market Revenue Million Forecast, by Deployment Type 2019 & 2032
- Table 25: Global AG Analytics Market Revenue Million Forecast, by Farm Size 2019 & 2032
- Table 26: Global AG Analytics Market Revenue Million Forecast, by Country 2019 & 2032
- Table 27: Global AG Analytics Market Revenue Million Forecast, by Component Type 2019 & 2032
- Table 28: Global AG Analytics Market Revenue Million Forecast, by Type 2019 & 2032
- Table 29: Global AG Analytics Market Revenue Million Forecast, by Deployment Type 2019 & 2032
- Table 30: Global AG Analytics Market Revenue Million Forecast, by Farm Size 2019 & 2032
- Table 31: Global AG Analytics Market Revenue Million Forecast, by Country 2019 & 2032
- Table 32: Global AG Analytics Market Revenue Million Forecast, by Component Type 2019 & 2032
- Table 33: Global AG Analytics Market Revenue Million Forecast, by Type 2019 & 2032
- Table 34: Global AG Analytics Market Revenue Million Forecast, by Deployment Type 2019 & 2032
- Table 35: Global AG Analytics Market Revenue Million Forecast, by Farm Size 2019 & 2032
- Table 36: Global AG Analytics Market Revenue Million Forecast, by Country 2019 & 2032
- Table 37: Global AG Analytics Market Revenue Million Forecast, by Component Type 2019 & 2032
- Table 38: Global AG Analytics Market Revenue Million Forecast, by Type 2019 & 2032
- Table 39: Global AG Analytics Market Revenue Million Forecast, by Deployment Type 2019 & 2032
- Table 40: Global AG Analytics Market Revenue Million Forecast, by Farm Size 2019 & 2032
- Table 41: Global AG Analytics Market Revenue Million Forecast, by Country 2019 & 2032
Frequently Asked Questions
1. What is the projected Compound Annual Growth Rate (CAGR) of the AG Analytics Market?
The projected CAGR is approximately 14.40%.
2. Which companies are prominent players in the AG Analytics Market?
Key companies in the market include SAS Institute Inc *List Not Exhaustive, Ageagle Aerial Systems Inc, Deere & Company, Bayer AG, IBM Corporation, Conservis Corporation, PrecisionHawk Inc, Trimble Inc, Vistex Inc, Iteris Inc, Agrivi.
3. What are the main segments of the AG Analytics Market?
The market segments include Component Type, Type, Deployment Type, Farm Size.
4. Can you provide details about the market size?
The market size is estimated to be USD XX Million as of 2022.
5. What are some drivers contributing to market growth?
; Rising Usage of Cutting-edge Technology-based Solutions for Farming.
6. What are the notable trends driving market growth?
Farm Analytics is Expected to Grow at a Significant Rate Over the Forecast Period.
7. Are there any restraints impacting market growth?
; High Capital Cost and Complexity Regarding System Upgrades.
8. Can you provide examples of recent developments in the market?
N/A
9. What pricing options are available for accessing the report?
Pricing options include single-user, multi-user, and enterprise licenses priced at USD 4750, USD 5250, and USD 8750 respectively.
10. Is the market size provided in terms of value or volume?
The market size is provided in terms of value, measured in Million.
11. Are there any specific market keywords associated with the report?
Yes, the market keyword associated with the report is "AG Analytics Market," which aids in identifying and referencing the specific market segment covered.
12. How do I determine which pricing option suits my needs best?
The pricing options vary based on user requirements and access needs. Individual users may opt for single-user licenses, while businesses requiring broader access may choose multi-user or enterprise licenses for cost-effective access to the report.
13. Are there any additional resources or data provided in the AG Analytics Market report?
While the report offers comprehensive insights, it's advisable to review the specific contents or supplementary materials provided to ascertain if additional resources or data are available.
14. How can I stay updated on further developments or reports in the AG Analytics Market?
To stay informed about further developments, trends, and reports in the AG Analytics Market, consider subscribing to industry newsletters, following relevant companies and organizations, or regularly checking reputable industry news sources and publications.
Methodology
Step 1 - Identification of Relevant Samples Size from Population Database


Step 2 - Approaches for Defining Global Market Size (Value, Volume* & Price*)

Note*: In applicable scenarios
Step 3 - Data Sources
Primary Research
- Web Analytics
- Survey Reports
- Research Institute
- Latest Research Reports
- Opinion Leaders
Secondary Research
- Annual Reports
- White Paper
- Latest Press Release
- Industry Association
- Paid Database
- Investor Presentations

Step 4 - Data Triangulation
Involves using different sources of information in order to increase the validity of a study
These sources are likely to be stakeholders in a program - participants, other researchers, program staff, other community members, and so on.
Then we put all data in single framework & apply various statistical tools to find out the dynamic on the market.
During the analysis stage, feedback from the stakeholder groups would be compared to determine areas of agreement as well as areas of divergence


