
Key Insights
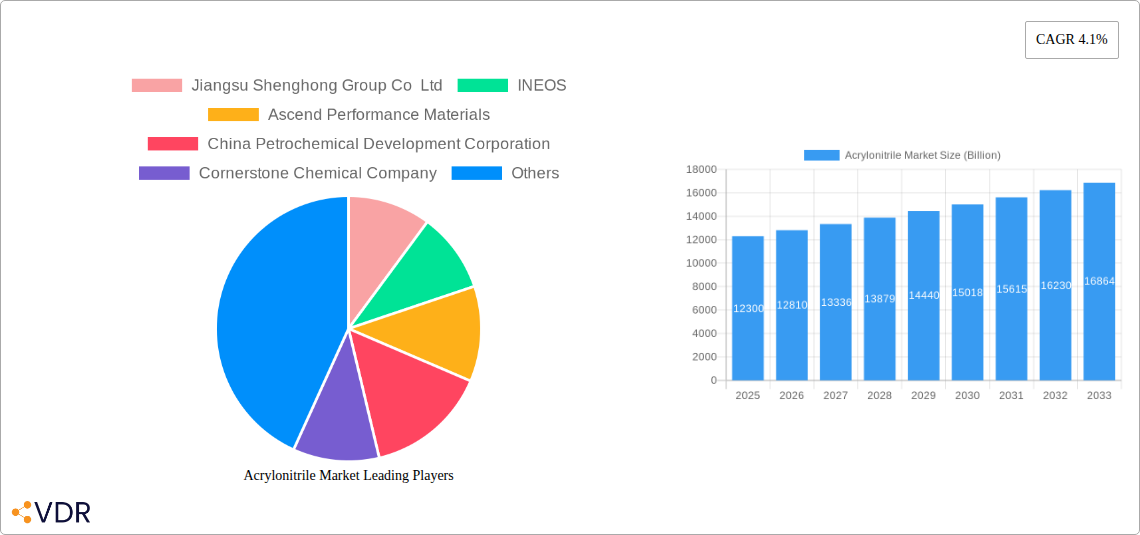
The global acrylonitrile market, valued at $12.3 billion in 2025, is projected to experience steady growth, driven by robust demand across diverse end-use industries. A Compound Annual Growth Rate (CAGR) of 4.1% from 2025 to 2033 indicates a significant expansion potential. Key drivers include the burgeoning construction sector, particularly in developing economies, fueling demand for acrylonitrile-based polymers in building materials. The automotive industry's continued growth, coupled with increasing production of passenger and commercial vehicles, further contributes to market expansion. The packaging sector's reliance on acrylonitrile for producing durable and lightweight materials also plays a vital role. Technological advancements in acrylonitrile production processes, emphasizing efficiency and sustainability, are anticipated to enhance market competitiveness and profitability. However, fluctuating raw material prices and environmental concerns related to acrylonitrile production pose potential restraints. The market is segmented by process technology (Ammoxidation and others), application (Acrylic fiber, ABS/SAN, Acrylamide, NBR, and others), and end-use industry (building & construction, automotive, packaging, electrical & electronics, medical & pharmaceuticals, textiles, and others). Leading players like Jiangsu Shenghong, INEOS, and Ascend Performance Materials are actively shaping the market landscape through strategic expansions and technological innovations. Regional analysis reveals strong growth in Asia-Pacific, driven by substantial industrialization and infrastructural development in countries like China and India.
The market's growth trajectory is influenced by several factors. The increasing adoption of sustainable building practices and the rise in demand for high-performance materials in the automotive sector will contribute to higher demand for acrylonitrile. Conversely, potential regulatory changes concerning the environmental impact of acrylonitrile production and fluctuations in crude oil prices could impede growth. The market's future hinges on balancing the demand driven by emerging economies and the need for environmentally friendly manufacturing processes. Companies are likely to invest heavily in research and development to optimize production methods, reduce waste, and improve the sustainability profile of acrylonitrile-based products. Furthermore, strategic collaborations and mergers & acquisitions are expected to consolidate the market share among key players. A deeper understanding of these dynamics is critical for businesses navigating this dynamic market environment.
Acrylonitrile Market: A Comprehensive Report (2019-2033)
This comprehensive report provides an in-depth analysis of the global acrylonitrile market, encompassing market dynamics, growth trends, regional segmentation, product landscape, key players, and future outlook. With a focus on the parent market (chemical intermediates) and child markets (acrylonitrile derivatives), this study offers invaluable insights for industry professionals, investors, and stakeholders seeking to navigate this dynamic sector. The report covers the period from 2019 to 2033, with 2025 as the base year and forecast period from 2025-2033. The total market size is projected to reach XX Billion by 2033.
Acrylonitrile Market Dynamics & Structure
The global acrylonitrile market is characterized by a moderately concentrated structure, with key players like Jiangsu Shenghong Group Co Ltd, INEOS, and Ascend Performance Materials holding significant market shares. Technological innovation, primarily driven by the pursuit of sustainable production methods and enhanced product performance, is a key driver. Stringent environmental regulations are shaping production processes, pushing companies towards more eco-friendly alternatives. The market faces competition from substitute materials in specific applications, impacting overall demand. M&A activity has been moderate, with strategic partnerships and acquisitions shaping the competitive landscape.
- Market Concentration: Moderately concentrated, with top 5 players holding approximately xx% of the market share in 2024.
- Technological Innovation: Focus on improving efficiency of Ammoxidation Process and exploring sustainable alternatives like bio-attributed acrylonitrile.
- Regulatory Framework: Increasingly stringent environmental regulations impacting production methods and driving innovation in waste reduction.
- Competitive Substitutes: Competition from alternative materials in specific applications like polyvinyl chloride (PVC) for certain segments in building & construction.
- M&A Trends: Moderate M&A activity observed, with strategic partnerships focused on technology transfer and market expansion.
Acrylonitrile Market Growth Trends & Insights
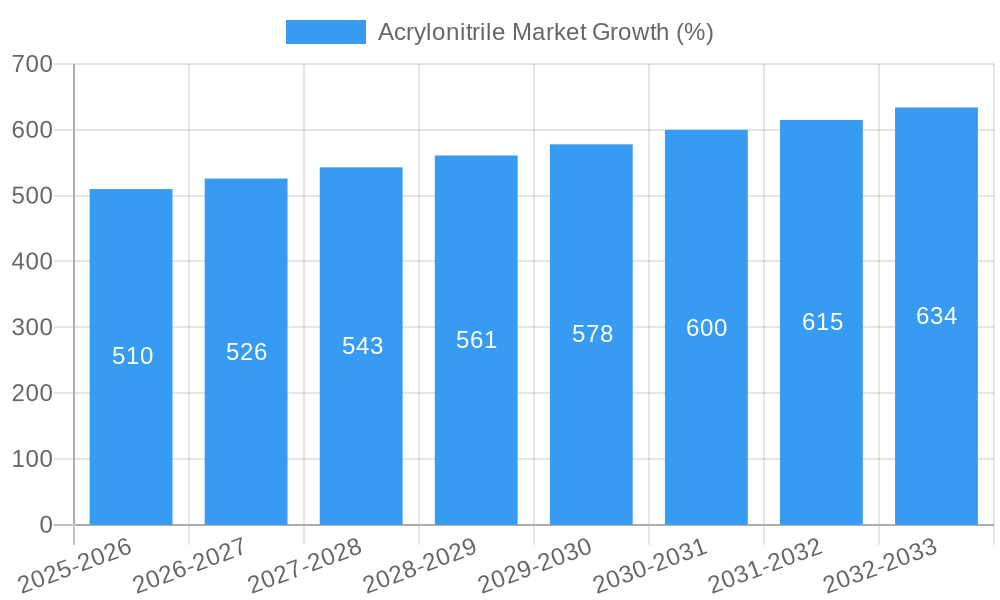
The acrylonitrile market has witnessed significant growth during the historical period (2019-2024), driven by the robust expansion of downstream industries. The increasing demand for acrylonitrile-based products across diverse applications, such as acrylic fibers, ABS/SAN resins, and nitrile rubber, has propelled market expansion. Technological advancements in production processes, along with continuous innovations in product formulations to enhance performance and sustainability, have further stimulated growth. The market is expected to maintain a steady Compound Annual Growth Rate (CAGR) of xx% during the forecast period (2025-2033). This growth is anticipated to be driven by several factors, including the rising global population, increasing urbanization, expanding automotive and construction industries, as well as the growing adoption of sustainable and eco-friendly materials. However, factors like fluctuating raw material prices and economic downturns could pose challenges. Market penetration in emerging economies remains a substantial growth opportunity. The shift in consumer preferences towards sustainable and recyclable products is driving demand for bio-based acrylonitrile, presenting both challenges and opportunities for market players.
Dominant Regions, Countries, or Segments in Acrylonitrile Market
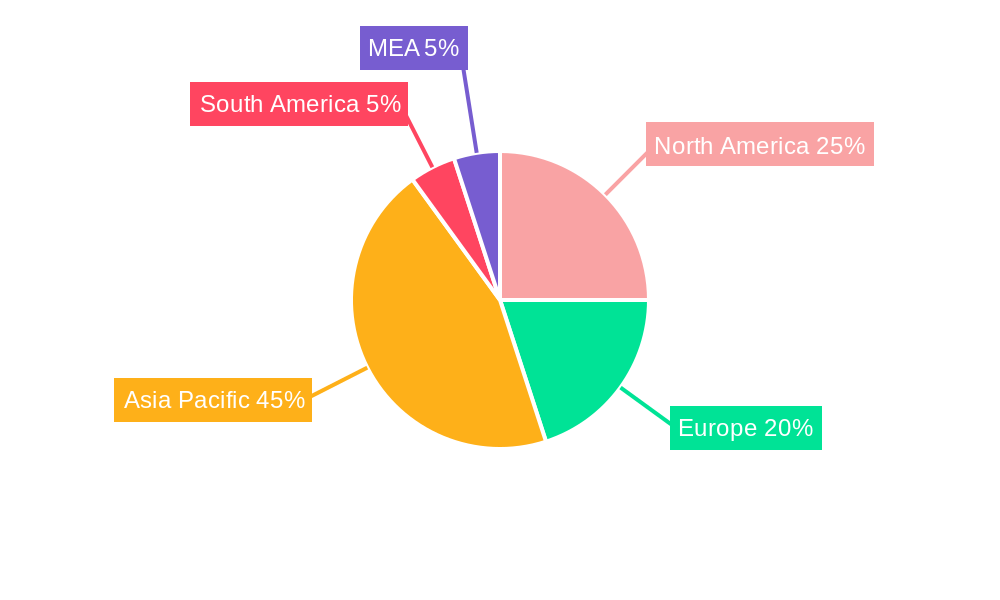
Asia-Pacific, particularly China, currently dominates the acrylonitrile market, driven by the region's rapid industrialization and substantial demand from downstream sectors like textiles and construction. Within the application segments, Acrylic Fiber holds the largest market share, followed by Acrylonitrile Butadiene Styrene (ABS)/Styrene-Acrylonitrile Resin (SAN). The Ammoxidation Process remains the dominant production technology.
Key Drivers:
- Rapid Industrialization in Asia-Pacific: Significant growth in construction, automotive, and textile industries driving demand.
- Increasing Infrastructure Development: Investments in infrastructure projects across emerging economies boosting demand.
- Expanding Automotive Industry: Growing vehicle production, especially in Asia, fueling demand for ABS/SAN resins.
Dominance Factors:
- High Production Capacity: Asia-Pacific boasts a significant share of global acrylonitrile production capacity.
- Favorable Economic Policies: Government support for industrial development promoting growth.
- Low Labor Costs: Competitive labor costs contributing to lower production costs.
Acrylonitrile Market Product Landscape
Acrylonitrile products are continuously evolving, with a focus on enhanced performance, sustainability, and cost-effectiveness. Innovations include bio-attributed acrylonitrile, offering a more environmentally friendly alternative. Product development is driven by tailoring acrylonitrile properties for specific applications, such as improved strength, durability, and heat resistance. Key performance metrics include purity, polymerization characteristics, and environmental impact.
Key Drivers, Barriers & Challenges in Acrylonitrile Market
Key Drivers: Growing demand from downstream industries, particularly construction and automotive; increasing urbanization and infrastructure development; technological advancements improving efficiency and sustainability; government policies supporting industrial growth.
Key Challenges: Fluctuations in raw material prices (propylene and ammonia); stringent environmental regulations; intense competition among existing players and potential entry of new players; supply chain disruptions; geopolitical instability.
Emerging Opportunities in Acrylonitrile Market
Growing demand for sustainable and bio-based materials presents significant opportunities. Untapped markets in developing economies offer considerable potential for growth. Innovative applications in advanced materials, such as high-performance polymers and composites, are emerging. Tailoring acrylonitrile products for specific niche applications could also unlock new revenue streams.
Growth Accelerators in the Acrylonitrile Market Industry
Technological breakthroughs in production processes, leading to increased efficiency and reduced environmental impact, will accelerate growth. Strategic partnerships and collaborations to develop innovative products and expand market reach are crucial. Expanding into new and emerging markets, especially in developing economies, presents significant growth opportunities. Focus on sustainable and eco-friendly production methods will appeal to environmentally conscious consumers and governments.
Key Players Shaping the Acrylonitrile Market Market
- Jiangsu Shenghong Group Co Ltd
- INEOS
- Ascend Performance Materials
- China Petrochemical Development Corporation
- Cornerstone Chemical Company
- Taekwang Industrial Co Ltd
- AnQore
- Asahi Kasei Advance Corporation
- Formosa Plastics Corp
- China Petroleum & Chemical Corporation (SINOPEC)
- PetroChina (CNPC)
- SOCAR (Petkim Petrokimya Holding A)
Notable Milestones in Acrylonitrile Market Sector
February 2024: The Mitsubishi Chemical Group announced the discontinuation of MMA monomer production by the ACH process and the production of acrylonitrile and acrylonitrile derivatives at the Mitsubishi Chemical Hiroshima Plant (Otake City, Hiroshima Prefecture). This shift in production focus indicates a strategic realignment towards acrylonitrile.
November 2023: China Petrochemical Development Corp in Taiwan resumed production at two acrylonitrile production lines located in Kaohsiung, Taiwan. This signals a recovery in production capacity and potential increase in market supply.
June 2023: INEOS Nitriles launched its first bio-attributed product line for acrylonitrile. This marks a significant step towards sustainable acrylonitrile production and caters to growing demand for eco-friendly materials.
February 2023: Sumitomo Chemical Co. Ltd obtained its first ISCC PLUS certification for acrylonitrile produced at its Ehime Works in Japan. This certification enhances the credibility and market appeal of Sumitomo's sustainably produced acrylonitrile.
In-Depth Acrylonitrile Market Market Outlook
The acrylonitrile market is poised for sustained growth, fueled by ongoing industrial expansion, particularly in emerging economies. Strategic investments in research and development, focusing on sustainable production and innovative applications, will be crucial for maintaining a competitive edge. Companies that successfully navigate the challenges of fluctuating raw material prices and stringent regulations will be best positioned to capitalize on emerging opportunities and dominate the market. The focus on bio-based and recycled acrylonitrile will continue to shape the market landscape, driving long-term growth and sustainability.
Acrylonitrile Market Segmentation
-
1. Process Technology
- 1.1. Ammoxidation Process
- 1.2. Other Production Processes
-
2. Application
- 2.1. Acrylic Fiber
- 2.2. Acryloni
- 2.3. Acrylamide
- 2.4. Nitrile Butadiene Rubber (NBR)
- 2.5. Other Applications
Acrylonitrile Market Segmentation By Geography
-
1. Asia Pacific
- 1.1. China
- 1.2. India
- 1.3. Japan
- 1.4. South Korea
- 1.5. Rest of Asia Pacific
-
2. North America
- 2.1. United States
- 2.2. Canada
-
3. Europe
- 3.1. Germany
- 3.2. United Kingdom
- 3.3. Italy
- 3.4. France
- 3.5. Russia
- 3.6. Rest of Europe
-
4. Latin America
- 4.1. Brazil
- 4.2. Argentina
- 4.3. Colombia
- 4.4. Rest of Latin America
- 5. Middle East and Africa
Acrylonitrile Market REPORT HIGHLIGHTS
| Aspects | Details |
|---|---|
| Study Period | 2019-2033 |
| Base Year | 2024 |
| Estimated Year | 2025 |
| Forecast Period | 2025-2033 |
| Historical Period | 2019-2024 |
| Growth Rate | CAGR of 4.1% from 2019-2033 |
| Segmentation |
|
Table of Contents
- 1. Introduction
- 1.1. Research Scope
- 1.2. Market Segmentation
- 1.3. Research Methodology
- 1.4. Definitions and Assumptions
- 2. Executive Summary
- 2.1. Introduction
- 3. Market Dynamics
- 3.1. Introduction
- 3.2. Market Drivers
- 3.2.1. Increasing Demand for Acrylonitrile Butadiene Styrene (ABS) in the Automotive and Construction Industries; Growing Textile Industry
- 3.3. Market Restrains
- 3.3.1. Toxicity and Regulations of Acrylonitrile; Other Restraints
- 3.4. Market Trends
- 3.4.1. The Demand for Acrylonitrile for Acrylonitrile Butadiene Styrene (ABS) is Rising
- 4. Market Factor Analysis
- 4.1. Porters Five Forces
- 4.2. Supply/Value Chain
- 4.3. PESTEL analysis
- 4.4. Market Entropy
- 4.5. Patent/Trademark Analysis
- 5. Global Acrylonitrile Market Analysis, Insights and Forecast, 2019-2031
- 5.1. Market Analysis, Insights and Forecast - by Process Technology
- 5.1.1. Ammoxidation Process
- 5.1.2. Other Production Processes
- 5.2. Market Analysis, Insights and Forecast - by Application
- 5.2.1. Acrylic Fiber
- 5.2.2. Acryloni
- 5.2.3. Acrylamide
- 5.2.4. Nitrile Butadiene Rubber (NBR)
- 5.2.5. Other Applications
- 5.3. Market Analysis, Insights and Forecast - by Region
- 5.3.1. Asia Pacific
- 5.3.2. North America
- 5.3.3. Europe
- 5.3.4. Latin America
- 5.3.5. Middle East and Africa
- 5.1. Market Analysis, Insights and Forecast - by Process Technology
- 6. Asia Pacific Acrylonitrile Market Analysis, Insights and Forecast, 2019-2031
- 6.1. Market Analysis, Insights and Forecast - by Process Technology
- 6.1.1. Ammoxidation Process
- 6.1.2. Other Production Processes
- 6.2. Market Analysis, Insights and Forecast - by Application
- 6.2.1. Acrylic Fiber
- 6.2.2. Acryloni
- 6.2.3. Acrylamide
- 6.2.4. Nitrile Butadiene Rubber (NBR)
- 6.2.5. Other Applications
- 6.1. Market Analysis, Insights and Forecast - by Process Technology
- 7. North America Acrylonitrile Market Analysis, Insights and Forecast, 2019-2031
- 7.1. Market Analysis, Insights and Forecast - by Process Technology
- 7.1.1. Ammoxidation Process
- 7.1.2. Other Production Processes
- 7.2. Market Analysis, Insights and Forecast - by Application
- 7.2.1. Acrylic Fiber
- 7.2.2. Acryloni
- 7.2.3. Acrylamide
- 7.2.4. Nitrile Butadiene Rubber (NBR)
- 7.2.5. Other Applications
- 7.1. Market Analysis, Insights and Forecast - by Process Technology
- 8. Europe Acrylonitrile Market Analysis, Insights and Forecast, 2019-2031
- 8.1. Market Analysis, Insights and Forecast - by Process Technology
- 8.1.1. Ammoxidation Process
- 8.1.2. Other Production Processes
- 8.2. Market Analysis, Insights and Forecast - by Application
- 8.2.1. Acrylic Fiber
- 8.2.2. Acryloni
- 8.2.3. Acrylamide
- 8.2.4. Nitrile Butadiene Rubber (NBR)
- 8.2.5. Other Applications
- 8.1. Market Analysis, Insights and Forecast - by Process Technology
- 9. Latin America Acrylonitrile Market Analysis, Insights and Forecast, 2019-2031
- 9.1. Market Analysis, Insights and Forecast - by Process Technology
- 9.1.1. Ammoxidation Process
- 9.1.2. Other Production Processes
- 9.2. Market Analysis, Insights and Forecast - by Application
- 9.2.1. Acrylic Fiber
- 9.2.2. Acryloni
- 9.2.3. Acrylamide
- 9.2.4. Nitrile Butadiene Rubber (NBR)
- 9.2.5. Other Applications
- 9.1. Market Analysis, Insights and Forecast - by Process Technology
- 10. Middle East and Africa Acrylonitrile Market Analysis, Insights and Forecast, 2019-2031
- 10.1. Market Analysis, Insights and Forecast - by Process Technology
- 10.1.1. Ammoxidation Process
- 10.1.2. Other Production Processes
- 10.2. Market Analysis, Insights and Forecast - by Application
- 10.2.1. Acrylic Fiber
- 10.2.2. Acryloni
- 10.2.3. Acrylamide
- 10.2.4. Nitrile Butadiene Rubber (NBR)
- 10.2.5. Other Applications
- 10.1. Market Analysis, Insights and Forecast - by Process Technology
- 11. North America Acrylonitrile Market Analysis, Insights and Forecast, 2019-2031
- 11.1. Market Analysis, Insights and Forecast - By Country/Sub-region
- 11.1.1 United States
- 11.1.2 Canada
- 11.1.3 Mexico
- 12. Europe Acrylonitrile Market Analysis, Insights and Forecast, 2019-2031
- 12.1. Market Analysis, Insights and Forecast - By Country/Sub-region
- 12.1.1 Germany
- 12.1.2 France
- 12.1.3 Italy
- 12.1.4 United Kingdom
- 12.1.5 Netherlands
- 12.1.6 Rest of Europe
- 13. Asia Pacific Acrylonitrile Market Analysis, Insights and Forecast, 2019-2031
- 13.1. Market Analysis, Insights and Forecast - By Country/Sub-region
- 13.1.1 China
- 13.1.2 Japan
- 13.1.3 India
- 13.1.4 South Korea
- 13.1.5 Taiwan
- 13.1.6 Australia
- 13.1.7 Rest of Asia-Pacific
- 14. South America Acrylonitrile Market Analysis, Insights and Forecast, 2019-2031
- 14.1. Market Analysis, Insights and Forecast - By Country/Sub-region
- 14.1.1 Brazil
- 14.1.2 Argentina
- 14.1.3 Rest of South America
- 15. MEA Acrylonitrile Market Analysis, Insights and Forecast, 2019-2031
- 15.1. Market Analysis, Insights and Forecast - By Country/Sub-region
- 15.1.1 Middle East
- 15.1.2 Africa
- 16. Competitive Analysis
- 16.1. Global Market Share Analysis 2024
- 16.2. Company Profiles
- 16.2.1 Jiangsu Shenghong Group Co Ltd
- 16.2.1.1. Overview
- 16.2.1.2. Products
- 16.2.1.3. SWOT Analysis
- 16.2.1.4. Recent Developments
- 16.2.1.5. Financials (Based on Availability)
- 16.2.2 INEOS
- 16.2.2.1. Overview
- 16.2.2.2. Products
- 16.2.2.3. SWOT Analysis
- 16.2.2.4. Recent Developments
- 16.2.2.5. Financials (Based on Availability)
- 16.2.3 Ascend Performance Materials
- 16.2.3.1. Overview
- 16.2.3.2. Products
- 16.2.3.3. SWOT Analysis
- 16.2.3.4. Recent Developments
- 16.2.3.5. Financials (Based on Availability)
- 16.2.4 China Petrochemical Development Corporation
- 16.2.4.1. Overview
- 16.2.4.2. Products
- 16.2.4.3. SWOT Analysis
- 16.2.4.4. Recent Developments
- 16.2.4.5. Financials (Based on Availability)
- 16.2.5 Cornerstone Chemical Company
- 16.2.5.1. Overview
- 16.2.5.2. Products
- 16.2.5.3. SWOT Analysis
- 16.2.5.4. Recent Developments
- 16.2.5.5. Financials (Based on Availability)
- 16.2.6 Taekwang Industrial Co Ltd
- 16.2.6.1. Overview
- 16.2.6.2. Products
- 16.2.6.3. SWOT Analysis
- 16.2.6.4. Recent Developments
- 16.2.6.5. Financials (Based on Availability)
- 16.2.7 AnQore
- 16.2.7.1. Overview
- 16.2.7.2. Products
- 16.2.7.3. SWOT Analysis
- 16.2.7.4. Recent Developments
- 16.2.7.5. Financials (Based on Availability)
- 16.2.8 Asahi Kasei Advance Corporation
- 16.2.8.1. Overview
- 16.2.8.2. Products
- 16.2.8.3. SWOT Analysis
- 16.2.8.4. Recent Developments
- 16.2.8.5. Financials (Based on Availability)
- 16.2.9 Formosa Plastics Corp
- 16.2.9.1. Overview
- 16.2.9.2. Products
- 16.2.9.3. SWOT Analysis
- 16.2.9.4. Recent Developments
- 16.2.9.5. Financials (Based on Availability)
- 16.2.10 China Petroleum & Chemical Corporation (SINOPEC)
- 16.2.10.1. Overview
- 16.2.10.2. Products
- 16.2.10.3. SWOT Analysis
- 16.2.10.4. Recent Developments
- 16.2.10.5. Financials (Based on Availability)
- 16.2.11 PetroChina (CNPC)
- 16.2.11.1. Overview
- 16.2.11.2. Products
- 16.2.11.3. SWOT Analysis
- 16.2.11.4. Recent Developments
- 16.2.11.5. Financials (Based on Availability)
- 16.2.12 SOCAR (Petkim Petrokimya Holding A)
- 16.2.12.1. Overview
- 16.2.12.2. Products
- 16.2.12.3. SWOT Analysis
- 16.2.12.4. Recent Developments
- 16.2.12.5. Financials (Based on Availability)
- 16.2.1 Jiangsu Shenghong Group Co Ltd
List of Figures
- Figure 1: Global Acrylonitrile Market Revenue Breakdown (Billion, %) by Region 2024 & 2032
- Figure 2: Global Acrylonitrile Market Volume Breakdown (K Tons, %) by Region 2024 & 2032
- Figure 3: North America Acrylonitrile Market Revenue (Billion), by Country 2024 & 2032
- Figure 4: North America Acrylonitrile Market Volume (K Tons), by Country 2024 & 2032
- Figure 5: North America Acrylonitrile Market Revenue Share (%), by Country 2024 & 2032
- Figure 6: North America Acrylonitrile Market Volume Share (%), by Country 2024 & 2032
- Figure 7: Europe Acrylonitrile Market Revenue (Billion), by Country 2024 & 2032
- Figure 8: Europe Acrylonitrile Market Volume (K Tons), by Country 2024 & 2032
- Figure 9: Europe Acrylonitrile Market Revenue Share (%), by Country 2024 & 2032
- Figure 10: Europe Acrylonitrile Market Volume Share (%), by Country 2024 & 2032
- Figure 11: Asia Pacific Acrylonitrile Market Revenue (Billion), by Country 2024 & 2032
- Figure 12: Asia Pacific Acrylonitrile Market Volume (K Tons), by Country 2024 & 2032
- Figure 13: Asia Pacific Acrylonitrile Market Revenue Share (%), by Country 2024 & 2032
- Figure 14: Asia Pacific Acrylonitrile Market Volume Share (%), by Country 2024 & 2032
- Figure 15: South America Acrylonitrile Market Revenue (Billion), by Country 2024 & 2032
- Figure 16: South America Acrylonitrile Market Volume (K Tons), by Country 2024 & 2032
- Figure 17: South America Acrylonitrile Market Revenue Share (%), by Country 2024 & 2032
- Figure 18: South America Acrylonitrile Market Volume Share (%), by Country 2024 & 2032
- Figure 19: MEA Acrylonitrile Market Revenue (Billion), by Country 2024 & 2032
- Figure 20: MEA Acrylonitrile Market Volume (K Tons), by Country 2024 & 2032
- Figure 21: MEA Acrylonitrile Market Revenue Share (%), by Country 2024 & 2032
- Figure 22: MEA Acrylonitrile Market Volume Share (%), by Country 2024 & 2032
- Figure 23: Asia Pacific Acrylonitrile Market Revenue (Billion), by Process Technology 2024 & 2032
- Figure 24: Asia Pacific Acrylonitrile Market Volume (K Tons), by Process Technology 2024 & 2032
- Figure 25: Asia Pacific Acrylonitrile Market Revenue Share (%), by Process Technology 2024 & 2032
- Figure 26: Asia Pacific Acrylonitrile Market Volume Share (%), by Process Technology 2024 & 2032
- Figure 27: Asia Pacific Acrylonitrile Market Revenue (Billion), by Application 2024 & 2032
- Figure 28: Asia Pacific Acrylonitrile Market Volume (K Tons), by Application 2024 & 2032
- Figure 29: Asia Pacific Acrylonitrile Market Revenue Share (%), by Application 2024 & 2032
- Figure 30: Asia Pacific Acrylonitrile Market Volume Share (%), by Application 2024 & 2032
- Figure 31: Asia Pacific Acrylonitrile Market Revenue (Billion), by Country 2024 & 2032
- Figure 32: Asia Pacific Acrylonitrile Market Volume (K Tons), by Country 2024 & 2032
- Figure 33: Asia Pacific Acrylonitrile Market Revenue Share (%), by Country 2024 & 2032
- Figure 34: Asia Pacific Acrylonitrile Market Volume Share (%), by Country 2024 & 2032
- Figure 35: North America Acrylonitrile Market Revenue (Billion), by Process Technology 2024 & 2032
- Figure 36: North America Acrylonitrile Market Volume (K Tons), by Process Technology 2024 & 2032
- Figure 37: North America Acrylonitrile Market Revenue Share (%), by Process Technology 2024 & 2032
- Figure 38: North America Acrylonitrile Market Volume Share (%), by Process Technology 2024 & 2032
- Figure 39: North America Acrylonitrile Market Revenue (Billion), by Application 2024 & 2032
- Figure 40: North America Acrylonitrile Market Volume (K Tons), by Application 2024 & 2032
- Figure 41: North America Acrylonitrile Market Revenue Share (%), by Application 2024 & 2032
- Figure 42: North America Acrylonitrile Market Volume Share (%), by Application 2024 & 2032
- Figure 43: North America Acrylonitrile Market Revenue (Billion), by Country 2024 & 2032
- Figure 44: North America Acrylonitrile Market Volume (K Tons), by Country 2024 & 2032
- Figure 45: North America Acrylonitrile Market Revenue Share (%), by Country 2024 & 2032
- Figure 46: North America Acrylonitrile Market Volume Share (%), by Country 2024 & 2032
- Figure 47: Europe Acrylonitrile Market Revenue (Billion), by Process Technology 2024 & 2032
- Figure 48: Europe Acrylonitrile Market Volume (K Tons), by Process Technology 2024 & 2032
- Figure 49: Europe Acrylonitrile Market Revenue Share (%), by Process Technology 2024 & 2032
- Figure 50: Europe Acrylonitrile Market Volume Share (%), by Process Technology 2024 & 2032
- Figure 51: Europe Acrylonitrile Market Revenue (Billion), by Application 2024 & 2032
- Figure 52: Europe Acrylonitrile Market Volume (K Tons), by Application 2024 & 2032
- Figure 53: Europe Acrylonitrile Market Revenue Share (%), by Application 2024 & 2032
- Figure 54: Europe Acrylonitrile Market Volume Share (%), by Application 2024 & 2032
- Figure 55: Europe Acrylonitrile Market Revenue (Billion), by Country 2024 & 2032
- Figure 56: Europe Acrylonitrile Market Volume (K Tons), by Country 2024 & 2032
- Figure 57: Europe Acrylonitrile Market Revenue Share (%), by Country 2024 & 2032
- Figure 58: Europe Acrylonitrile Market Volume Share (%), by Country 2024 & 2032
- Figure 59: Latin America Acrylonitrile Market Revenue (Billion), by Process Technology 2024 & 2032
- Figure 60: Latin America Acrylonitrile Market Volume (K Tons), by Process Technology 2024 & 2032
- Figure 61: Latin America Acrylonitrile Market Revenue Share (%), by Process Technology 2024 & 2032
- Figure 62: Latin America Acrylonitrile Market Volume Share (%), by Process Technology 2024 & 2032
- Figure 63: Latin America Acrylonitrile Market Revenue (Billion), by Application 2024 & 2032
- Figure 64: Latin America Acrylonitrile Market Volume (K Tons), by Application 2024 & 2032
- Figure 65: Latin America Acrylonitrile Market Revenue Share (%), by Application 2024 & 2032
- Figure 66: Latin America Acrylonitrile Market Volume Share (%), by Application 2024 & 2032
- Figure 67: Latin America Acrylonitrile Market Revenue (Billion), by Country 2024 & 2032
- Figure 68: Latin America Acrylonitrile Market Volume (K Tons), by Country 2024 & 2032
- Figure 69: Latin America Acrylonitrile Market Revenue Share (%), by Country 2024 & 2032
- Figure 70: Latin America Acrylonitrile Market Volume Share (%), by Country 2024 & 2032
- Figure 71: Middle East and Africa Acrylonitrile Market Revenue (Billion), by Process Technology 2024 & 2032
- Figure 72: Middle East and Africa Acrylonitrile Market Volume (K Tons), by Process Technology 2024 & 2032
- Figure 73: Middle East and Africa Acrylonitrile Market Revenue Share (%), by Process Technology 2024 & 2032
- Figure 74: Middle East and Africa Acrylonitrile Market Volume Share (%), by Process Technology 2024 & 2032
- Figure 75: Middle East and Africa Acrylonitrile Market Revenue (Billion), by Application 2024 & 2032
- Figure 76: Middle East and Africa Acrylonitrile Market Volume (K Tons), by Application 2024 & 2032
- Figure 77: Middle East and Africa Acrylonitrile Market Revenue Share (%), by Application 2024 & 2032
- Figure 78: Middle East and Africa Acrylonitrile Market Volume Share (%), by Application 2024 & 2032
- Figure 79: Middle East and Africa Acrylonitrile Market Revenue (Billion), by Country 2024 & 2032
- Figure 80: Middle East and Africa Acrylonitrile Market Volume (K Tons), by Country 2024 & 2032
- Figure 81: Middle East and Africa Acrylonitrile Market Revenue Share (%), by Country 2024 & 2032
- Figure 82: Middle East and Africa Acrylonitrile Market Volume Share (%), by Country 2024 & 2032
List of Tables
- Table 1: Global Acrylonitrile Market Revenue Billion Forecast, by Region 2019 & 2032
- Table 2: Global Acrylonitrile Market Volume K Tons Forecast, by Region 2019 & 2032
- Table 3: Global Acrylonitrile Market Revenue Billion Forecast, by Process Technology 2019 & 2032
- Table 4: Global Acrylonitrile Market Volume K Tons Forecast, by Process Technology 2019 & 2032
- Table 5: Global Acrylonitrile Market Revenue Billion Forecast, by Application 2019 & 2032
- Table 6: Global Acrylonitrile Market Volume K Tons Forecast, by Application 2019 & 2032
- Table 7: Global Acrylonitrile Market Revenue Billion Forecast, by Region 2019 & 2032
- Table 8: Global Acrylonitrile Market Volume K Tons Forecast, by Region 2019 & 2032
- Table 9: Global Acrylonitrile Market Revenue Billion Forecast, by Country 2019 & 2032
- Table 10: Global Acrylonitrile Market Volume K Tons Forecast, by Country 2019 & 2032
- Table 11: United States Acrylonitrile Market Revenue (Billion) Forecast, by Application 2019 & 2032
- Table 12: United States Acrylonitrile Market Volume (K Tons) Forecast, by Application 2019 & 2032
- Table 13: Canada Acrylonitrile Market Revenue (Billion) Forecast, by Application 2019 & 2032
- Table 14: Canada Acrylonitrile Market Volume (K Tons) Forecast, by Application 2019 & 2032
- Table 15: Mexico Acrylonitrile Market Revenue (Billion) Forecast, by Application 2019 & 2032
- Table 16: Mexico Acrylonitrile Market Volume (K Tons) Forecast, by Application 2019 & 2032
- Table 17: Global Acrylonitrile Market Revenue Billion Forecast, by Country 2019 & 2032
- Table 18: Global Acrylonitrile Market Volume K Tons Forecast, by Country 2019 & 2032
- Table 19: Germany Acrylonitrile Market Revenue (Billion) Forecast, by Application 2019 & 2032
- Table 20: Germany Acrylonitrile Market Volume (K Tons) Forecast, by Application 2019 & 2032
- Table 21: France Acrylonitrile Market Revenue (Billion) Forecast, by Application 2019 & 2032
- Table 22: France Acrylonitrile Market Volume (K Tons) Forecast, by Application 2019 & 2032
- Table 23: Italy Acrylonitrile Market Revenue (Billion) Forecast, by Application 2019 & 2032
- Table 24: Italy Acrylonitrile Market Volume (K Tons) Forecast, by Application 2019 & 2032
- Table 25: United Kingdom Acrylonitrile Market Revenue (Billion) Forecast, by Application 2019 & 2032
- Table 26: United Kingdom Acrylonitrile Market Volume (K Tons) Forecast, by Application 2019 & 2032
- Table 27: Netherlands Acrylonitrile Market Revenue (Billion) Forecast, by Application 2019 & 2032
- Table 28: Netherlands Acrylonitrile Market Volume (K Tons) Forecast, by Application 2019 & 2032
- Table 29: Rest of Europe Acrylonitrile Market Revenue (Billion) Forecast, by Application 2019 & 2032
- Table 30: Rest of Europe Acrylonitrile Market Volume (K Tons) Forecast, by Application 2019 & 2032
- Table 31: Global Acrylonitrile Market Revenue Billion Forecast, by Country 2019 & 2032
- Table 32: Global Acrylonitrile Market Volume K Tons Forecast, by Country 2019 & 2032
- Table 33: China Acrylonitrile Market Revenue (Billion) Forecast, by Application 2019 & 2032
- Table 34: China Acrylonitrile Market Volume (K Tons) Forecast, by Application 2019 & 2032
- Table 35: Japan Acrylonitrile Market Revenue (Billion) Forecast, by Application 2019 & 2032
- Table 36: Japan Acrylonitrile Market Volume (K Tons) Forecast, by Application 2019 & 2032
- Table 37: India Acrylonitrile Market Revenue (Billion) Forecast, by Application 2019 & 2032
- Table 38: India Acrylonitrile Market Volume (K Tons) Forecast, by Application 2019 & 2032
- Table 39: South Korea Acrylonitrile Market Revenue (Billion) Forecast, by Application 2019 & 2032
- Table 40: South Korea Acrylonitrile Market Volume (K Tons) Forecast, by Application 2019 & 2032
- Table 41: Taiwan Acrylonitrile Market Revenue (Billion) Forecast, by Application 2019 & 2032
- Table 42: Taiwan Acrylonitrile Market Volume (K Tons) Forecast, by Application 2019 & 2032
- Table 43: Australia Acrylonitrile Market Revenue (Billion) Forecast, by Application 2019 & 2032
- Table 44: Australia Acrylonitrile Market Volume (K Tons) Forecast, by Application 2019 & 2032
- Table 45: Rest of Asia-Pacific Acrylonitrile Market Revenue (Billion) Forecast, by Application 2019 & 2032
- Table 46: Rest of Asia-Pacific Acrylonitrile Market Volume (K Tons) Forecast, by Application 2019 & 2032
- Table 47: Global Acrylonitrile Market Revenue Billion Forecast, by Country 2019 & 2032
- Table 48: Global Acrylonitrile Market Volume K Tons Forecast, by Country 2019 & 2032
- Table 49: Brazil Acrylonitrile Market Revenue (Billion) Forecast, by Application 2019 & 2032
- Table 50: Brazil Acrylonitrile Market Volume (K Tons) Forecast, by Application 2019 & 2032
- Table 51: Argentina Acrylonitrile Market Revenue (Billion) Forecast, by Application 2019 & 2032
- Table 52: Argentina Acrylonitrile Market Volume (K Tons) Forecast, by Application 2019 & 2032
- Table 53: Rest of South America Acrylonitrile Market Revenue (Billion) Forecast, by Application 2019 & 2032
- Table 54: Rest of South America Acrylonitrile Market Volume (K Tons) Forecast, by Application 2019 & 2032
- Table 55: Global Acrylonitrile Market Revenue Billion Forecast, by Country 2019 & 2032
- Table 56: Global Acrylonitrile Market Volume K Tons Forecast, by Country 2019 & 2032
- Table 57: Middle East Acrylonitrile Market Revenue (Billion) Forecast, by Application 2019 & 2032
- Table 58: Middle East Acrylonitrile Market Volume (K Tons) Forecast, by Application 2019 & 2032
- Table 59: Africa Acrylonitrile Market Revenue (Billion) Forecast, by Application 2019 & 2032
- Table 60: Africa Acrylonitrile Market Volume (K Tons) Forecast, by Application 2019 & 2032
- Table 61: Global Acrylonitrile Market Revenue Billion Forecast, by Process Technology 2019 & 2032
- Table 62: Global Acrylonitrile Market Volume K Tons Forecast, by Process Technology 2019 & 2032
- Table 63: Global Acrylonitrile Market Revenue Billion Forecast, by Application 2019 & 2032
- Table 64: Global Acrylonitrile Market Volume K Tons Forecast, by Application 2019 & 2032
- Table 65: Global Acrylonitrile Market Revenue Billion Forecast, by Country 2019 & 2032
- Table 66: Global Acrylonitrile Market Volume K Tons Forecast, by Country 2019 & 2032
- Table 67: China Acrylonitrile Market Revenue (Billion) Forecast, by Application 2019 & 2032
- Table 68: China Acrylonitrile Market Volume (K Tons) Forecast, by Application 2019 & 2032
- Table 69: India Acrylonitrile Market Revenue (Billion) Forecast, by Application 2019 & 2032
- Table 70: India Acrylonitrile Market Volume (K Tons) Forecast, by Application 2019 & 2032
- Table 71: Japan Acrylonitrile Market Revenue (Billion) Forecast, by Application 2019 & 2032
- Table 72: Japan Acrylonitrile Market Volume (K Tons) Forecast, by Application 2019 & 2032
- Table 73: South Korea Acrylonitrile Market Revenue (Billion) Forecast, by Application 2019 & 2032
- Table 74: South Korea Acrylonitrile Market Volume (K Tons) Forecast, by Application 2019 & 2032
- Table 75: Rest of Asia Pacific Acrylonitrile Market Revenue (Billion) Forecast, by Application 2019 & 2032
- Table 76: Rest of Asia Pacific Acrylonitrile Market Volume (K Tons) Forecast, by Application 2019 & 2032
- Table 77: Global Acrylonitrile Market Revenue Billion Forecast, by Process Technology 2019 & 2032
- Table 78: Global Acrylonitrile Market Volume K Tons Forecast, by Process Technology 2019 & 2032
- Table 79: Global Acrylonitrile Market Revenue Billion Forecast, by Application 2019 & 2032
- Table 80: Global Acrylonitrile Market Volume K Tons Forecast, by Application 2019 & 2032
- Table 81: Global Acrylonitrile Market Revenue Billion Forecast, by Country 2019 & 2032
- Table 82: Global Acrylonitrile Market Volume K Tons Forecast, by Country 2019 & 2032
- Table 83: United States Acrylonitrile Market Revenue (Billion) Forecast, by Application 2019 & 2032
- Table 84: United States Acrylonitrile Market Volume (K Tons) Forecast, by Application 2019 & 2032
- Table 85: Canada Acrylonitrile Market Revenue (Billion) Forecast, by Application 2019 & 2032
- Table 86: Canada Acrylonitrile Market Volume (K Tons) Forecast, by Application 2019 & 2032
- Table 87: Global Acrylonitrile Market Revenue Billion Forecast, by Process Technology 2019 & 2032
- Table 88: Global Acrylonitrile Market Volume K Tons Forecast, by Process Technology 2019 & 2032
- Table 89: Global Acrylonitrile Market Revenue Billion Forecast, by Application 2019 & 2032
- Table 90: Global Acrylonitrile Market Volume K Tons Forecast, by Application 2019 & 2032
- Table 91: Global Acrylonitrile Market Revenue Billion Forecast, by Country 2019 & 2032
- Table 92: Global Acrylonitrile Market Volume K Tons Forecast, by Country 2019 & 2032
- Table 93: Germany Acrylonitrile Market Revenue (Billion) Forecast, by Application 2019 & 2032
- Table 94: Germany Acrylonitrile Market Volume (K Tons) Forecast, by Application 2019 & 2032
- Table 95: United Kingdom Acrylonitrile Market Revenue (Billion) Forecast, by Application 2019 & 2032
- Table 96: United Kingdom Acrylonitrile Market Volume (K Tons) Forecast, by Application 2019 & 2032
- Table 97: Italy Acrylonitrile Market Revenue (Billion) Forecast, by Application 2019 & 2032
- Table 98: Italy Acrylonitrile Market Volume (K Tons) Forecast, by Application 2019 & 2032
- Table 99: France Acrylonitrile Market Revenue (Billion) Forecast, by Application 2019 & 2032
- Table 100: France Acrylonitrile Market Volume (K Tons) Forecast, by Application 2019 & 2032
- Table 101: Russia Acrylonitrile Market Revenue (Billion) Forecast, by Application 2019 & 2032
- Table 102: Russia Acrylonitrile Market Volume (K Tons) Forecast, by Application 2019 & 2032
- Table 103: Rest of Europe Acrylonitrile Market Revenue (Billion) Forecast, by Application 2019 & 2032
- Table 104: Rest of Europe Acrylonitrile Market Volume (K Tons) Forecast, by Application 2019 & 2032
- Table 105: Global Acrylonitrile Market Revenue Billion Forecast, by Process Technology 2019 & 2032
- Table 106: Global Acrylonitrile Market Volume K Tons Forecast, by Process Technology 2019 & 2032
- Table 107: Global Acrylonitrile Market Revenue Billion Forecast, by Application 2019 & 2032
- Table 108: Global Acrylonitrile Market Volume K Tons Forecast, by Application 2019 & 2032
- Table 109: Global Acrylonitrile Market Revenue Billion Forecast, by Country 2019 & 2032
- Table 110: Global Acrylonitrile Market Volume K Tons Forecast, by Country 2019 & 2032
- Table 111: Brazil Acrylonitrile Market Revenue (Billion) Forecast, by Application 2019 & 2032
- Table 112: Brazil Acrylonitrile Market Volume (K Tons) Forecast, by Application 2019 & 2032
- Table 113: Argentina Acrylonitrile Market Revenue (Billion) Forecast, by Application 2019 & 2032
- Table 114: Argentina Acrylonitrile Market Volume (K Tons) Forecast, by Application 2019 & 2032
- Table 115: Colombia Acrylonitrile Market Revenue (Billion) Forecast, by Application 2019 & 2032
- Table 116: Colombia Acrylonitrile Market Volume (K Tons) Forecast, by Application 2019 & 2032
- Table 117: Rest of Latin America Acrylonitrile Market Revenue (Billion) Forecast, by Application 2019 & 2032
- Table 118: Rest of Latin America Acrylonitrile Market Volume (K Tons) Forecast, by Application 2019 & 2032
- Table 119: Global Acrylonitrile Market Revenue Billion Forecast, by Process Technology 2019 & 2032
- Table 120: Global Acrylonitrile Market Volume K Tons Forecast, by Process Technology 2019 & 2032
- Table 121: Global Acrylonitrile Market Revenue Billion Forecast, by Application 2019 & 2032
- Table 122: Global Acrylonitrile Market Volume K Tons Forecast, by Application 2019 & 2032
- Table 123: Global Acrylonitrile Market Revenue Billion Forecast, by Country 2019 & 2032
- Table 124: Global Acrylonitrile Market Volume K Tons Forecast, by Country 2019 & 2032
Frequently Asked Questions
1. What is the projected Compound Annual Growth Rate (CAGR) of the Acrylonitrile Market?
The projected CAGR is approximately 4.1%.
2. Which companies are prominent players in the Acrylonitrile Market?
Key companies in the market include Jiangsu Shenghong Group Co Ltd, INEOS, Ascend Performance Materials, China Petrochemical Development Corporation, Cornerstone Chemical Company, Taekwang Industrial Co Ltd, AnQore, Asahi Kasei Advance Corporation, Formosa Plastics Corp, China Petroleum & Chemical Corporation (SINOPEC), PetroChina (CNPC), SOCAR (Petkim Petrokimya Holding A).
3. What are the main segments of the Acrylonitrile Market?
The market segments include Process Technology, Application.
4. Can you provide details about the market size?
The market size is estimated to be USD 12.3 Billion as of 2022.
5. What are some drivers contributing to market growth?
Increasing Demand for Acrylonitrile Butadiene Styrene (ABS) in the Automotive and Construction Industries; Growing Textile Industry.
6. What are the notable trends driving market growth?
The Demand for Acrylonitrile for Acrylonitrile Butadiene Styrene (ABS) is Rising.
7. Are there any restraints impacting market growth?
Toxicity and Regulations of Acrylonitrile; Other Restraints.
8. Can you provide examples of recent developments in the market?
February 2024: The Mitsubishi Chemical Group announced the discontinuation of MMA monomer production by the ACH process and the production of acrylonitrile and acrylonitrile derivatives at the Mitsubishi Chemical Hiroshima Plant (Otake City, Hiroshima Prefecture).
9. What pricing options are available for accessing the report?
Pricing options include single-user, multi-user, and enterprise licenses priced at USD 4750, USD 5250, and USD 8750 respectively.
10. Is the market size provided in terms of value or volume?
The market size is provided in terms of value, measured in Billion and volume, measured in K Tons.
11. Are there any specific market keywords associated with the report?
Yes, the market keyword associated with the report is "Acrylonitrile Market," which aids in identifying and referencing the specific market segment covered.
12. How do I determine which pricing option suits my needs best?
The pricing options vary based on user requirements and access needs. Individual users may opt for single-user licenses, while businesses requiring broader access may choose multi-user or enterprise licenses for cost-effective access to the report.
13. Are there any additional resources or data provided in the Acrylonitrile Market report?
While the report offers comprehensive insights, it's advisable to review the specific contents or supplementary materials provided to ascertain if additional resources or data are available.
14. How can I stay updated on further developments or reports in the Acrylonitrile Market?
To stay informed about further developments, trends, and reports in the Acrylonitrile Market, consider subscribing to industry newsletters, following relevant companies and organizations, or regularly checking reputable industry news sources and publications.
Methodology
Step 1 - Identification of Relevant Samples Size from Population Database


Step 2 - Approaches for Defining Global Market Size (Value, Volume* & Price*)

Note*: In applicable scenarios
Step 3 - Data Sources
Primary Research
- Web Analytics
- Survey Reports
- Research Institute
- Latest Research Reports
- Opinion Leaders
Secondary Research
- Annual Reports
- White Paper
- Latest Press Release
- Industry Association
- Paid Database
- Investor Presentations

Step 4 - Data Triangulation
Involves using different sources of information in order to increase the validity of a study
These sources are likely to be stakeholders in a program - participants, other researchers, program staff, other community members, and so on.
Then we put all data in single framework & apply various statistical tools to find out the dynamic on the market.
During the analysis stage, feedback from the stakeholder groups would be compared to determine areas of agreement as well as areas of divergence


