

Key Insights
The Arrayed Waveguide Grating (AWG) Mux/Demux market is experiencing robust growth, driven by the escalating demand for higher bandwidth and increased data traffic across telecommunications and data center networks. With a current market size estimated at $1.14 billion in 2024, the sector is projected to expand at a significant Compound Annual Growth Rate (CAGR) of 9.8% over the forecast period of 2025-2033. This expansion is primarily fueled by the critical role AWG Mux/Demux devices play in Dense Wavelength Division Multiplexing (DWDM) transmission, enabling the efficient aggregation and separation of multiple optical signals onto a single fiber. The increasing adoption of high-speed internet, cloud computing, and the proliferation of 5G networks worldwide are major catalysts, necessitating more sophisticated optical networking solutions. Furthermore, advancements in optical component technology, leading to more compact and cost-effective AWG devices, are also contributing to market penetration.
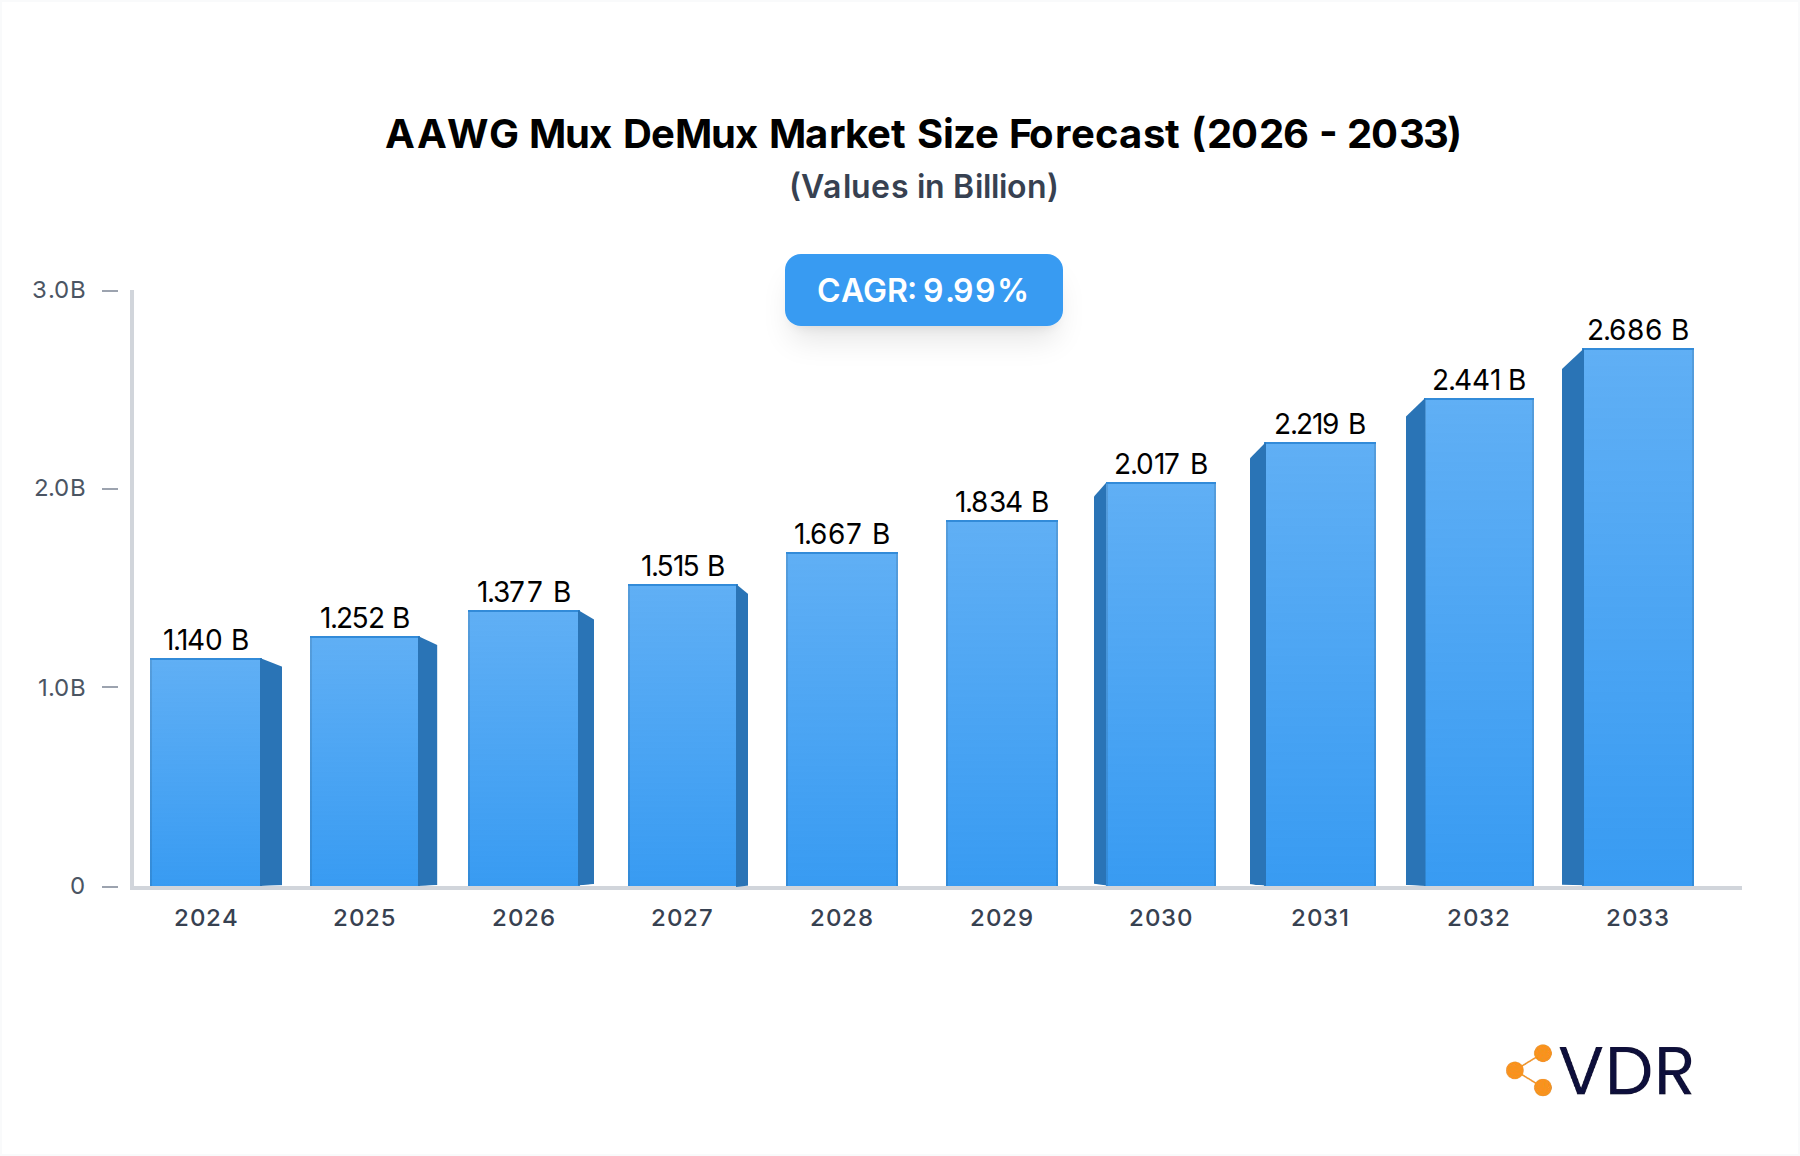
AAWG Mux DeMux Market Size (In Billion)
Key applications like wavelength routing and optical add/drop multiplexing are witnessing substantial investment, underpinning the market's upward trajectory. The market is segmented by frequency, with 100 GHz and 150 GHz channels gaining prominence due to their ability to support higher data rates. While the market demonstrates strong growth potential, certain restraints, such as the high initial investment costs for advanced DWDM infrastructure and intense competition among established and emerging players, warrant careful consideration. Nonetheless, the relentless drive for network capacity upgrades and the ongoing digital transformation across industries position the AWG Mux/Demux market for sustained expansion, with Asia Pacific expected to lead in growth due to its burgeoning data center infrastructure and widespread 5G deployment.

AAWG Mux DeMux Company Market Share
Comprehensive AAWG Mux DeMux Market Report: Analysis, Trends, and Future Outlook (2019–2033)
This in-depth report offers a definitive analysis of the Arrayed Waveguide Grating (AAWG) Mux DeMux market, a critical component in modern optical networking. Covering the historical period of 2019–2024, base year 2025, estimated year 2025, and a forecast period of 2025–2033, this research provides unparalleled insights into market dynamics, growth trajectories, and strategic opportunities. We delve into the intricacies of DWDM transmission, wavelength routing, and optical add/drop multiplexing, examining various 50G Hz, 75G Hz, 100G Hz, 150G Hz, and other frequency types. This report is essential for industry stakeholders seeking to understand the competitive landscape, technological advancements, and market potential within the global AAWG Mux DeMux sector.
AAWG Mux DeMux Market Dynamics & Structure
The AAWG Mux DeMux market exhibits a moderately concentrated structure, with key players investing heavily in research and development to drive technological innovation. The primary innovation drivers stem from the relentless demand for higher bandwidth and increased spectral efficiency in telecommunications and data centers. The parent market for optical communication components, valued at an estimated $85.5 billion in 2025, provides a robust ecosystem for AAWG Mux DeMux growth. In contrast, the child market for AAWG Mux DeMux itself is projected to reach $7.2 billion by 2025, demonstrating its significant contribution and specialized importance. Regulatory frameworks, particularly those promoting 5G deployment and fiber optic network expansion, positively influence market adoption. Competitive product substitutes, while evolving, have yet to fully match the cost-effectiveness and performance of advanced AAWG solutions. End-user demographics are increasingly dominated by telecommunication operators, cloud service providers, and enterprise networks seeking scalable and efficient data transmission. Mergers and acquisitions (M&A) activity remains a significant trend, with an estimated 25 significant M&A deals in the last five years, aimed at consolidating market share and acquiring advanced technological capabilities. Barriers to innovation primarily revolve around high R&D costs and the need for specialized manufacturing expertise.
- Market Share Snapshot (2025 Estimated): Top 5 players hold approximately 60% of the market share.
- M&A Deal Volume (2019-2024): Approximately 25 major transactions.
- Innovation Barriers: High initial investment in fabrication technology, intricate design challenges for higher channel counts.
- End-User Dominance: Telecommunication Operators (55%), Cloud Service Providers (30%), Enterprise Networks (15%).
AAWG Mux DeMux Growth Trends & Insights
The AAWG Mux DeMux market is poised for substantial expansion, driven by an insatiable global appetite for data and the ongoing evolution of optical networking technologies. Throughout the study period (2019–2033), the market has witnessed a steady upward trajectory, with the base year 2025 estimating a market size of $7.2 billion. This growth is fundamentally underpinned by the increasing deployment of Dense Wavelength Division Multiplexing (DWDM) systems, which are essential for maximizing fiber optic cable capacity. The adoption rate of AAWG Mux DeMux devices is accelerating as network operators transition to higher data rates and more efficient wavelength management. Technological disruptions, such as advancements in silicon photonics and planar lightwave circuits (PLCs), are continuously enhancing the performance, miniaturization, and cost-effectiveness of AAWG devices. Consumer behavior shifts, characterized by an ever-increasing demand for streaming services, online gaming, and cloud-based applications, directly translate into greater bandwidth requirements, thereby fueling the demand for sophisticated optical components like AAWG Mux DeMux units.
The market is also significantly influenced by the roll-out of new generation mobile networks, particularly 5G and the upcoming 6G, which necessitate robust and high-capacity backhaul and fronthaul solutions. Data centers, the backbone of the digital economy, are continuously expanding their infrastructure to accommodate the exponential growth in data traffic, further driving the need for high-performance optical networking equipment. The growing prevalence of edge computing also contributes to this trend, requiring localized high-speed data processing and transmission capabilities. Furthermore, the increasing focus on network virtualization and Software-Defined Networking (SDN) demands flexible and programmable optical network components, a domain where AAWG Mux DeMux plays a crucial role in enabling agile wavelength routing.
In terms of market penetration, AAWG Mux DeMux solutions are becoming indispensable in high-density metro networks, long-haul transmission, and data center interconnects. The forecast period (2025–2033) anticipates a Compound Annual Growth Rate (CAGR) of approximately 8.5%, reflecting sustained demand and continuous technological advancements. This sustained growth will be propelled by innovations in manufacturing processes, leading to reduced costs and increased accessibility for a wider range of applications. The ability of AAWG Mux DeMux to support a large number of channels on a single fiber is a key differentiator, making it a cost-effective solution for scaling network capacity. The evolution towards higher channel counts (e.g., 96-channel and 128-channel devices) and finer channel spacing (e.g., 75 GHz and 50 GHz) further solidifies its position in the market.
Dominant Regions, Countries, or Segments in AAWG Mux DeMux
The DWDM Transmission application segment is undeniably the dominant force driving growth in the AAWG Mux DeMux market. This segment is projected to account for an estimated 65% of the total market revenue in 2025, a testament to its critical role in enabling high-capacity optical networks worldwide. The increasing global demand for faster internet speeds, the proliferation of data centers, and the widespread deployment of 5G infrastructure are the primary catalysts fueling the expansion of DWDM transmission. Asia Pacific, particularly China, emerges as the leading region, driven by massive investments in telecommunications infrastructure and a strong manufacturing base for optical components. In 2025, Asia Pacific is estimated to capture 40% of the global AAWG Mux DeMux market share.
Within the Types segment, 100G Hz and 50G Hz frequencies are witnessing the most significant adoption. The 100G Hz type is crucial for current high-density DWDM deployments, while the 50G Hz type represents the leading edge in spectral efficiency, enabling even greater capacity on existing fiber infrastructure. These finer channel spacing types are becoming increasingly vital as network operators strive to maximize the utilization of their fiber assets. Wavelength Routing and Optical Add/Drop applications, while significant, represent smaller market shares compared to DWDM transmission, at approximately 20% and 10% respectively in 2025. However, these segments are also experiencing robust growth due to the need for flexible network architectures and efficient management of optical signals.
Key drivers for regional dominance in Asia Pacific include favorable government policies promoting digital transformation, substantial capital expenditure by major telecommunication operators, and the presence of leading global manufacturers. Countries like China, South Korea, and Japan are at the forefront of technological innovation and network deployment. North America and Europe follow as significant markets, driven by ongoing fiber-to-the-home (FTTH) initiatives, data center expansion, and the upgrade of existing telecommunication networks to support higher bandwidth demands. The growth potential in these regions remains substantial as they continue to invest in next-generation optical networks. The ability of AAWG Mux DeMux technology to support a large number of channels with low insertion loss and high isolation makes it indispensable for these large-scale infrastructure projects.
- Dominant Application: DWDM Transmission (65% market share in 2025)
- Leading Region: Asia Pacific (40% market share in 2025)
- Key Frequencies: 100G Hz and 50G Hz
- Growth Drivers in Asia Pacific: Government digital initiatives, operator CAPEX, strong manufacturing ecosystem.
- Market Share (2025 Estimated):
- DWDM Transmission: $4.69 billion
- Wavelength Routing: $1.44 billion
- Optical Add/Drop: $0.72 billion
- Others: $0.35 billion
AAWG Mux DeMux Product Landscape
The AAWG Mux DeMux product landscape is characterized by continuous innovation focused on enhancing channel count, reducing insertion loss, improving thermal stability, and miniaturizing form factors. Manufacturers are pushing the boundaries to deliver devices supporting up to 128 channels with 50 GHz spacing, enabling unprecedented optical transmission capacity. Advanced fabrication techniques, such as direct UV writing and photolithography on silicon nitride platforms, are enabling higher precision and repeatability. These products are integral to high-density DWDM systems, metro networks, data center interconnects, and long-haul transmission, offering superior wavelength isolation and minimal signal degradation. Unique selling propositions often lie in the device's ability to achieve ultra-low crosstalk and high thermal stability, crucial for reliable operation in demanding environments.
Key Drivers, Barriers & Challenges in AAWG Mux DeMux
The AAWG Mux DeMux industry is propelled by several key drivers, including the exponential growth in global data traffic, the widespread adoption of 5G networks, and the continuous expansion of hyperscale data centers. The demand for higher bandwidth and increased spectral efficiency in telecommunication infrastructure is a primary economic driver. Technological advancements in manufacturing processes and materials science are also crucial in driving innovation and reducing costs. Furthermore, government initiatives promoting digital infrastructure development and fiber optic network deployment globally act as significant policy-driven factors.
However, the market also faces several challenges and restraints. High research and development costs associated with developing advanced AAWG devices can be a significant barrier to entry for smaller companies. The complexity of manufacturing processes requires substantial capital investment and specialized expertise. Supply chain disruptions, particularly for raw materials and specialized components, can impact production timelines and costs. Intense competition from alternative technologies, such as thin-film filters (TFFs) and fiber Bragg gratings (FBGs) for lower channel count applications, also presents a competitive pressure. Regulatory hurdles related to network interoperability and standards compliance can add to market entry complexities.
Emerging Opportunities in AAWG Mux DeMux
Emerging opportunities in the AAWG Mux DeMux sector lie in the growing demand for coherent optical transceivers that leverage AAWG technology for enhanced performance. The expansion of metro networks and the increasing adoption of sub-carrier multiplexing techniques present new avenues for specialized AAWG solutions. Furthermore, the development of reconfigurable optical add-drop multiplexers (ROADMs) incorporating AAWG technology offers significant potential for dynamic network management. Untapped markets in emerging economies with rapidly developing telecommunication infrastructures also represent a substantial growth opportunity. Evolving consumer preferences for higher bandwidth applications like virtual and augmented reality will continue to drive demand for more advanced and efficient optical networking components.
Growth Accelerators in the AAWG Mux DeMux Industry
Several catalysts are accelerating growth in the AAWG Mux DeMux industry. Technological breakthroughs in silicon photonics integration are paving the way for smaller, more cost-effective, and energy-efficient AAWG devices. Strategic partnerships between component manufacturers and network equipment providers are crucial for aligning product development with market needs and accelerating adoption. Market expansion strategies, including penetration into new geographical regions and diversification of product offerings to cater to niche applications, are also key growth accelerators. The increasing demand for higher data rates in enterprise networks and cloud services continues to push the boundaries of what AAWG technology can achieve.
Key Players Shaping the AAWG Mux DeMux Market
- NTT Electronics Corporation
- Lumentum
- Enablence
- POINTek
- Broadex Technologies
- Henan Shijia Photons Tech
- Accelink Technologies
- Agilecom Photonics Solutions
- HYC
- Shenzhen Gigalight Technology
- DK Photonics
- Shenzhen Optico Communication
- Guangzhou Sintai Communication
- GEZHI Photonics
- Teosco Technologies
- Shenzhen Seacent Photonics
- Ningbo Fibconet Communication Technology
- Wuhan Yilut Technology
- Flyin Optronics
- Shenzhen Hilink Technology
- Shenzhen Unifiber Technology
Notable Milestones in AAWG Mux DeMux Sector
- 2019: Introduction of 128-channel AAWG modules with 50 GHz spacing by leading manufacturers.
- 2020: Significant advancements in planar lightwave circuit (PLC) fabrication enabling higher integration and lower costs.
- 2021: Increased adoption of AAWG in 400G and 800G optical transceivers for data center interconnects.
- 2022: Development of thermally stabilized AAWG modules to ensure performance in varied environmental conditions.
- 2023: Growing interest in silicon photonics-based AAWG solutions for enhanced miniaturization and power efficiency.
- Q1 2024: Key players announce expanded production capacities to meet rising global demand.
- Q2 2024: Focus on developing highly customizable AAWG solutions for specific client needs.
In-Depth AAWG Mux DeMux Market Outlook
The future outlook for the AAWG Mux DeMux market is exceptionally positive, driven by sustained demand for high-capacity optical networks and continuous technological innovation. The market is expected to witness significant growth fueled by the ongoing expansion of 5G infrastructure, the ever-increasing data requirements of cloud computing, and the burgeoning field of artificial intelligence and machine learning. Strategic opportunities lie in the development of integrated optical engines that combine AAWG technology with other photonic components for even greater functionality and compactness. The increasing focus on sustainability and energy efficiency in data centers will also drive the adoption of more advanced and power-optimized AAWG solutions. The market's trajectory is set for sustained expansion, offering substantial growth potential for stakeholders who can adapt to evolving technological landscapes and market demands.
AAWG Mux DeMux Segmentation
-
1. Application
- 1.1. DWDM Transmission
- 1.2. Wavelength Routing
- 1.3. Optical Add/Drop
- 1.4. Others
-
2. Types
- 2.1. 50G Hz
- 2.2. 75G Hz
- 2.3. 100G Hz
- 2.4. 150G Hz
- 2.5. Others
AAWG Mux DeMux Segmentation By Geography
-
1. North America
- 1.1. United States
- 1.2. Canada
- 1.3. Mexico
-
2. South America
- 2.1. Brazil
- 2.2. Argentina
- 2.3. Rest of South America
-
3. Europe
- 3.1. United Kingdom
- 3.2. Germany
- 3.3. France
- 3.4. Italy
- 3.5. Spain
- 3.6. Russia
- 3.7. Benelux
- 3.8. Nordics
- 3.9. Rest of Europe
-
4. Middle East & Africa
- 4.1. Turkey
- 4.2. Israel
- 4.3. GCC
- 4.4. North Africa
- 4.5. South Africa
- 4.6. Rest of Middle East & Africa
-
5. Asia Pacific
- 5.1. China
- 5.2. India
- 5.3. Japan
- 5.4. South Korea
- 5.5. ASEAN
- 5.6. Oceania
- 5.7. Rest of Asia Pacific
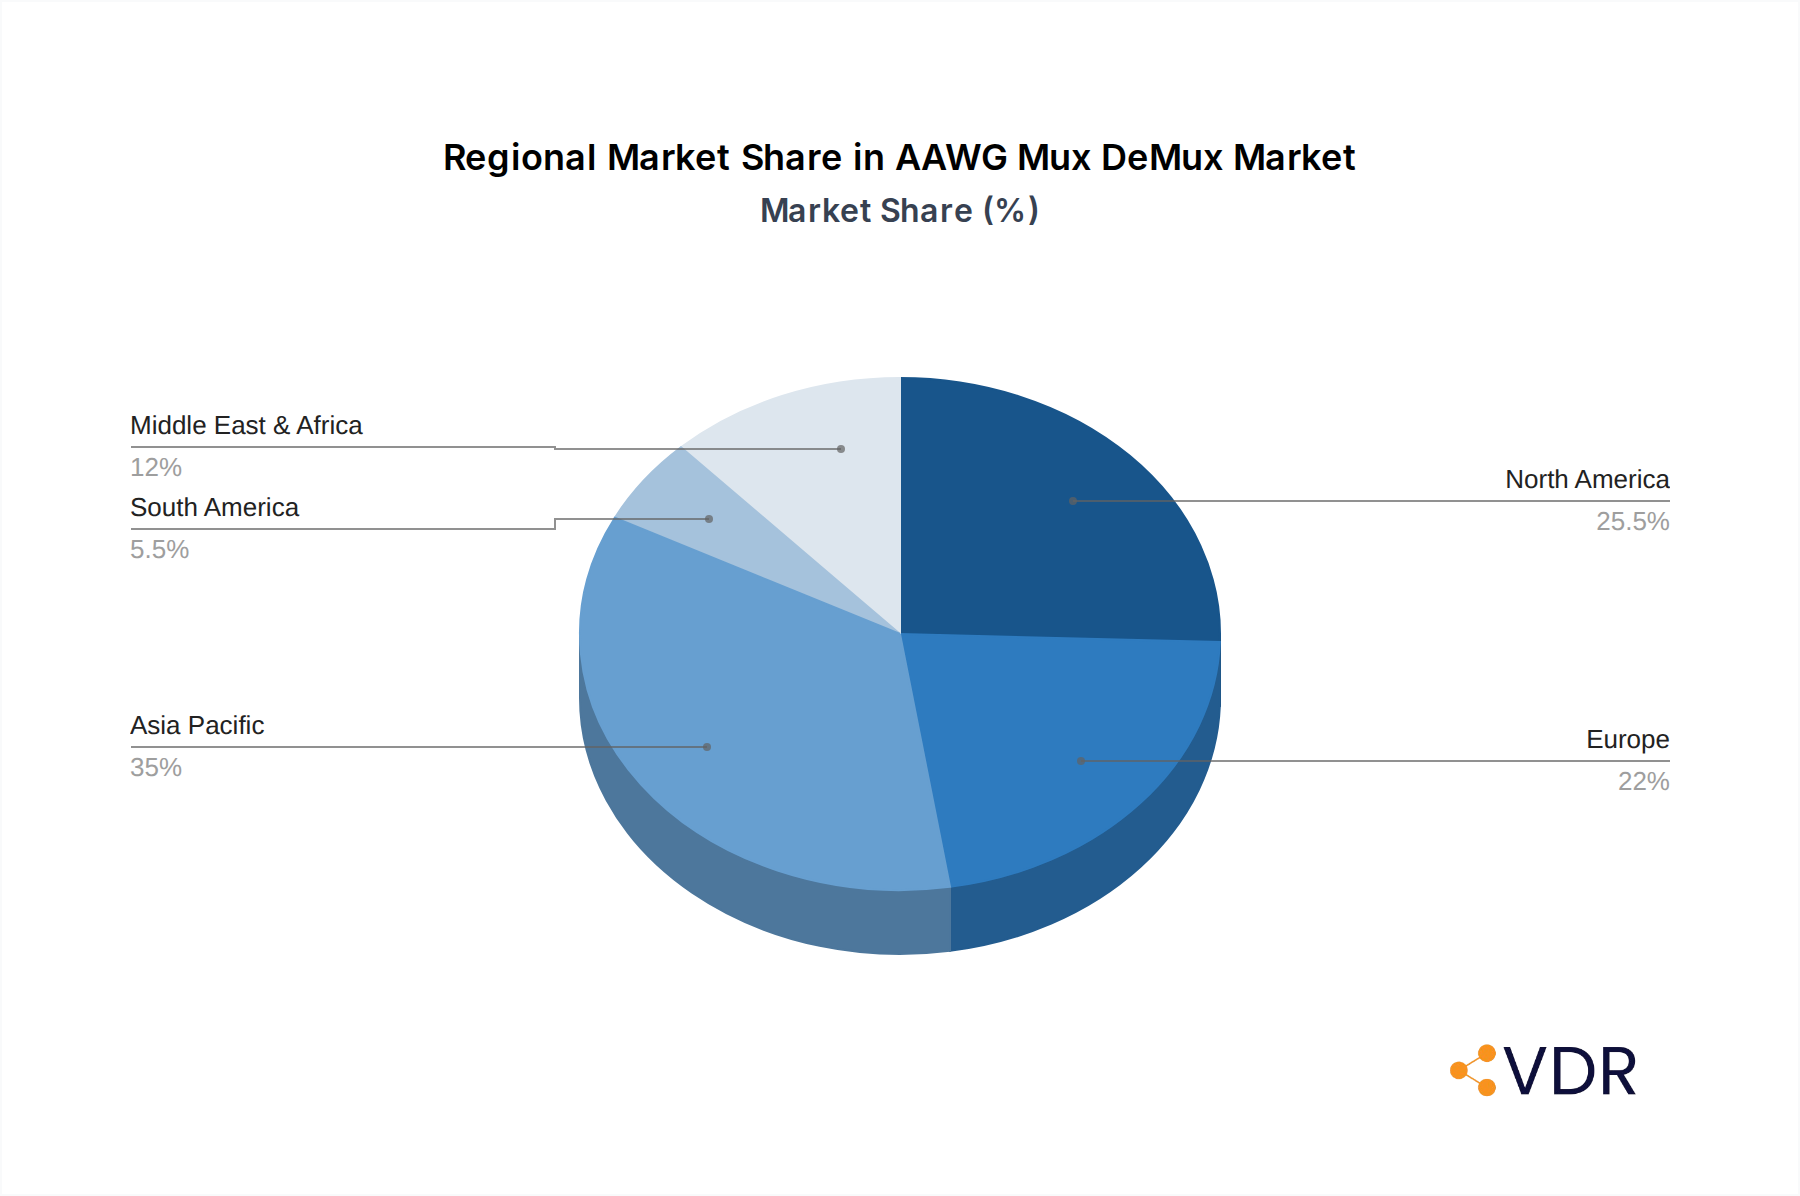
AAWG Mux DeMux Regional Market Share
Geographic Coverage of AAWG Mux DeMux
AAWG Mux DeMux REPORT HIGHLIGHTS
| Aspects | Details |
|---|---|
| Study Period | 2020-2034 |
| Base Year | 2025 |
| Estimated Year | 2026 |
| Forecast Period | 2026-2034 |
| Historical Period | 2020-2025 |
| Growth Rate | CAGR of 8.14% from 2020-2034 |
| Segmentation |
|
Table of Contents
- 1. Introduction
- 1.1. Research Scope
- 1.2. Market Segmentation
- 1.3. Research Objective
- 1.4. Definitions and Assumptions
- 2. Executive Summary
- 2.1. Market Snapshot
- 3. Market Dynamics
- 3.1. Market Drivers
- 3.2. Market Restrains
- 3.3. Market Trends
- 3.4. Market Opportunities
- 4. Market Factor Analysis
- 4.1. Porters Five Forces
- 4.1.1. Bargaining Power of Suppliers
- 4.1.2. Bargaining Power of Buyers
- 4.1.3. Threat of New Entrants
- 4.1.4. Threat of Substitutes
- 4.1.5. Competitive Rivalry
- 4.2. PESTEL analysis
- 4.3. BCG Analysis
- 4.3.1. Stars (High Growth, High Market Share)
- 4.3.2. Cash Cows (Low Growth, High Market Share)
- 4.3.3. Question Mark (High Growth, Low Market Share)
- 4.3.4. Dogs (Low Growth, Low Market Share)
- 4.4. Ansoff Matrix Analysis
- 4.5. Supply Chain Analysis
- 4.6. Regulatory Landscape
- 4.7. Current Market Potential and Opportunity Assessment (TAM–SAM–SOM Framework)
- 4.8. VDR Analyst Note
- 4.1. Porters Five Forces
- 5. Market Analysis, Insights and Forecast 2021-2033
- 5.1. Market Analysis, Insights and Forecast - by Application
- 5.1.1. DWDM Transmission
- 5.1.2. Wavelength Routing
- 5.1.3. Optical Add/Drop
- 5.1.4. Others
- 5.2. Market Analysis, Insights and Forecast - by Types
- 5.2.1. 50G Hz
- 5.2.2. 75G Hz
- 5.2.3. 100G Hz
- 5.2.4. 150G Hz
- 5.2.5. Others
- 5.3. Market Analysis, Insights and Forecast - by Region
- 5.3.1. North America
- 5.3.2. South America
- 5.3.3. Europe
- 5.3.4. Middle East & Africa
- 5.3.5. Asia Pacific
- 5.1. Market Analysis, Insights and Forecast - by Application
- 6. Global AAWG Mux DeMux Analysis, Insights and Forecast, 2021-2033
- 6.1. Market Analysis, Insights and Forecast - by Application
- 6.1.1. DWDM Transmission
- 6.1.2. Wavelength Routing
- 6.1.3. Optical Add/Drop
- 6.1.4. Others
- 6.2. Market Analysis, Insights and Forecast - by Types
- 6.2.1. 50G Hz
- 6.2.2. 75G Hz
- 6.2.3. 100G Hz
- 6.2.4. 150G Hz
- 6.2.5. Others
- 6.1. Market Analysis, Insights and Forecast - by Application
- 7. North America AAWG Mux DeMux Analysis, Insights and Forecast, 2021-2033
- 7.1. Market Analysis, Insights and Forecast - by Application
- 7.1.1. DWDM Transmission
- 7.1.2. Wavelength Routing
- 7.1.3. Optical Add/Drop
- 7.1.4. Others
- 7.2. Market Analysis, Insights and Forecast - by Types
- 7.2.1. 50G Hz
- 7.2.2. 75G Hz
- 7.2.3. 100G Hz
- 7.2.4. 150G Hz
- 7.2.5. Others
- 7.1. Market Analysis, Insights and Forecast - by Application
- 8. South America AAWG Mux DeMux Analysis, Insights and Forecast, 2021-2033
- 8.1. Market Analysis, Insights and Forecast - by Application
- 8.1.1. DWDM Transmission
- 8.1.2. Wavelength Routing
- 8.1.3. Optical Add/Drop
- 8.1.4. Others
- 8.2. Market Analysis, Insights and Forecast - by Types
- 8.2.1. 50G Hz
- 8.2.2. 75G Hz
- 8.2.3. 100G Hz
- 8.2.4. 150G Hz
- 8.2.5. Others
- 8.1. Market Analysis, Insights and Forecast - by Application
- 9. Europe AAWG Mux DeMux Analysis, Insights and Forecast, 2021-2033
- 9.1. Market Analysis, Insights and Forecast - by Application
- 9.1.1. DWDM Transmission
- 9.1.2. Wavelength Routing
- 9.1.3. Optical Add/Drop
- 9.1.4. Others
- 9.2. Market Analysis, Insights and Forecast - by Types
- 9.2.1. 50G Hz
- 9.2.2. 75G Hz
- 9.2.3. 100G Hz
- 9.2.4. 150G Hz
- 9.2.5. Others
- 9.1. Market Analysis, Insights and Forecast - by Application
- 10. Middle East & Africa AAWG Mux DeMux Analysis, Insights and Forecast, 2021-2033
- 10.1. Market Analysis, Insights and Forecast - by Application
- 10.1.1. DWDM Transmission
- 10.1.2. Wavelength Routing
- 10.1.3. Optical Add/Drop
- 10.1.4. Others
- 10.2. Market Analysis, Insights and Forecast - by Types
- 10.2.1. 50G Hz
- 10.2.2. 75G Hz
- 10.2.3. 100G Hz
- 10.2.4. 150G Hz
- 10.2.5. Others
- 10.1. Market Analysis, Insights and Forecast - by Application
- 11. Asia Pacific AAWG Mux DeMux Analysis, Insights and Forecast, 2021-2033
- 11.1. Market Analysis, Insights and Forecast - by Application
- 11.1.1. DWDM Transmission
- 11.1.2. Wavelength Routing
- 11.1.3. Optical Add/Drop
- 11.1.4. Others
- 11.2. Market Analysis, Insights and Forecast - by Types
- 11.2.1. 50G Hz
- 11.2.2. 75G Hz
- 11.2.3. 100G Hz
- 11.2.4. 150G Hz
- 11.2.5. Others
- 11.1. Market Analysis, Insights and Forecast - by Application
- 12. Competitive Analysis
- 12.1. Company Profiles
- 12.1.1 NTT Electronics Corporation
- 12.1.1.1. Company Overview
- 12.1.1.2. Products
- 12.1.1.3. Company Financials
- 12.1.1.4. SWOT Analysis
- 12.1.2 Lumentum
- 12.1.2.1. Company Overview
- 12.1.2.2. Products
- 12.1.2.3. Company Financials
- 12.1.2.4. SWOT Analysis
- 12.1.3 Enablence
- 12.1.3.1. Company Overview
- 12.1.3.2. Products
- 12.1.3.3. Company Financials
- 12.1.3.4. SWOT Analysis
- 12.1.4 POINTek
- 12.1.4.1. Company Overview
- 12.1.4.2. Products
- 12.1.4.3. Company Financials
- 12.1.4.4. SWOT Analysis
- 12.1.5 Broadex Technologies
- 12.1.5.1. Company Overview
- 12.1.5.2. Products
- 12.1.5.3. Company Financials
- 12.1.5.4. SWOT Analysis
- 12.1.6 Henan Shijia Photons Tech
- 12.1.6.1. Company Overview
- 12.1.6.2. Products
- 12.1.6.3. Company Financials
- 12.1.6.4. SWOT Analysis
- 12.1.7 Accelink Technologies
- 12.1.7.1. Company Overview
- 12.1.7.2. Products
- 12.1.7.3. Company Financials
- 12.1.7.4. SWOT Analysis
- 12.1.8 Agilecom Photonics Solutions
- 12.1.8.1. Company Overview
- 12.1.8.2. Products
- 12.1.8.3. Company Financials
- 12.1.8.4. SWOT Analysis
- 12.1.9 HYC
- 12.1.9.1. Company Overview
- 12.1.9.2. Products
- 12.1.9.3. Company Financials
- 12.1.9.4. SWOT Analysis
- 12.1.10 Shenzhen Gigalight Technology
- 12.1.10.1. Company Overview
- 12.1.10.2. Products
- 12.1.10.3. Company Financials
- 12.1.10.4. SWOT Analysis
- 12.1.11 DK Photonics
- 12.1.11.1. Company Overview
- 12.1.11.2. Products
- 12.1.11.3. Company Financials
- 12.1.11.4. SWOT Analysis
- 12.1.12 Shenzhen Optico Communication
- 12.1.12.1. Company Overview
- 12.1.12.2. Products
- 12.1.12.3. Company Financials
- 12.1.12.4. SWOT Analysis
- 12.1.13 Guangzhou Sintai Communication
- 12.1.13.1. Company Overview
- 12.1.13.2. Products
- 12.1.13.3. Company Financials
- 12.1.13.4. SWOT Analysis
- 12.1.14 GEZHI Photonics
- 12.1.14.1. Company Overview
- 12.1.14.2. Products
- 12.1.14.3. Company Financials
- 12.1.14.4. SWOT Analysis
- 12.1.15 Teosco Technologies
- 12.1.15.1. Company Overview
- 12.1.15.2. Products
- 12.1.15.3. Company Financials
- 12.1.15.4. SWOT Analysis
- 12.1.16 Shenzhen Seacent Photonics
- 12.1.16.1. Company Overview
- 12.1.16.2. Products
- 12.1.16.3. Company Financials
- 12.1.16.4. SWOT Analysis
- 12.1.17 Ningbo Fibconet Communication Technology
- 12.1.17.1. Company Overview
- 12.1.17.2. Products
- 12.1.17.3. Company Financials
- 12.1.17.4. SWOT Analysis
- 12.1.18 Wuhan Yilut Technology
- 12.1.18.1. Company Overview
- 12.1.18.2. Products
- 12.1.18.3. Company Financials
- 12.1.18.4. SWOT Analysis
- 12.1.19 Flyin Optronics
- 12.1.19.1. Company Overview
- 12.1.19.2. Products
- 12.1.19.3. Company Financials
- 12.1.19.4. SWOT Analysis
- 12.1.20 Shenzhen Hilink Technology
- 12.1.20.1. Company Overview
- 12.1.20.2. Products
- 12.1.20.3. Company Financials
- 12.1.20.4. SWOT Analysis
- 12.1.21 Shenzhen Unifiber Technology
- 12.1.21.1. Company Overview
- 12.1.21.2. Products
- 12.1.21.3. Company Financials
- 12.1.21.4. SWOT Analysis
- 12.1.1 NTT Electronics Corporation
- 12.2. Market Entropy
- 12.2.1 Company's Key Areas Served
- 12.2.2 Recent Developments
- 12.3. Company Market Share Analysis 2025
- 12.3.1 Top 5 Companies Market Share Analysis
- 12.3.2 Top 3 Companies Market Share Analysis
- 12.4. List of Potential Customers
- 13. Research Methodology
List of Figures
- Figure 1: Global AAWG Mux DeMux Revenue Breakdown (million, %) by Region 2025 & 2033
- Figure 2: Global AAWG Mux DeMux Volume Breakdown (K, %) by Region 2025 & 2033
- Figure 3: North America AAWG Mux DeMux Revenue (million), by Application 2025 & 2033
- Figure 4: North America AAWG Mux DeMux Volume (K), by Application 2025 & 2033
- Figure 5: North America AAWG Mux DeMux Revenue Share (%), by Application 2025 & 2033
- Figure 6: North America AAWG Mux DeMux Volume Share (%), by Application 2025 & 2033
- Figure 7: North America AAWG Mux DeMux Revenue (million), by Types 2025 & 2033
- Figure 8: North America AAWG Mux DeMux Volume (K), by Types 2025 & 2033
- Figure 9: North America AAWG Mux DeMux Revenue Share (%), by Types 2025 & 2033
- Figure 10: North America AAWG Mux DeMux Volume Share (%), by Types 2025 & 2033
- Figure 11: North America AAWG Mux DeMux Revenue (million), by Country 2025 & 2033
- Figure 12: North America AAWG Mux DeMux Volume (K), by Country 2025 & 2033
- Figure 13: North America AAWG Mux DeMux Revenue Share (%), by Country 2025 & 2033
- Figure 14: North America AAWG Mux DeMux Volume Share (%), by Country 2025 & 2033
- Figure 15: South America AAWG Mux DeMux Revenue (million), by Application 2025 & 2033
- Figure 16: South America AAWG Mux DeMux Volume (K), by Application 2025 & 2033
- Figure 17: South America AAWG Mux DeMux Revenue Share (%), by Application 2025 & 2033
- Figure 18: South America AAWG Mux DeMux Volume Share (%), by Application 2025 & 2033
- Figure 19: South America AAWG Mux DeMux Revenue (million), by Types 2025 & 2033
- Figure 20: South America AAWG Mux DeMux Volume (K), by Types 2025 & 2033
- Figure 21: South America AAWG Mux DeMux Revenue Share (%), by Types 2025 & 2033
- Figure 22: South America AAWG Mux DeMux Volume Share (%), by Types 2025 & 2033
- Figure 23: South America AAWG Mux DeMux Revenue (million), by Country 2025 & 2033
- Figure 24: South America AAWG Mux DeMux Volume (K), by Country 2025 & 2033
- Figure 25: South America AAWG Mux DeMux Revenue Share (%), by Country 2025 & 2033
- Figure 26: South America AAWG Mux DeMux Volume Share (%), by Country 2025 & 2033
- Figure 27: Europe AAWG Mux DeMux Revenue (million), by Application 2025 & 2033
- Figure 28: Europe AAWG Mux DeMux Volume (K), by Application 2025 & 2033
- Figure 29: Europe AAWG Mux DeMux Revenue Share (%), by Application 2025 & 2033
- Figure 30: Europe AAWG Mux DeMux Volume Share (%), by Application 2025 & 2033
- Figure 31: Europe AAWG Mux DeMux Revenue (million), by Types 2025 & 2033
- Figure 32: Europe AAWG Mux DeMux Volume (K), by Types 2025 & 2033
- Figure 33: Europe AAWG Mux DeMux Revenue Share (%), by Types 2025 & 2033
- Figure 34: Europe AAWG Mux DeMux Volume Share (%), by Types 2025 & 2033
- Figure 35: Europe AAWG Mux DeMux Revenue (million), by Country 2025 & 2033
- Figure 36: Europe AAWG Mux DeMux Volume (K), by Country 2025 & 2033
- Figure 37: Europe AAWG Mux DeMux Revenue Share (%), by Country 2025 & 2033
- Figure 38: Europe AAWG Mux DeMux Volume Share (%), by Country 2025 & 2033
- Figure 39: Middle East & Africa AAWG Mux DeMux Revenue (million), by Application 2025 & 2033
- Figure 40: Middle East & Africa AAWG Mux DeMux Volume (K), by Application 2025 & 2033
- Figure 41: Middle East & Africa AAWG Mux DeMux Revenue Share (%), by Application 2025 & 2033
- Figure 42: Middle East & Africa AAWG Mux DeMux Volume Share (%), by Application 2025 & 2033
- Figure 43: Middle East & Africa AAWG Mux DeMux Revenue (million), by Types 2025 & 2033
- Figure 44: Middle East & Africa AAWG Mux DeMux Volume (K), by Types 2025 & 2033
- Figure 45: Middle East & Africa AAWG Mux DeMux Revenue Share (%), by Types 2025 & 2033
- Figure 46: Middle East & Africa AAWG Mux DeMux Volume Share (%), by Types 2025 & 2033
- Figure 47: Middle East & Africa AAWG Mux DeMux Revenue (million), by Country 2025 & 2033
- Figure 48: Middle East & Africa AAWG Mux DeMux Volume (K), by Country 2025 & 2033
- Figure 49: Middle East & Africa AAWG Mux DeMux Revenue Share (%), by Country 2025 & 2033
- Figure 50: Middle East & Africa AAWG Mux DeMux Volume Share (%), by Country 2025 & 2033
- Figure 51: Asia Pacific AAWG Mux DeMux Revenue (million), by Application 2025 & 2033
- Figure 52: Asia Pacific AAWG Mux DeMux Volume (K), by Application 2025 & 2033
- Figure 53: Asia Pacific AAWG Mux DeMux Revenue Share (%), by Application 2025 & 2033
- Figure 54: Asia Pacific AAWG Mux DeMux Volume Share (%), by Application 2025 & 2033
- Figure 55: Asia Pacific AAWG Mux DeMux Revenue (million), by Types 2025 & 2033
- Figure 56: Asia Pacific AAWG Mux DeMux Volume (K), by Types 2025 & 2033
- Figure 57: Asia Pacific AAWG Mux DeMux Revenue Share (%), by Types 2025 & 2033
- Figure 58: Asia Pacific AAWG Mux DeMux Volume Share (%), by Types 2025 & 2033
- Figure 59: Asia Pacific AAWG Mux DeMux Revenue (million), by Country 2025 & 2033
- Figure 60: Asia Pacific AAWG Mux DeMux Volume (K), by Country 2025 & 2033
- Figure 61: Asia Pacific AAWG Mux DeMux Revenue Share (%), by Country 2025 & 2033
- Figure 62: Asia Pacific AAWG Mux DeMux Volume Share (%), by Country 2025 & 2033
List of Tables
- Table 1: Global AAWG Mux DeMux Revenue million Forecast, by Application 2020 & 2033
- Table 2: Global AAWG Mux DeMux Volume K Forecast, by Application 2020 & 2033
- Table 3: Global AAWG Mux DeMux Revenue million Forecast, by Types 2020 & 2033
- Table 4: Global AAWG Mux DeMux Volume K Forecast, by Types 2020 & 2033
- Table 5: Global AAWG Mux DeMux Revenue million Forecast, by Region 2020 & 2033
- Table 6: Global AAWG Mux DeMux Volume K Forecast, by Region 2020 & 2033
- Table 7: Global AAWG Mux DeMux Revenue million Forecast, by Application 2020 & 2033
- Table 8: Global AAWG Mux DeMux Volume K Forecast, by Application 2020 & 2033
- Table 9: Global AAWG Mux DeMux Revenue million Forecast, by Types 2020 & 2033
- Table 10: Global AAWG Mux DeMux Volume K Forecast, by Types 2020 & 2033
- Table 11: Global AAWG Mux DeMux Revenue million Forecast, by Country 2020 & 2033
- Table 12: Global AAWG Mux DeMux Volume K Forecast, by Country 2020 & 2033
- Table 13: United States AAWG Mux DeMux Revenue (million) Forecast, by Application 2020 & 2033
- Table 14: United States AAWG Mux DeMux Volume (K) Forecast, by Application 2020 & 2033
- Table 15: Canada AAWG Mux DeMux Revenue (million) Forecast, by Application 2020 & 2033
- Table 16: Canada AAWG Mux DeMux Volume (K) Forecast, by Application 2020 & 2033
- Table 17: Mexico AAWG Mux DeMux Revenue (million) Forecast, by Application 2020 & 2033
- Table 18: Mexico AAWG Mux DeMux Volume (K) Forecast, by Application 2020 & 2033
- Table 19: Global AAWG Mux DeMux Revenue million Forecast, by Application 2020 & 2033
- Table 20: Global AAWG Mux DeMux Volume K Forecast, by Application 2020 & 2033
- Table 21: Global AAWG Mux DeMux Revenue million Forecast, by Types 2020 & 2033
- Table 22: Global AAWG Mux DeMux Volume K Forecast, by Types 2020 & 2033
- Table 23: Global AAWG Mux DeMux Revenue million Forecast, by Country 2020 & 2033
- Table 24: Global AAWG Mux DeMux Volume K Forecast, by Country 2020 & 2033
- Table 25: Brazil AAWG Mux DeMux Revenue (million) Forecast, by Application 2020 & 2033
- Table 26: Brazil AAWG Mux DeMux Volume (K) Forecast, by Application 2020 & 2033
- Table 27: Argentina AAWG Mux DeMux Revenue (million) Forecast, by Application 2020 & 2033
- Table 28: Argentina AAWG Mux DeMux Volume (K) Forecast, by Application 2020 & 2033
- Table 29: Rest of South America AAWG Mux DeMux Revenue (million) Forecast, by Application 2020 & 2033
- Table 30: Rest of South America AAWG Mux DeMux Volume (K) Forecast, by Application 2020 & 2033
- Table 31: Global AAWG Mux DeMux Revenue million Forecast, by Application 2020 & 2033
- Table 32: Global AAWG Mux DeMux Volume K Forecast, by Application 2020 & 2033
- Table 33: Global AAWG Mux DeMux Revenue million Forecast, by Types 2020 & 2033
- Table 34: Global AAWG Mux DeMux Volume K Forecast, by Types 2020 & 2033
- Table 35: Global AAWG Mux DeMux Revenue million Forecast, by Country 2020 & 2033
- Table 36: Global AAWG Mux DeMux Volume K Forecast, by Country 2020 & 2033
- Table 37: United Kingdom AAWG Mux DeMux Revenue (million) Forecast, by Application 2020 & 2033
- Table 38: United Kingdom AAWG Mux DeMux Volume (K) Forecast, by Application 2020 & 2033
- Table 39: Germany AAWG Mux DeMux Revenue (million) Forecast, by Application 2020 & 2033
- Table 40: Germany AAWG Mux DeMux Volume (K) Forecast, by Application 2020 & 2033
- Table 41: France AAWG Mux DeMux Revenue (million) Forecast, by Application 2020 & 2033
- Table 42: France AAWG Mux DeMux Volume (K) Forecast, by Application 2020 & 2033
- Table 43: Italy AAWG Mux DeMux Revenue (million) Forecast, by Application 2020 & 2033
- Table 44: Italy AAWG Mux DeMux Volume (K) Forecast, by Application 2020 & 2033
- Table 45: Spain AAWG Mux DeMux Revenue (million) Forecast, by Application 2020 & 2033
- Table 46: Spain AAWG Mux DeMux Volume (K) Forecast, by Application 2020 & 2033
- Table 47: Russia AAWG Mux DeMux Revenue (million) Forecast, by Application 2020 & 2033
- Table 48: Russia AAWG Mux DeMux Volume (K) Forecast, by Application 2020 & 2033
- Table 49: Benelux AAWG Mux DeMux Revenue (million) Forecast, by Application 2020 & 2033
- Table 50: Benelux AAWG Mux DeMux Volume (K) Forecast, by Application 2020 & 2033
- Table 51: Nordics AAWG Mux DeMux Revenue (million) Forecast, by Application 2020 & 2033
- Table 52: Nordics AAWG Mux DeMux Volume (K) Forecast, by Application 2020 & 2033
- Table 53: Rest of Europe AAWG Mux DeMux Revenue (million) Forecast, by Application 2020 & 2033
- Table 54: Rest of Europe AAWG Mux DeMux Volume (K) Forecast, by Application 2020 & 2033
- Table 55: Global AAWG Mux DeMux Revenue million Forecast, by Application 2020 & 2033
- Table 56: Global AAWG Mux DeMux Volume K Forecast, by Application 2020 & 2033
- Table 57: Global AAWG Mux DeMux Revenue million Forecast, by Types 2020 & 2033
- Table 58: Global AAWG Mux DeMux Volume K Forecast, by Types 2020 & 2033
- Table 59: Global AAWG Mux DeMux Revenue million Forecast, by Country 2020 & 2033
- Table 60: Global AAWG Mux DeMux Volume K Forecast, by Country 2020 & 2033
- Table 61: Turkey AAWG Mux DeMux Revenue (million) Forecast, by Application 2020 & 2033
- Table 62: Turkey AAWG Mux DeMux Volume (K) Forecast, by Application 2020 & 2033
- Table 63: Israel AAWG Mux DeMux Revenue (million) Forecast, by Application 2020 & 2033
- Table 64: Israel AAWG Mux DeMux Volume (K) Forecast, by Application 2020 & 2033
- Table 65: GCC AAWG Mux DeMux Revenue (million) Forecast, by Application 2020 & 2033
- Table 66: GCC AAWG Mux DeMux Volume (K) Forecast, by Application 2020 & 2033
- Table 67: North Africa AAWG Mux DeMux Revenue (million) Forecast, by Application 2020 & 2033
- Table 68: North Africa AAWG Mux DeMux Volume (K) Forecast, by Application 2020 & 2033
- Table 69: South Africa AAWG Mux DeMux Revenue (million) Forecast, by Application 2020 & 2033
- Table 70: South Africa AAWG Mux DeMux Volume (K) Forecast, by Application 2020 & 2033
- Table 71: Rest of Middle East & Africa AAWG Mux DeMux Revenue (million) Forecast, by Application 2020 & 2033
- Table 72: Rest of Middle East & Africa AAWG Mux DeMux Volume (K) Forecast, by Application 2020 & 2033
- Table 73: Global AAWG Mux DeMux Revenue million Forecast, by Application 2020 & 2033
- Table 74: Global AAWG Mux DeMux Volume K Forecast, by Application 2020 & 2033
- Table 75: Global AAWG Mux DeMux Revenue million Forecast, by Types 2020 & 2033
- Table 76: Global AAWG Mux DeMux Volume K Forecast, by Types 2020 & 2033
- Table 77: Global AAWG Mux DeMux Revenue million Forecast, by Country 2020 & 2033
- Table 78: Global AAWG Mux DeMux Volume K Forecast, by Country 2020 & 2033
- Table 79: China AAWG Mux DeMux Revenue (million) Forecast, by Application 2020 & 2033
- Table 80: China AAWG Mux DeMux Volume (K) Forecast, by Application 2020 & 2033
- Table 81: India AAWG Mux DeMux Revenue (million) Forecast, by Application 2020 & 2033
- Table 82: India AAWG Mux DeMux Volume (K) Forecast, by Application 2020 & 2033
- Table 83: Japan AAWG Mux DeMux Revenue (million) Forecast, by Application 2020 & 2033
- Table 84: Japan AAWG Mux DeMux Volume (K) Forecast, by Application 2020 & 2033
- Table 85: South Korea AAWG Mux DeMux Revenue (million) Forecast, by Application 2020 & 2033
- Table 86: South Korea AAWG Mux DeMux Volume (K) Forecast, by Application 2020 & 2033
- Table 87: ASEAN AAWG Mux DeMux Revenue (million) Forecast, by Application 2020 & 2033
- Table 88: ASEAN AAWG Mux DeMux Volume (K) Forecast, by Application 2020 & 2033
- Table 89: Oceania AAWG Mux DeMux Revenue (million) Forecast, by Application 2020 & 2033
- Table 90: Oceania AAWG Mux DeMux Volume (K) Forecast, by Application 2020 & 2033
- Table 91: Rest of Asia Pacific AAWG Mux DeMux Revenue (million) Forecast, by Application 2020 & 2033
- Table 92: Rest of Asia Pacific AAWG Mux DeMux Volume (K) Forecast, by Application 2020 & 2033
Frequently Asked Questions
1. What is the projected Compound Annual Growth Rate (CAGR) of the AAWG Mux DeMux?
The projected CAGR is approximately 8.14%.
2. Which companies are prominent players in the AAWG Mux DeMux?
Key companies in the market include NTT Electronics Corporation, Lumentum, Enablence, POINTek, Broadex Technologies, Henan Shijia Photons Tech, Accelink Technologies, Agilecom Photonics Solutions, HYC, Shenzhen Gigalight Technology, DK Photonics, Shenzhen Optico Communication, Guangzhou Sintai Communication, GEZHI Photonics, Teosco Technologies, Shenzhen Seacent Photonics, Ningbo Fibconet Communication Technology, Wuhan Yilut Technology, Flyin Optronics, Shenzhen Hilink Technology, Shenzhen Unifiber Technology.
3. What are the main segments of the AAWG Mux DeMux?
The market segments include Application, Types.
4. Can you provide details about the market size?
The market size is estimated to be USD 735 million as of 2022.
5. What are some drivers contributing to market growth?
N/A
6. What are the notable trends driving market growth?
N/A
7. Are there any restraints impacting market growth?
N/A
8. Can you provide examples of recent developments in the market?
N/A
9. What pricing options are available for accessing the report?
Pricing options include single-user, multi-user, and enterprise licenses priced at USD 3950.00, USD 5925.00, and USD 7900.00 respectively.
10. Is the market size provided in terms of value or volume?
The market size is provided in terms of value, measured in million and volume, measured in K.
11. Are there any specific market keywords associated with the report?
Yes, the market keyword associated with the report is "AAWG Mux DeMux," which aids in identifying and referencing the specific market segment covered.
12. How do I determine which pricing option suits my needs best?
The pricing options vary based on user requirements and access needs. Individual users may opt for single-user licenses, while businesses requiring broader access may choose multi-user or enterprise licenses for cost-effective access to the report.
13. Are there any additional resources or data provided in the AAWG Mux DeMux report?
While the report offers comprehensive insights, it's advisable to review the specific contents or supplementary materials provided to ascertain if additional resources or data are available.
14. How can I stay updated on further developments or reports in the AAWG Mux DeMux?
To stay informed about further developments, trends, and reports in the AAWG Mux DeMux, consider subscribing to industry newsletters, following relevant companies and organizations, or regularly checking reputable industry news sources and publications.
Methodology
Step 1 - Identification of Relevant Samples Size from Population Database


Step 2 - Approaches for Defining Global Market Size (Value, Volume* & Price*)

Note*: In applicable scenarios
Step 3 - Data Sources
Primary Research
- Web Analytics
- Survey Reports
- Research Institute
- Latest Research Reports
- Opinion Leaders
Secondary Research
- Annual Reports
- White Paper
- Latest Press Release
- Industry Association
- Paid Database
- Investor Presentations

Step 4 - Data Triangulation
Involves using different sources of information in order to increase the validity of a study
These sources are likely to be stakeholders in a program - participants, other researchers, program staff, other community members, and so on.
Then we put all data in single framework & apply various statistical tools to find out the dynamic on the market.
During the analysis stage, feedback from the stakeholder groups would be compared to determine areas of agreement as well as areas of divergence