

Key Insights
The 800G high-speed active copper cable market is projected for substantial expansion, driven by escalating demand for high-bandwidth data transmission within data centers and high-performance computing environments. The swift transition to 800G networks is accelerating, fueled by the widespread adoption of cloud computing, artificial intelligence, and big data applications, all of which demand significantly higher data rates. Active copper cables offer a cost-effective and power-efficient solution compared to fiber optics for shorter in-data center distances. Major industry players are investing heavily in research and development and expanding product portfolios to capture this rapidly growing market. Despite challenges related to power consumption and signal integrity at these high speeds, ongoing technological advancements are paving the way for increased adoption.
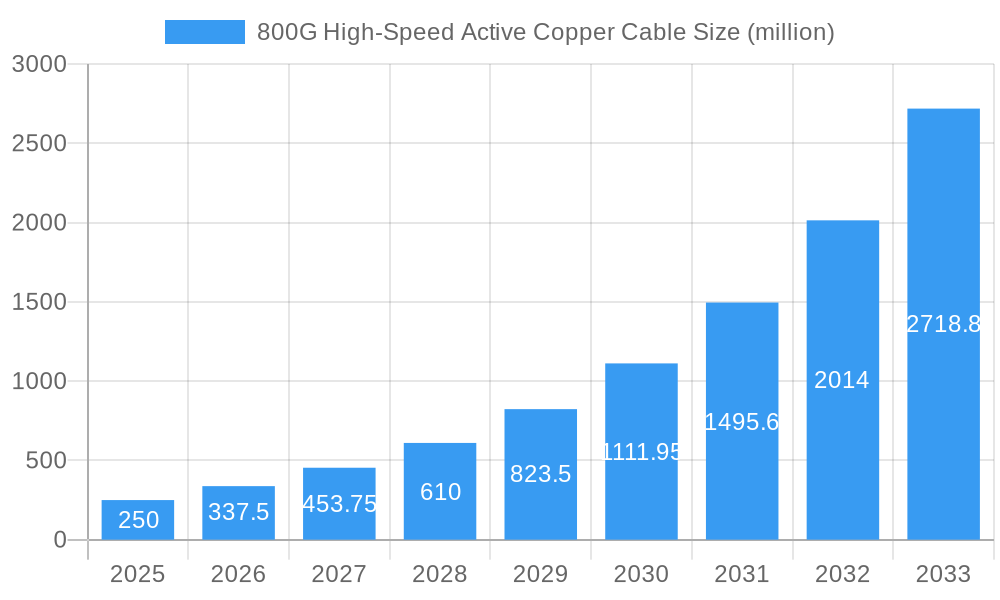
800G High-Speed Active Copper Cable Market Size (In Billion)
The market is forecast to reach a size of $7.28 billion by 2025, with an estimated Compound Annual Growth Rate (CAGR) of 15.33% between 2025 and 2033. This robust growth is propelled by the increasing adoption of 800G Ethernet technology, the demand for higher density interconnects in data centers, and continuous innovation in active copper cable solutions. While initial costs may be higher than passive copper cables, the long-term advantages of enhanced bandwidth and reduced latency are expected to drive sustained market growth. The competitive landscape features both established technology leaders and emerging innovators, fostering a diverse range of solutions.
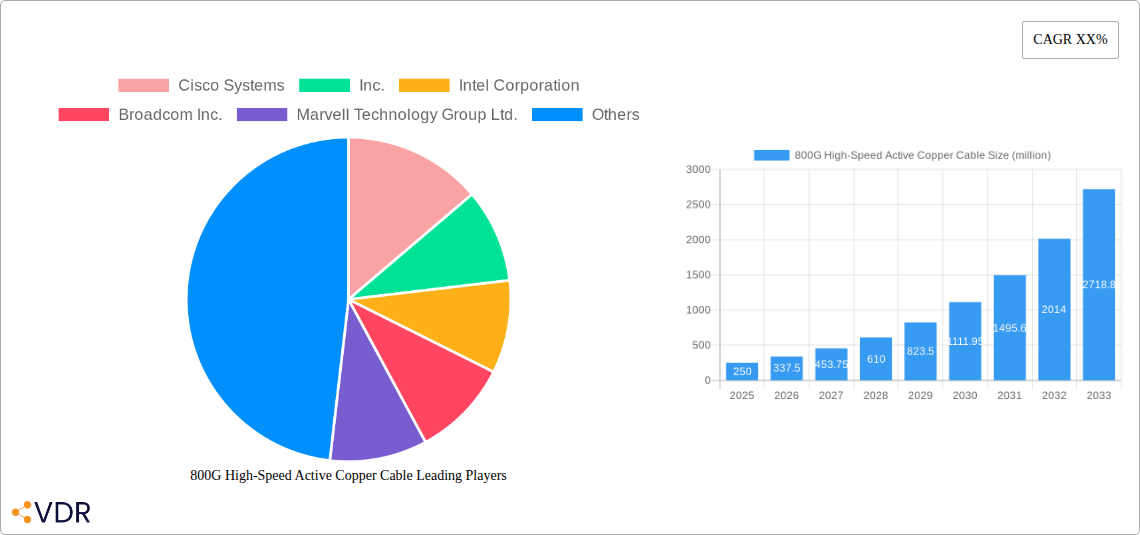
800G High-Speed Active Copper Cable Company Market Share
800G High-Speed Active Copper Cable Market Report: 2019-2033
This comprehensive report provides an in-depth analysis of the 800G High-Speed Active Copper Cable market, offering invaluable insights for industry professionals, investors, and strategic decision-makers. The report covers the period 2019-2033, with a focus on the forecast period 2025-2033, and utilizes 2025 as the base and estimated year. The analysis encompasses market dynamics, growth trends, regional segmentation, key players, and future outlook, providing a complete understanding of this rapidly evolving market. The parent market is the high-speed data transmission market, and the child market is active copper cabling within that sector.
800G High-Speed Active Copper Cable Market Dynamics & Structure
This section analyzes the competitive landscape, technological advancements, regulatory influences, and market trends shaping the 800G High-Speed Active Copper Cable market. The market size in 2025 is estimated at xx million units.
- Market Concentration: The market exhibits a moderately concentrated structure, with a few major players holding significant market share (estimated at xx% combined in 2025). However, increasing participation from smaller, specialized companies is anticipated.
- Technological Innovation: Continuous advancements in signal processing, materials science, and miniaturization are driving innovation. The adoption of advanced signal equalization techniques and power management solutions is crucial for 800G performance. xx million units are expected to leverage these advancements by 2033.
- Regulatory Frameworks: Government regulations concerning data security and transmission standards play a role, impacting market growth. Compliance costs and standardization efforts influence market expansion.
- Competitive Product Substitutes: Fiber optic cables pose the primary competitive threat, offering higher bandwidth capabilities over longer distances. However, active copper cables offer advantages in terms of cost-effectiveness and ease of installation for shorter reach applications.
- End-User Demographics: The primary end-users include data centers, telecommunications companies, high-performance computing (HPC) facilities, and enterprise networks. Growth in cloud computing and 5G infrastructure directly fuels market demand.
- M&A Trends: The past five years have seen xx M&A deals in the broader high-speed interconnect market, with a focus on consolidating manufacturing capabilities and expanding technological portfolios. This is expected to continue with a forecasted xx million units influenced by these activities by 2033.
800G High-Speed Active Copper Cable Growth Trends & Insights
The 800G High-Speed Active Copper Cable market is experiencing substantial growth, driven by the increasing demand for higher bandwidth and lower latency in data transmission. Utilizing market research data and internal projections, the market size is projected to reach xx million units by 2033, exhibiting a CAGR of xx% during the forecast period. The adoption rate is expected to increase significantly, primarily driven by the exponential growth of data centers and the proliferation of high-bandwidth applications. Technological advancements, such as the development of more efficient signal processing techniques and improved materials, are also contributing to market growth. Furthermore, changing consumer behavior, characterized by increased reliance on cloud services and streaming media, fuels the demand for high-speed data transmission. The historical period (2019-2024) shows a steadily increasing market penetration, laying the foundation for the projected accelerated growth during the forecast period.
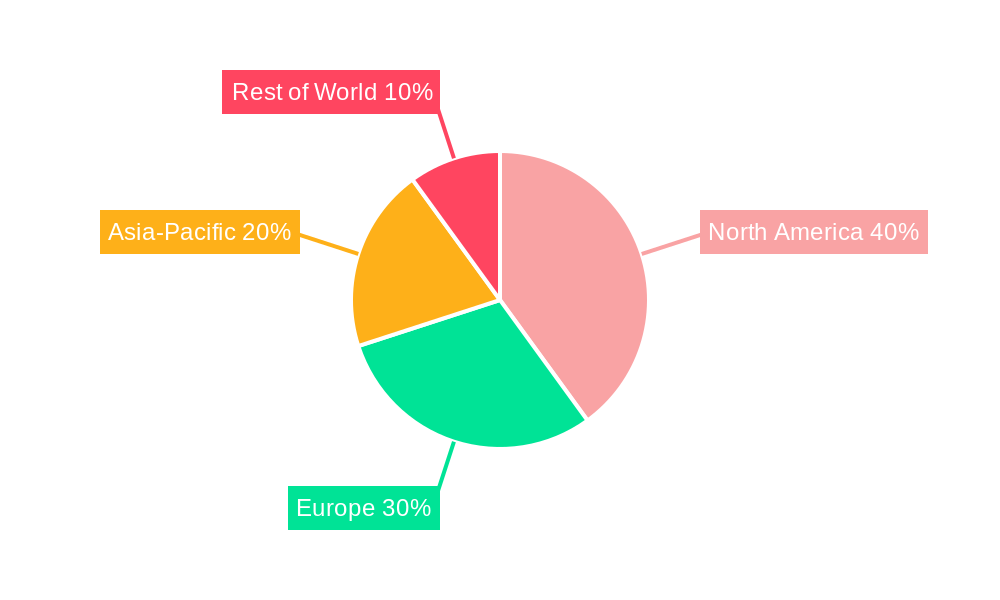
Dominant Regions, Countries, or Segments in 800G High-Speed Active Copper Cable
North America (specifically the US) currently holds the dominant position in the 800G High-Speed Active Copper Cable market due to its robust data center infrastructure and concentration of leading technology companies.
- Key Drivers:
- High density of hyperscale data centers.
- Strong investment in research & development.
- Favorable regulatory environment.
- Dominance Factors: Early adoption of 800G technology, significant investments in infrastructure upgrades, and a highly developed electronics manufacturing base.
- Growth Potential: While North America maintains a strong position, significant growth potential exists in Asia-Pacific, particularly in China, driven by rapidly expanding data centers and expanding 5G networks. Europe is also showing steady growth due to increased investments in digital infrastructure.
800G High-Speed Active Copper Cable Product Landscape
800G High-Speed Active Copper Cable products are characterized by their ability to transmit data at speeds exceeding 800 Gbps over relatively short distances. Innovations focus on minimizing signal loss, improving power efficiency, and enabling compact form factors. Key performance metrics include signal integrity, bandwidth capacity, power consumption, and operating temperature range. Unique selling propositions often center around enhanced equalization techniques, innovative cable designs, and advanced signal integrity monitoring.
Key Drivers, Barriers & Challenges in 800G High-Speed Active Copper Cable
Key Drivers:
The primary drivers include the exploding demand for high-bandwidth connectivity in data centers and the increasing adoption of high-performance computing applications. The expanding deployment of 5G networks also contributes substantially.
Key Challenges and Restraints:
Significant challenges include the high cost of the technology, the limited reach compared to fiber optic cables, and the potential for signal degradation over longer distances. Supply chain disruptions and regulatory compliance requirements further complicate market expansion. These challenges lead to potentially slowing the adoption rate and impacting overall market growth.
Emerging Opportunities in 800G High-Speed Active Copper Cable
Emerging opportunities lie in the expansion into new market segments, such as high-performance computing clusters and edge computing deployments. Further technological advancements in signal processing and materials science could increase transmission distances and reduce costs, opening up new possibilities.
Growth Accelerators in the 800G High-Speed Active Copper Cable Industry
The long-term growth of the market is expected to be fueled by continued technological innovations, particularly in signal processing and material science. Strategic partnerships between cable manufacturers, chip makers, and system integrators are anticipated to accelerate market penetration. Furthermore, expanding into emerging markets and developing applications in new sectors will significantly contribute to overall market growth.
Key Players Shaping the 800G High-Speed Active Copper Cable Market
- Cisco Systems, Inc.
- Intel Corporation
- Broadcom Inc.
- Marvell Technology Group Ltd.
- Nvidia
- Microchip Technology Inc.
- Amphenol Corporation
- Finisar Corporation
- Broadex Technologies Co., Ltd.
- Shenzhen Gigalight Technology Co., Ltd.
- Zhejiang Zhaolong Interconnect Technology Co., Limited
- Kingsignal Technology Co., Ltd.
Notable Milestones in 800G High-Speed Active Copper Cable Sector
- 2022 Q4: Several key players announced the successful testing of 800G active copper cables in data center environments.
- 2023 Q1: First commercial deployments of 800G active copper cable solutions in select data centers.
- 2023 Q3: Significant advancements in power management technology leading to improved energy efficiency.
- 2024 Q2: Announce of strategic partnerships between key players to drive market growth and standards development.
In-Depth 800G High-Speed Active Copper Cable Market Outlook
The future of the 800G High-Speed Active Copper Cable market is bright, with substantial growth potential driven by ongoing technological innovation, increasing data center density, and the expanding adoption of high-bandwidth applications. Strategic partnerships and investments in R&D will further accelerate market expansion. The market is poised for continued growth, making it an attractive sector for both established players and new entrants. Focus on enhancing cost-effectiveness and overcoming range limitations will be key factors in maximizing market penetration and ensuring future success.
800G High-Speed Active Copper Cable Segmentation
-
1. Application
- 1.1. Data Center Network
- 1.2. Enterprise Network
- 1.3. Cloud Computing
-
2. Types
- 2.1. High Speed Ethernet Copper Cable
- 2.2. Fiber Optic Interconnection Copper Cable
800G High-Speed Active Copper Cable Segmentation By Geography
-
1. North America
- 1.1. United States
- 1.2. Canada
- 1.3. Mexico
-
2. South America
- 2.1. Brazil
- 2.2. Argentina
- 2.3. Rest of South America
-
3. Europe
- 3.1. United Kingdom
- 3.2. Germany
- 3.3. France
- 3.4. Italy
- 3.5. Spain
- 3.6. Russia
- 3.7. Benelux
- 3.8. Nordics
- 3.9. Rest of Europe
-
4. Middle East & Africa
- 4.1. Turkey
- 4.2. Israel
- 4.3. GCC
- 4.4. North Africa
- 4.5. South Africa
- 4.6. Rest of Middle East & Africa
-
5. Asia Pacific
- 5.1. China
- 5.2. India
- 5.3. Japan
- 5.4. South Korea
- 5.5. ASEAN
- 5.6. Oceania
- 5.7. Rest of Asia Pacific
800G High-Speed Active Copper Cable Regional Market Share
Geographic Coverage of 800G High-Speed Active Copper Cable
800G High-Speed Active Copper Cable REPORT HIGHLIGHTS
| Aspects | Details |
|---|---|
| Study Period | 2020-2034 |
| Base Year | 2025 |
| Estimated Year | 2026 |
| Forecast Period | 2026-2034 |
| Historical Period | 2020-2025 |
| Growth Rate | CAGR of 15.33% from 2020-2034 |
| Segmentation |
|
Table of Contents
- 1. Introduction
- 1.1. Research Scope
- 1.2. Market Segmentation
- 1.3. Research Objective
- 1.4. Definitions and Assumptions
- 2. Executive Summary
- 2.1. Market Snapshot
- 3. Market Dynamics
- 3.1. Market Drivers
- 3.2. Market Restrains
- 3.3. Market Trends
- 3.4. Market Opportunities
- 4. Market Factor Analysis
- 4.1. Porters Five Forces
- 4.1.1. Bargaining Power of Suppliers
- 4.1.2. Bargaining Power of Buyers
- 4.1.3. Threat of New Entrants
- 4.1.4. Threat of Substitutes
- 4.1.5. Competitive Rivalry
- 4.2. PESTEL analysis
- 4.3. BCG Analysis
- 4.3.1. Stars (High Growth, High Market Share)
- 4.3.2. Cash Cows (Low Growth, High Market Share)
- 4.3.3. Question Mark (High Growth, Low Market Share)
- 4.3.4. Dogs (Low Growth, Low Market Share)
- 4.4. Ansoff Matrix Analysis
- 4.5. Supply Chain Analysis
- 4.6. Regulatory Landscape
- 4.7. Current Market Potential and Opportunity Assessment (TAM–SAM–SOM Framework)
- 4.8. VDR Analyst Note
- 4.1. Porters Five Forces
- 5. Market Analysis, Insights and Forecast 2021-2033
- 5.1. Market Analysis, Insights and Forecast - by Application
- 5.1.1. Data Center Network
- 5.1.2. Enterprise Network
- 5.1.3. Cloud Computing
- 5.2. Market Analysis, Insights and Forecast - by Types
- 5.2.1. High Speed Ethernet Copper Cable
- 5.2.2. Fiber Optic Interconnection Copper Cable
- 5.3. Market Analysis, Insights and Forecast - by Region
- 5.3.1. North America
- 5.3.2. South America
- 5.3.3. Europe
- 5.3.4. Middle East & Africa
- 5.3.5. Asia Pacific
- 5.1. Market Analysis, Insights and Forecast - by Application
- 6. Global 800G High-Speed Active Copper Cable Analysis, Insights and Forecast, 2021-2033
- 6.1. Market Analysis, Insights and Forecast - by Application
- 6.1.1. Data Center Network
- 6.1.2. Enterprise Network
- 6.1.3. Cloud Computing
- 6.2. Market Analysis, Insights and Forecast - by Types
- 6.2.1. High Speed Ethernet Copper Cable
- 6.2.2. Fiber Optic Interconnection Copper Cable
- 6.1. Market Analysis, Insights and Forecast - by Application
- 7. North America 800G High-Speed Active Copper Cable Analysis, Insights and Forecast, 2021-2033
- 7.1. Market Analysis, Insights and Forecast - by Application
- 7.1.1. Data Center Network
- 7.1.2. Enterprise Network
- 7.1.3. Cloud Computing
- 7.2. Market Analysis, Insights and Forecast - by Types
- 7.2.1. High Speed Ethernet Copper Cable
- 7.2.2. Fiber Optic Interconnection Copper Cable
- 7.1. Market Analysis, Insights and Forecast - by Application
- 8. South America 800G High-Speed Active Copper Cable Analysis, Insights and Forecast, 2021-2033
- 8.1. Market Analysis, Insights and Forecast - by Application
- 8.1.1. Data Center Network
- 8.1.2. Enterprise Network
- 8.1.3. Cloud Computing
- 8.2. Market Analysis, Insights and Forecast - by Types
- 8.2.1. High Speed Ethernet Copper Cable
- 8.2.2. Fiber Optic Interconnection Copper Cable
- 8.1. Market Analysis, Insights and Forecast - by Application
- 9. Europe 800G High-Speed Active Copper Cable Analysis, Insights and Forecast, 2021-2033
- 9.1. Market Analysis, Insights and Forecast - by Application
- 9.1.1. Data Center Network
- 9.1.2. Enterprise Network
- 9.1.3. Cloud Computing
- 9.2. Market Analysis, Insights and Forecast - by Types
- 9.2.1. High Speed Ethernet Copper Cable
- 9.2.2. Fiber Optic Interconnection Copper Cable
- 9.1. Market Analysis, Insights and Forecast - by Application
- 10. Middle East & Africa 800G High-Speed Active Copper Cable Analysis, Insights and Forecast, 2021-2033
- 10.1. Market Analysis, Insights and Forecast - by Application
- 10.1.1. Data Center Network
- 10.1.2. Enterprise Network
- 10.1.3. Cloud Computing
- 10.2. Market Analysis, Insights and Forecast - by Types
- 10.2.1. High Speed Ethernet Copper Cable
- 10.2.2. Fiber Optic Interconnection Copper Cable
- 10.1. Market Analysis, Insights and Forecast - by Application
- 11. Asia Pacific 800G High-Speed Active Copper Cable Analysis, Insights and Forecast, 2021-2033
- 11.1. Market Analysis, Insights and Forecast - by Application
- 11.1.1. Data Center Network
- 11.1.2. Enterprise Network
- 11.1.3. Cloud Computing
- 11.2. Market Analysis, Insights and Forecast - by Types
- 11.2.1. High Speed Ethernet Copper Cable
- 11.2.2. Fiber Optic Interconnection Copper Cable
- 11.1. Market Analysis, Insights and Forecast - by Application
- 12. Competitive Analysis
- 12.1. Company Profiles
- 12.1.1 Cisco Systems
- 12.1.1.1. Company Overview
- 12.1.1.2. Products
- 12.1.1.3. Company Financials
- 12.1.1.4. SWOT Analysis
- 12.1.2 Inc.
- 12.1.2.1. Company Overview
- 12.1.2.2. Products
- 12.1.2.3. Company Financials
- 12.1.2.4. SWOT Analysis
- 12.1.3 Intel Corporation
- 12.1.3.1. Company Overview
- 12.1.3.2. Products
- 12.1.3.3. Company Financials
- 12.1.3.4. SWOT Analysis
- 12.1.4 Broadcom Inc.
- 12.1.4.1. Company Overview
- 12.1.4.2. Products
- 12.1.4.3. Company Financials
- 12.1.4.4. SWOT Analysis
- 12.1.5 Marvell Technology Group Ltd.
- 12.1.5.1. Company Overview
- 12.1.5.2. Products
- 12.1.5.3. Company Financials
- 12.1.5.4. SWOT Analysis
- 12.1.6 Nvidia
- 12.1.6.1. Company Overview
- 12.1.6.2. Products
- 12.1.6.3. Company Financials
- 12.1.6.4. SWOT Analysis
- 12.1.7 Microchip Technology Inc.
- 12.1.7.1. Company Overview
- 12.1.7.2. Products
- 12.1.7.3. Company Financials
- 12.1.7.4. SWOT Analysis
- 12.1.8 Amphenol Corporation
- 12.1.8.1. Company Overview
- 12.1.8.2. Products
- 12.1.8.3. Company Financials
- 12.1.8.4. SWOT Analysis
- 12.1.9 Finisar Corporation
- 12.1.9.1. Company Overview
- 12.1.9.2. Products
- 12.1.9.3. Company Financials
- 12.1.9.4. SWOT Analysis
- 12.1.10 Broadex Technologies Co.
- 12.1.10.1. Company Overview
- 12.1.10.2. Products
- 12.1.10.3. Company Financials
- 12.1.10.4. SWOT Analysis
- 12.1.11 Ltd.
- 12.1.11.1. Company Overview
- 12.1.11.2. Products
- 12.1.11.3. Company Financials
- 12.1.11.4. SWOT Analysis
- 12.1.12 Shenzhen Gigalight Technology Co.
- 12.1.12.1. Company Overview
- 12.1.12.2. Products
- 12.1.12.3. Company Financials
- 12.1.12.4. SWOT Analysis
- 12.1.13 Ltd.
- 12.1.13.1. Company Overview
- 12.1.13.2. Products
- 12.1.13.3. Company Financials
- 12.1.13.4. SWOT Analysis
- 12.1.14 Zhejiang Zhaolong Interconnect Technology Co.
- 12.1.14.1. Company Overview
- 12.1.14.2. Products
- 12.1.14.3. Company Financials
- 12.1.14.4. SWOT Analysis
- 12.1.15 Limited
- 12.1.15.1. Company Overview
- 12.1.15.2. Products
- 12.1.15.3. Company Financials
- 12.1.15.4. SWOT Analysis
- 12.1.16 Kingsignal Technology Co.
- 12.1.16.1. Company Overview
- 12.1.16.2. Products
- 12.1.16.3. Company Financials
- 12.1.16.4. SWOT Analysis
- 12.1.17 Ltd.
- 12.1.17.1. Company Overview
- 12.1.17.2. Products
- 12.1.17.3. Company Financials
- 12.1.17.4. SWOT Analysis
- 12.1.1 Cisco Systems
- 12.2. Market Entropy
- 12.2.1 Company's Key Areas Served
- 12.2.2 Recent Developments
- 12.3. Company Market Share Analysis 2025
- 12.3.1 Top 5 Companies Market Share Analysis
- 12.3.2 Top 3 Companies Market Share Analysis
- 12.4. List of Potential Customers
- 13. Research Methodology
List of Figures
- Figure 1: Global 800G High-Speed Active Copper Cable Revenue Breakdown (billion, %) by Region 2025 & 2033
- Figure 2: Global 800G High-Speed Active Copper Cable Volume Breakdown (K, %) by Region 2025 & 2033
- Figure 3: North America 800G High-Speed Active Copper Cable Revenue (billion), by Application 2025 & 2033
- Figure 4: North America 800G High-Speed Active Copper Cable Volume (K), by Application 2025 & 2033
- Figure 5: North America 800G High-Speed Active Copper Cable Revenue Share (%), by Application 2025 & 2033
- Figure 6: North America 800G High-Speed Active Copper Cable Volume Share (%), by Application 2025 & 2033
- Figure 7: North America 800G High-Speed Active Copper Cable Revenue (billion), by Types 2025 & 2033
- Figure 8: North America 800G High-Speed Active Copper Cable Volume (K), by Types 2025 & 2033
- Figure 9: North America 800G High-Speed Active Copper Cable Revenue Share (%), by Types 2025 & 2033
- Figure 10: North America 800G High-Speed Active Copper Cable Volume Share (%), by Types 2025 & 2033
- Figure 11: North America 800G High-Speed Active Copper Cable Revenue (billion), by Country 2025 & 2033
- Figure 12: North America 800G High-Speed Active Copper Cable Volume (K), by Country 2025 & 2033
- Figure 13: North America 800G High-Speed Active Copper Cable Revenue Share (%), by Country 2025 & 2033
- Figure 14: North America 800G High-Speed Active Copper Cable Volume Share (%), by Country 2025 & 2033
- Figure 15: South America 800G High-Speed Active Copper Cable Revenue (billion), by Application 2025 & 2033
- Figure 16: South America 800G High-Speed Active Copper Cable Volume (K), by Application 2025 & 2033
- Figure 17: South America 800G High-Speed Active Copper Cable Revenue Share (%), by Application 2025 & 2033
- Figure 18: South America 800G High-Speed Active Copper Cable Volume Share (%), by Application 2025 & 2033
- Figure 19: South America 800G High-Speed Active Copper Cable Revenue (billion), by Types 2025 & 2033
- Figure 20: South America 800G High-Speed Active Copper Cable Volume (K), by Types 2025 & 2033
- Figure 21: South America 800G High-Speed Active Copper Cable Revenue Share (%), by Types 2025 & 2033
- Figure 22: South America 800G High-Speed Active Copper Cable Volume Share (%), by Types 2025 & 2033
- Figure 23: South America 800G High-Speed Active Copper Cable Revenue (billion), by Country 2025 & 2033
- Figure 24: South America 800G High-Speed Active Copper Cable Volume (K), by Country 2025 & 2033
- Figure 25: South America 800G High-Speed Active Copper Cable Revenue Share (%), by Country 2025 & 2033
- Figure 26: South America 800G High-Speed Active Copper Cable Volume Share (%), by Country 2025 & 2033
- Figure 27: Europe 800G High-Speed Active Copper Cable Revenue (billion), by Application 2025 & 2033
- Figure 28: Europe 800G High-Speed Active Copper Cable Volume (K), by Application 2025 & 2033
- Figure 29: Europe 800G High-Speed Active Copper Cable Revenue Share (%), by Application 2025 & 2033
- Figure 30: Europe 800G High-Speed Active Copper Cable Volume Share (%), by Application 2025 & 2033
- Figure 31: Europe 800G High-Speed Active Copper Cable Revenue (billion), by Types 2025 & 2033
- Figure 32: Europe 800G High-Speed Active Copper Cable Volume (K), by Types 2025 & 2033
- Figure 33: Europe 800G High-Speed Active Copper Cable Revenue Share (%), by Types 2025 & 2033
- Figure 34: Europe 800G High-Speed Active Copper Cable Volume Share (%), by Types 2025 & 2033
- Figure 35: Europe 800G High-Speed Active Copper Cable Revenue (billion), by Country 2025 & 2033
- Figure 36: Europe 800G High-Speed Active Copper Cable Volume (K), by Country 2025 & 2033
- Figure 37: Europe 800G High-Speed Active Copper Cable Revenue Share (%), by Country 2025 & 2033
- Figure 38: Europe 800G High-Speed Active Copper Cable Volume Share (%), by Country 2025 & 2033
- Figure 39: Middle East & Africa 800G High-Speed Active Copper Cable Revenue (billion), by Application 2025 & 2033
- Figure 40: Middle East & Africa 800G High-Speed Active Copper Cable Volume (K), by Application 2025 & 2033
- Figure 41: Middle East & Africa 800G High-Speed Active Copper Cable Revenue Share (%), by Application 2025 & 2033
- Figure 42: Middle East & Africa 800G High-Speed Active Copper Cable Volume Share (%), by Application 2025 & 2033
- Figure 43: Middle East & Africa 800G High-Speed Active Copper Cable Revenue (billion), by Types 2025 & 2033
- Figure 44: Middle East & Africa 800G High-Speed Active Copper Cable Volume (K), by Types 2025 & 2033
- Figure 45: Middle East & Africa 800G High-Speed Active Copper Cable Revenue Share (%), by Types 2025 & 2033
- Figure 46: Middle East & Africa 800G High-Speed Active Copper Cable Volume Share (%), by Types 2025 & 2033
- Figure 47: Middle East & Africa 800G High-Speed Active Copper Cable Revenue (billion), by Country 2025 & 2033
- Figure 48: Middle East & Africa 800G High-Speed Active Copper Cable Volume (K), by Country 2025 & 2033
- Figure 49: Middle East & Africa 800G High-Speed Active Copper Cable Revenue Share (%), by Country 2025 & 2033
- Figure 50: Middle East & Africa 800G High-Speed Active Copper Cable Volume Share (%), by Country 2025 & 2033
- Figure 51: Asia Pacific 800G High-Speed Active Copper Cable Revenue (billion), by Application 2025 & 2033
- Figure 52: Asia Pacific 800G High-Speed Active Copper Cable Volume (K), by Application 2025 & 2033
- Figure 53: Asia Pacific 800G High-Speed Active Copper Cable Revenue Share (%), by Application 2025 & 2033
- Figure 54: Asia Pacific 800G High-Speed Active Copper Cable Volume Share (%), by Application 2025 & 2033
- Figure 55: Asia Pacific 800G High-Speed Active Copper Cable Revenue (billion), by Types 2025 & 2033
- Figure 56: Asia Pacific 800G High-Speed Active Copper Cable Volume (K), by Types 2025 & 2033
- Figure 57: Asia Pacific 800G High-Speed Active Copper Cable Revenue Share (%), by Types 2025 & 2033
- Figure 58: Asia Pacific 800G High-Speed Active Copper Cable Volume Share (%), by Types 2025 & 2033
- Figure 59: Asia Pacific 800G High-Speed Active Copper Cable Revenue (billion), by Country 2025 & 2033
- Figure 60: Asia Pacific 800G High-Speed Active Copper Cable Volume (K), by Country 2025 & 2033
- Figure 61: Asia Pacific 800G High-Speed Active Copper Cable Revenue Share (%), by Country 2025 & 2033
- Figure 62: Asia Pacific 800G High-Speed Active Copper Cable Volume Share (%), by Country 2025 & 2033
List of Tables
- Table 1: Global 800G High-Speed Active Copper Cable Revenue billion Forecast, by Application 2020 & 2033
- Table 2: Global 800G High-Speed Active Copper Cable Volume K Forecast, by Application 2020 & 2033
- Table 3: Global 800G High-Speed Active Copper Cable Revenue billion Forecast, by Types 2020 & 2033
- Table 4: Global 800G High-Speed Active Copper Cable Volume K Forecast, by Types 2020 & 2033
- Table 5: Global 800G High-Speed Active Copper Cable Revenue billion Forecast, by Region 2020 & 2033
- Table 6: Global 800G High-Speed Active Copper Cable Volume K Forecast, by Region 2020 & 2033
- Table 7: Global 800G High-Speed Active Copper Cable Revenue billion Forecast, by Application 2020 & 2033
- Table 8: Global 800G High-Speed Active Copper Cable Volume K Forecast, by Application 2020 & 2033
- Table 9: Global 800G High-Speed Active Copper Cable Revenue billion Forecast, by Types 2020 & 2033
- Table 10: Global 800G High-Speed Active Copper Cable Volume K Forecast, by Types 2020 & 2033
- Table 11: Global 800G High-Speed Active Copper Cable Revenue billion Forecast, by Country 2020 & 2033
- Table 12: Global 800G High-Speed Active Copper Cable Volume K Forecast, by Country 2020 & 2033
- Table 13: United States 800G High-Speed Active Copper Cable Revenue (billion) Forecast, by Application 2020 & 2033
- Table 14: United States 800G High-Speed Active Copper Cable Volume (K) Forecast, by Application 2020 & 2033
- Table 15: Canada 800G High-Speed Active Copper Cable Revenue (billion) Forecast, by Application 2020 & 2033
- Table 16: Canada 800G High-Speed Active Copper Cable Volume (K) Forecast, by Application 2020 & 2033
- Table 17: Mexico 800G High-Speed Active Copper Cable Revenue (billion) Forecast, by Application 2020 & 2033
- Table 18: Mexico 800G High-Speed Active Copper Cable Volume (K) Forecast, by Application 2020 & 2033
- Table 19: Global 800G High-Speed Active Copper Cable Revenue billion Forecast, by Application 2020 & 2033
- Table 20: Global 800G High-Speed Active Copper Cable Volume K Forecast, by Application 2020 & 2033
- Table 21: Global 800G High-Speed Active Copper Cable Revenue billion Forecast, by Types 2020 & 2033
- Table 22: Global 800G High-Speed Active Copper Cable Volume K Forecast, by Types 2020 & 2033
- Table 23: Global 800G High-Speed Active Copper Cable Revenue billion Forecast, by Country 2020 & 2033
- Table 24: Global 800G High-Speed Active Copper Cable Volume K Forecast, by Country 2020 & 2033
- Table 25: Brazil 800G High-Speed Active Copper Cable Revenue (billion) Forecast, by Application 2020 & 2033
- Table 26: Brazil 800G High-Speed Active Copper Cable Volume (K) Forecast, by Application 2020 & 2033
- Table 27: Argentina 800G High-Speed Active Copper Cable Revenue (billion) Forecast, by Application 2020 & 2033
- Table 28: Argentina 800G High-Speed Active Copper Cable Volume (K) Forecast, by Application 2020 & 2033
- Table 29: Rest of South America 800G High-Speed Active Copper Cable Revenue (billion) Forecast, by Application 2020 & 2033
- Table 30: Rest of South America 800G High-Speed Active Copper Cable Volume (K) Forecast, by Application 2020 & 2033
- Table 31: Global 800G High-Speed Active Copper Cable Revenue billion Forecast, by Application 2020 & 2033
- Table 32: Global 800G High-Speed Active Copper Cable Volume K Forecast, by Application 2020 & 2033
- Table 33: Global 800G High-Speed Active Copper Cable Revenue billion Forecast, by Types 2020 & 2033
- Table 34: Global 800G High-Speed Active Copper Cable Volume K Forecast, by Types 2020 & 2033
- Table 35: Global 800G High-Speed Active Copper Cable Revenue billion Forecast, by Country 2020 & 2033
- Table 36: Global 800G High-Speed Active Copper Cable Volume K Forecast, by Country 2020 & 2033
- Table 37: United Kingdom 800G High-Speed Active Copper Cable Revenue (billion) Forecast, by Application 2020 & 2033
- Table 38: United Kingdom 800G High-Speed Active Copper Cable Volume (K) Forecast, by Application 2020 & 2033
- Table 39: Germany 800G High-Speed Active Copper Cable Revenue (billion) Forecast, by Application 2020 & 2033
- Table 40: Germany 800G High-Speed Active Copper Cable Volume (K) Forecast, by Application 2020 & 2033
- Table 41: France 800G High-Speed Active Copper Cable Revenue (billion) Forecast, by Application 2020 & 2033
- Table 42: France 800G High-Speed Active Copper Cable Volume (K) Forecast, by Application 2020 & 2033
- Table 43: Italy 800G High-Speed Active Copper Cable Revenue (billion) Forecast, by Application 2020 & 2033
- Table 44: Italy 800G High-Speed Active Copper Cable Volume (K) Forecast, by Application 2020 & 2033
- Table 45: Spain 800G High-Speed Active Copper Cable Revenue (billion) Forecast, by Application 2020 & 2033
- Table 46: Spain 800G High-Speed Active Copper Cable Volume (K) Forecast, by Application 2020 & 2033
- Table 47: Russia 800G High-Speed Active Copper Cable Revenue (billion) Forecast, by Application 2020 & 2033
- Table 48: Russia 800G High-Speed Active Copper Cable Volume (K) Forecast, by Application 2020 & 2033
- Table 49: Benelux 800G High-Speed Active Copper Cable Revenue (billion) Forecast, by Application 2020 & 2033
- Table 50: Benelux 800G High-Speed Active Copper Cable Volume (K) Forecast, by Application 2020 & 2033
- Table 51: Nordics 800G High-Speed Active Copper Cable Revenue (billion) Forecast, by Application 2020 & 2033
- Table 52: Nordics 800G High-Speed Active Copper Cable Volume (K) Forecast, by Application 2020 & 2033
- Table 53: Rest of Europe 800G High-Speed Active Copper Cable Revenue (billion) Forecast, by Application 2020 & 2033
- Table 54: Rest of Europe 800G High-Speed Active Copper Cable Volume (K) Forecast, by Application 2020 & 2033
- Table 55: Global 800G High-Speed Active Copper Cable Revenue billion Forecast, by Application 2020 & 2033
- Table 56: Global 800G High-Speed Active Copper Cable Volume K Forecast, by Application 2020 & 2033
- Table 57: Global 800G High-Speed Active Copper Cable Revenue billion Forecast, by Types 2020 & 2033
- Table 58: Global 800G High-Speed Active Copper Cable Volume K Forecast, by Types 2020 & 2033
- Table 59: Global 800G High-Speed Active Copper Cable Revenue billion Forecast, by Country 2020 & 2033
- Table 60: Global 800G High-Speed Active Copper Cable Volume K Forecast, by Country 2020 & 2033
- Table 61: Turkey 800G High-Speed Active Copper Cable Revenue (billion) Forecast, by Application 2020 & 2033
- Table 62: Turkey 800G High-Speed Active Copper Cable Volume (K) Forecast, by Application 2020 & 2033
- Table 63: Israel 800G High-Speed Active Copper Cable Revenue (billion) Forecast, by Application 2020 & 2033
- Table 64: Israel 800G High-Speed Active Copper Cable Volume (K) Forecast, by Application 2020 & 2033
- Table 65: GCC 800G High-Speed Active Copper Cable Revenue (billion) Forecast, by Application 2020 & 2033
- Table 66: GCC 800G High-Speed Active Copper Cable Volume (K) Forecast, by Application 2020 & 2033
- Table 67: North Africa 800G High-Speed Active Copper Cable Revenue (billion) Forecast, by Application 2020 & 2033
- Table 68: North Africa 800G High-Speed Active Copper Cable Volume (K) Forecast, by Application 2020 & 2033
- Table 69: South Africa 800G High-Speed Active Copper Cable Revenue (billion) Forecast, by Application 2020 & 2033
- Table 70: South Africa 800G High-Speed Active Copper Cable Volume (K) Forecast, by Application 2020 & 2033
- Table 71: Rest of Middle East & Africa 800G High-Speed Active Copper Cable Revenue (billion) Forecast, by Application 2020 & 2033
- Table 72: Rest of Middle East & Africa 800G High-Speed Active Copper Cable Volume (K) Forecast, by Application 2020 & 2033
- Table 73: Global 800G High-Speed Active Copper Cable Revenue billion Forecast, by Application 2020 & 2033
- Table 74: Global 800G High-Speed Active Copper Cable Volume K Forecast, by Application 2020 & 2033
- Table 75: Global 800G High-Speed Active Copper Cable Revenue billion Forecast, by Types 2020 & 2033
- Table 76: Global 800G High-Speed Active Copper Cable Volume K Forecast, by Types 2020 & 2033
- Table 77: Global 800G High-Speed Active Copper Cable Revenue billion Forecast, by Country 2020 & 2033
- Table 78: Global 800G High-Speed Active Copper Cable Volume K Forecast, by Country 2020 & 2033
- Table 79: China 800G High-Speed Active Copper Cable Revenue (billion) Forecast, by Application 2020 & 2033
- Table 80: China 800G High-Speed Active Copper Cable Volume (K) Forecast, by Application 2020 & 2033
- Table 81: India 800G High-Speed Active Copper Cable Revenue (billion) Forecast, by Application 2020 & 2033
- Table 82: India 800G High-Speed Active Copper Cable Volume (K) Forecast, by Application 2020 & 2033
- Table 83: Japan 800G High-Speed Active Copper Cable Revenue (billion) Forecast, by Application 2020 & 2033
- Table 84: Japan 800G High-Speed Active Copper Cable Volume (K) Forecast, by Application 2020 & 2033
- Table 85: South Korea 800G High-Speed Active Copper Cable Revenue (billion) Forecast, by Application 2020 & 2033
- Table 86: South Korea 800G High-Speed Active Copper Cable Volume (K) Forecast, by Application 2020 & 2033
- Table 87: ASEAN 800G High-Speed Active Copper Cable Revenue (billion) Forecast, by Application 2020 & 2033
- Table 88: ASEAN 800G High-Speed Active Copper Cable Volume (K) Forecast, by Application 2020 & 2033
- Table 89: Oceania 800G High-Speed Active Copper Cable Revenue (billion) Forecast, by Application 2020 & 2033
- Table 90: Oceania 800G High-Speed Active Copper Cable Volume (K) Forecast, by Application 2020 & 2033
- Table 91: Rest of Asia Pacific 800G High-Speed Active Copper Cable Revenue (billion) Forecast, by Application 2020 & 2033
- Table 92: Rest of Asia Pacific 800G High-Speed Active Copper Cable Volume (K) Forecast, by Application 2020 & 2033
Frequently Asked Questions
1. What is the projected Compound Annual Growth Rate (CAGR) of the 800G High-Speed Active Copper Cable?
The projected CAGR is approximately 15.33%.
2. Which companies are prominent players in the 800G High-Speed Active Copper Cable?
Key companies in the market include Cisco Systems, Inc., Intel Corporation, Broadcom Inc., Marvell Technology Group Ltd., Nvidia, Microchip Technology Inc., Amphenol Corporation, Finisar Corporation, Broadex Technologies Co., Ltd., Shenzhen Gigalight Technology Co., Ltd., Zhejiang Zhaolong Interconnect Technology Co., Limited, Kingsignal Technology Co., Ltd..
3. What are the main segments of the 800G High-Speed Active Copper Cable?
The market segments include Application, Types.
4. Can you provide details about the market size?
The market size is estimated to be USD 7.28 billion as of 2022.
5. What are some drivers contributing to market growth?
N/A
6. What are the notable trends driving market growth?
N/A
7. Are there any restraints impacting market growth?
N/A
8. Can you provide examples of recent developments in the market?
N/A
9. What pricing options are available for accessing the report?
Pricing options include single-user, multi-user, and enterprise licenses priced at USD 4350.00, USD 6525.00, and USD 8700.00 respectively.
10. Is the market size provided in terms of value or volume?
The market size is provided in terms of value, measured in billion and volume, measured in K.
11. Are there any specific market keywords associated with the report?
Yes, the market keyword associated with the report is "800G High-Speed Active Copper Cable," which aids in identifying and referencing the specific market segment covered.
12. How do I determine which pricing option suits my needs best?
The pricing options vary based on user requirements and access needs. Individual users may opt for single-user licenses, while businesses requiring broader access may choose multi-user or enterprise licenses for cost-effective access to the report.
13. Are there any additional resources or data provided in the 800G High-Speed Active Copper Cable report?
While the report offers comprehensive insights, it's advisable to review the specific contents or supplementary materials provided to ascertain if additional resources or data are available.
14. How can I stay updated on further developments or reports in the 800G High-Speed Active Copper Cable?
To stay informed about further developments, trends, and reports in the 800G High-Speed Active Copper Cable, consider subscribing to industry newsletters, following relevant companies and organizations, or regularly checking reputable industry news sources and publications.
Methodology
Step 1 - Identification of Relevant Samples Size from Population Database


Step 2 - Approaches for Defining Global Market Size (Value, Volume* & Price*)

Note*: In applicable scenarios
Step 3 - Data Sources
Primary Research
- Web Analytics
- Survey Reports
- Research Institute
- Latest Research Reports
- Opinion Leaders
Secondary Research
- Annual Reports
- White Paper
- Latest Press Release
- Industry Association
- Paid Database
- Investor Presentations

Step 4 - Data Triangulation
Involves using different sources of information in order to increase the validity of a study
These sources are likely to be stakeholders in a program - participants, other researchers, program staff, other community members, and so on.
Then we put all data in single framework & apply various statistical tools to find out the dynamic on the market.
During the analysis stage, feedback from the stakeholder groups would be compared to determine areas of agreement as well as areas of divergence