

Key Insights
The 5G RedCap (Reduced Capability) market is projected for substantial expansion, driven by the escalating demand for cost-effective, low-power 5G connectivity within diverse Internet of Things (IoT) applications. RedCap bridges the gap between advanced 5G and lower-bandwidth technologies, enabling wider adoption in sectors previously limited by cost and power constraints. Key growth catalysts include the increasing deployment of connected devices in industrial automation, smart agriculture, and wearables, all requiring reliable and energy-efficient connectivity. Continuous RedCap capability enhancements and declining device costs are anticipated to accelerate market penetration. Leading industry players are strategically investing in R&D and partnerships to secure a significant market share. Challenges include the necessity for broader network deployment and regional standardization, yet the market outlook remains robust.
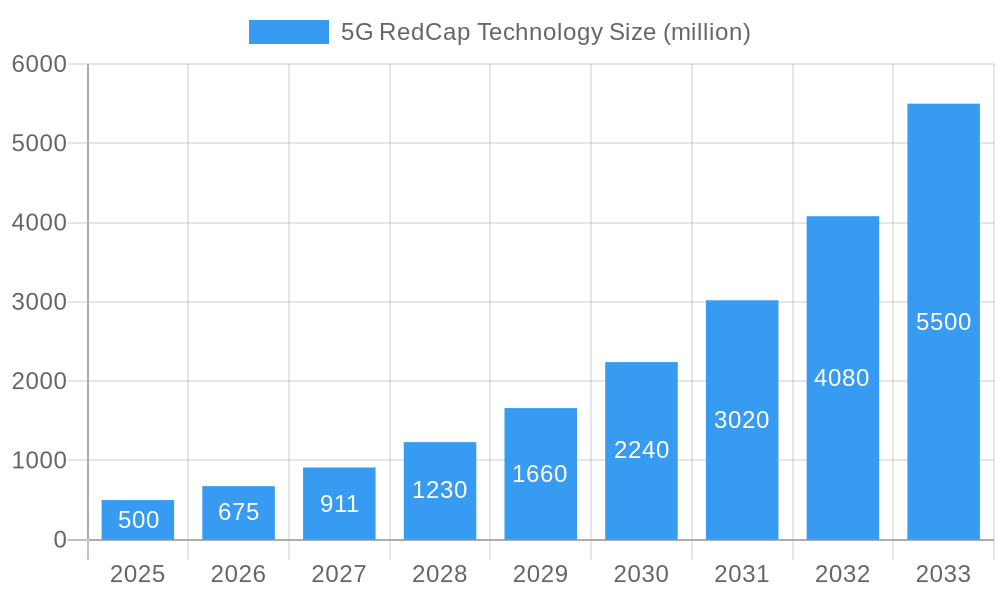
5G RedCap Technology Market Size (In Billion)
The forecast period (2025-2033) indicates strong market growth. With a projected Compound Annual Growth Rate (CAGR) of 8.41% and a 2025 market size of $14.2 billion, the market is estimated to reach approximately $32.4 billion by 2033. This projection is underpinned by the ongoing evolution of RedCap technology, expanding applications across various industries, and an anticipated surge in device shipments. Competitive intensity is expected to intensify with new entrants, potentially leading to price competition and further market expansion. The success of RedCap is also contingent on seamless integration with existing 5G infrastructures and the ongoing development of efficient, cost-effective devices.
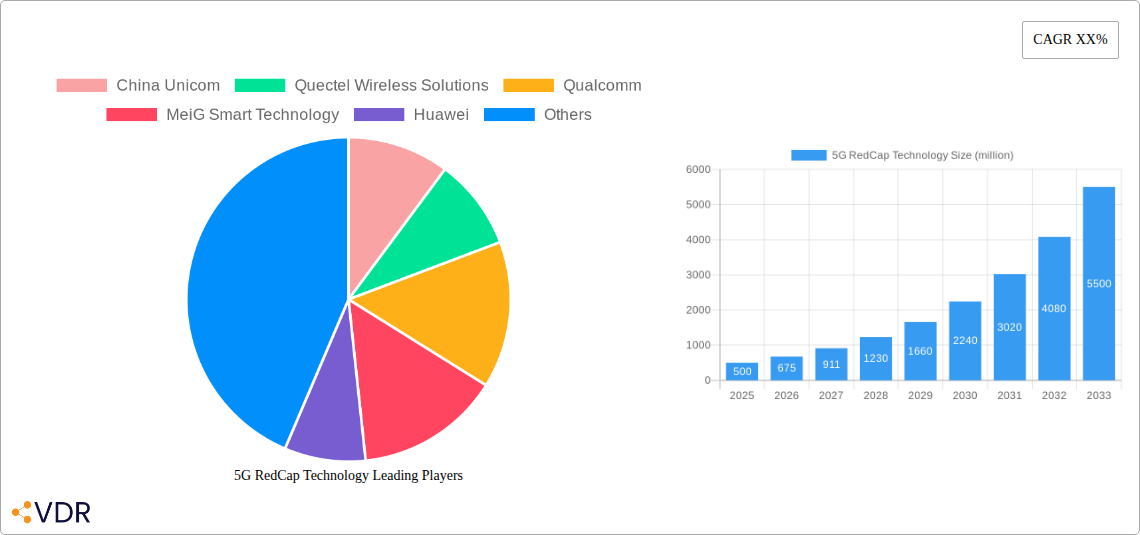
5G RedCap Technology Company Market Share
This report offers a comprehensive analysis of the 5G RedCap technology market, providing critical insights for industry professionals, investors, and strategists. Covering the period 2019-2033, with a base year of 2025 and a forecast period of 2025-2033, this report meticulously examines market dynamics, growth trajectories, regional landscapes, product segments, and key market influencers. Leveraging extensive primary and secondary research, the report delivers quantitative and qualitative data for informed decision-making. The 5G RedCap technology market is a sub-segment of the broader 5G market, focusing on its specialized applications and opportunities.
5G RedCap Technology Market Dynamics & Structure
The 5G RedCap technology market is experiencing significant growth driven by the convergence of several factors. Market concentration is currently moderate, with key players like Qualcomm, Huawei, and Quectel Wireless Solutions holding substantial shares. However, the market is dynamic, with ongoing technological innovations, such as improved power efficiency and enhanced connectivity, continuously reshaping the competitive landscape. Regulatory frameworks play a crucial role, impacting deployment speeds and market penetration across different regions. Competitive product substitutes, including existing LTE technologies and emerging IoT solutions, present challenges, necessitating continuous innovation. End-user demographics are shifting towards increased adoption in various sectors, including industrial automation, healthcare, and wearables. Furthermore, M&A activities are expected to intensify, further consolidating market share and accelerating technological advancements.
- Market Concentration: Moderate, with top 5 players holding approximately xx% of the market share in 2025.
- Technological Innovation Drivers: Improved power efficiency, enhanced connectivity, reduced latency.
- Regulatory Frameworks: Vary across regions, impacting deployment and adoption rates.
- Competitive Product Substitutes: LTE technologies, emerging IoT solutions.
- End-User Demographics: Growing adoption across industrial automation, healthcare, and wearables.
- M&A Trends: Increasing consolidation, with an estimated xx M&A deals projected between 2025 and 2033.
5G RedCap Technology Growth Trends & Insights
The 5G RedCap market is poised for substantial growth. Leveraging extensive data analysis, the report projects a Compound Annual Growth Rate (CAGR) of xx% during the forecast period (2025-2033), reaching a market size of xx million units by 2033. This growth is fueled by the increasing demand for low-power, wide-area network (LPWAN) solutions, especially in applications requiring extended battery life and high reliability. Technological disruptions, such as the integration of AI and edge computing, are further accelerating adoption. Consumer behavior shifts towards connected devices and the Internet of Things (IoT) are also significant drivers. Market penetration is expected to increase from xx% in 2025 to xx% by 2033, indicating significant growth potential across various sectors. The historical period (2019-2024) witnessed a slower growth trajectory due to initial technological limitations and limited commercial deployment. However, the market has now reached an inflection point, leading to accelerated adoption in the forecast period.
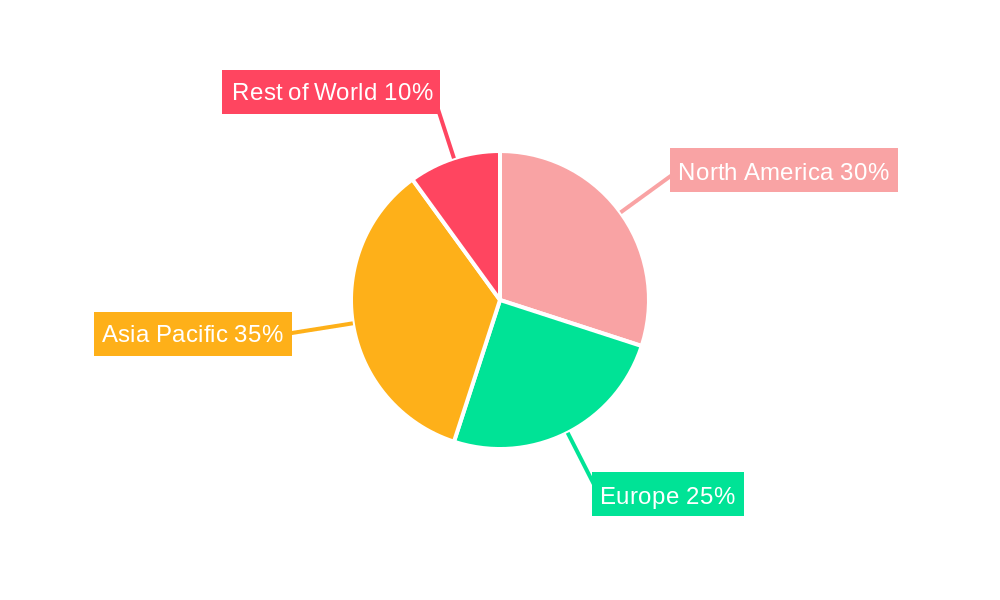
Dominant Regions, Countries, or Segments in 5G RedCap Technology
North America and Asia-Pacific are projected to be the dominant regions driving market growth. North America's strong technological infrastructure and early adoption of 5G contribute to its leadership position. The Asia-Pacific region's massive market size and growing investments in 5G infrastructure present immense opportunities. Within these regions, specific countries like the USA, China, Japan, and South Korea are leading the charge.
- Key Drivers (North America): Robust 5G infrastructure, early adoption of advanced technologies, strong government support.
- Key Drivers (Asia-Pacific): Growing demand for IoT solutions, massive market size, increasing investments in 5G infrastructure.
- Market Share: North America holds approximately xx% of the global market share in 2025, while Asia-Pacific holds approximately xx%.
- Growth Potential: Asia-Pacific presents the highest growth potential due to its large untapped market.
5G RedCap Technology Product Landscape
5G RedCap technology offers a range of products focusing on optimizing power efficiency and data transmission capabilities for various applications. These include low-power chips, modules, and gateways tailored for diverse needs. Key features include extended battery life, enhanced data security, and improved network coverage. The unique selling proposition of RedCap lies in its ability to bridge the gap between high-bandwidth and low-power requirements, opening up new applications in IoT and industrial automation. Continuous technological advancements are focusing on minimizing latency, improving data rates, and optimizing power consumption.
Key Drivers, Barriers & Challenges in 5G RedCap Technology
Key Drivers:
- Increased demand for low-power, wide-area networking solutions.
- Growth of IoT devices and applications.
- Advancements in chip technology, reducing power consumption.
- Government initiatives promoting 5G adoption.
Key Challenges:
- Interoperability issues among different vendors.
- High initial investment costs for infrastructure deployment.
- Lack of standardized protocols and security concerns.
- Competition from alternative technologies. This may result in a reduced market size of xx million units by 2033, if not addressed effectively.
Emerging Opportunities in 5G RedCap Technology
- Expansion into untapped markets, particularly in developing economies.
- Development of new applications in healthcare, smart agriculture, and industrial automation.
- Integration of AI and edge computing to enhance data analytics and decision-making capabilities.
- Focus on improving energy efficiency and reducing environmental impact.
Growth Accelerators in the 5G RedCap Technology Industry
The long-term growth of the 5G RedCap technology industry will be driven by continued technological advancements, particularly in chip miniaturization and power optimization. Strategic partnerships between telecom operators, technology providers, and end-user industries will accelerate market penetration. Moreover, expansion into new geographic markets and the development of innovative applications will play a crucial role in stimulating long-term growth.
Key Players Shaping the 5G RedCap Technology Market
- China Unicom
- Quectel Wireless Solutions
- Qualcomm
- MeiG Smart Technology
- Huawei
- China Telecom
Notable Milestones in 5G RedCap Technology Sector
- 2022 Q4: Qualcomm announces its first 5G RedCap modem.
- 2023 Q1: Several major telecom operators begin testing 5G RedCap networks.
- 2023 Q3: First commercial deployments of 5G RedCap technology in select markets.
In-Depth 5G RedCap Technology Market Outlook
The 5G RedCap technology market shows immense promise. Continued innovation in power efficiency, enhanced security features, and the expanding adoption across diverse sectors will fuel significant growth. Strategic partnerships and market expansion into new geographical territories will open up unprecedented opportunities for market players. The market is expected to reach significant maturity by 2033, with substantial contributions from various applications and regions. The potential for transformative applications across industries guarantees a robust and dynamic future for 5G RedCap technology.
5G RedCap Technology Segmentation
-
1. Application
- 1.1. Video Surveillance
- 1.2. Wearable Devices
- 1.3. Industrial Internet
- 1.4. Other
-
2. Types
- 2.1. Hardware
- 2.2. Software and Services
5G RedCap Technology Segmentation By Geography
-
1. North America
- 1.1. United States
- 1.2. Canada
- 1.3. Mexico
-
2. South America
- 2.1. Brazil
- 2.2. Argentina
- 2.3. Rest of South America
-
3. Europe
- 3.1. United Kingdom
- 3.2. Germany
- 3.3. France
- 3.4. Italy
- 3.5. Spain
- 3.6. Russia
- 3.7. Benelux
- 3.8. Nordics
- 3.9. Rest of Europe
-
4. Middle East & Africa
- 4.1. Turkey
- 4.2. Israel
- 4.3. GCC
- 4.4. North Africa
- 4.5. South Africa
- 4.6. Rest of Middle East & Africa
-
5. Asia Pacific
- 5.1. China
- 5.2. India
- 5.3. Japan
- 5.4. South Korea
- 5.5. ASEAN
- 5.6. Oceania
- 5.7. Rest of Asia Pacific
5G RedCap Technology Regional Market Share
Geographic Coverage of 5G RedCap Technology
5G RedCap Technology REPORT HIGHLIGHTS
| Aspects | Details |
|---|---|
| Study Period | 2020-2034 |
| Base Year | 2025 |
| Estimated Year | 2026 |
| Forecast Period | 2026-2034 |
| Historical Period | 2020-2025 |
| Growth Rate | CAGR of 8.41% from 2020-2034 |
| Segmentation |
|
Table of Contents
- 1. Introduction
- 1.1. Research Scope
- 1.2. Market Segmentation
- 1.3. Research Objective
- 1.4. Definitions and Assumptions
- 2. Executive Summary
- 2.1. Market Snapshot
- 3. Market Dynamics
- 3.1. Market Drivers
- 3.2. Market Restrains
- 3.3. Market Trends
- 3.4. Market Opportunities
- 4. Market Factor Analysis
- 4.1. Porters Five Forces
- 4.1.1. Bargaining Power of Suppliers
- 4.1.2. Bargaining Power of Buyers
- 4.1.3. Threat of New Entrants
- 4.1.4. Threat of Substitutes
- 4.1.5. Competitive Rivalry
- 4.2. PESTEL analysis
- 4.3. BCG Analysis
- 4.3.1. Stars (High Growth, High Market Share)
- 4.3.2. Cash Cows (Low Growth, High Market Share)
- 4.3.3. Question Mark (High Growth, Low Market Share)
- 4.3.4. Dogs (Low Growth, Low Market Share)
- 4.4. Ansoff Matrix Analysis
- 4.5. Supply Chain Analysis
- 4.6. Regulatory Landscape
- 4.7. Current Market Potential and Opportunity Assessment (TAM–SAM–SOM Framework)
- 4.8. VDR Analyst Note
- 4.1. Porters Five Forces
- 5. Market Analysis, Insights and Forecast 2021-2033
- 5.1. Market Analysis, Insights and Forecast - by Application
- 5.1.1. Video Surveillance
- 5.1.2. Wearable Devices
- 5.1.3. Industrial Internet
- 5.1.4. Other
- 5.2. Market Analysis, Insights and Forecast - by Types
- 5.2.1. Hardware
- 5.2.2. Software and Services
- 5.3. Market Analysis, Insights and Forecast - by Region
- 5.3.1. North America
- 5.3.2. South America
- 5.3.3. Europe
- 5.3.4. Middle East & Africa
- 5.3.5. Asia Pacific
- 5.1. Market Analysis, Insights and Forecast - by Application
- 6. Global 5G RedCap Technology Analysis, Insights and Forecast, 2021-2033
- 6.1. Market Analysis, Insights and Forecast - by Application
- 6.1.1. Video Surveillance
- 6.1.2. Wearable Devices
- 6.1.3. Industrial Internet
- 6.1.4. Other
- 6.2. Market Analysis, Insights and Forecast - by Types
- 6.2.1. Hardware
- 6.2.2. Software and Services
- 6.1. Market Analysis, Insights and Forecast - by Application
- 7. North America 5G RedCap Technology Analysis, Insights and Forecast, 2021-2033
- 7.1. Market Analysis, Insights and Forecast - by Application
- 7.1.1. Video Surveillance
- 7.1.2. Wearable Devices
- 7.1.3. Industrial Internet
- 7.1.4. Other
- 7.2. Market Analysis, Insights and Forecast - by Types
- 7.2.1. Hardware
- 7.2.2. Software and Services
- 7.1. Market Analysis, Insights and Forecast - by Application
- 8. South America 5G RedCap Technology Analysis, Insights and Forecast, 2021-2033
- 8.1. Market Analysis, Insights and Forecast - by Application
- 8.1.1. Video Surveillance
- 8.1.2. Wearable Devices
- 8.1.3. Industrial Internet
- 8.1.4. Other
- 8.2. Market Analysis, Insights and Forecast - by Types
- 8.2.1. Hardware
- 8.2.2. Software and Services
- 8.1. Market Analysis, Insights and Forecast - by Application
- 9. Europe 5G RedCap Technology Analysis, Insights and Forecast, 2021-2033
- 9.1. Market Analysis, Insights and Forecast - by Application
- 9.1.1. Video Surveillance
- 9.1.2. Wearable Devices
- 9.1.3. Industrial Internet
- 9.1.4. Other
- 9.2. Market Analysis, Insights and Forecast - by Types
- 9.2.1. Hardware
- 9.2.2. Software and Services
- 9.1. Market Analysis, Insights and Forecast - by Application
- 10. Middle East & Africa 5G RedCap Technology Analysis, Insights and Forecast, 2021-2033
- 10.1. Market Analysis, Insights and Forecast - by Application
- 10.1.1. Video Surveillance
- 10.1.2. Wearable Devices
- 10.1.3. Industrial Internet
- 10.1.4. Other
- 10.2. Market Analysis, Insights and Forecast - by Types
- 10.2.1. Hardware
- 10.2.2. Software and Services
- 10.1. Market Analysis, Insights and Forecast - by Application
- 11. Asia Pacific 5G RedCap Technology Analysis, Insights and Forecast, 2021-2033
- 11.1. Market Analysis, Insights and Forecast - by Application
- 11.1.1. Video Surveillance
- 11.1.2. Wearable Devices
- 11.1.3. Industrial Internet
- 11.1.4. Other
- 11.2. Market Analysis, Insights and Forecast - by Types
- 11.2.1. Hardware
- 11.2.2. Software and Services
- 11.1. Market Analysis, Insights and Forecast - by Application
- 12. Competitive Analysis
- 12.1. Company Profiles
- 12.1.1 China Unicom
- 12.1.1.1. Company Overview
- 12.1.1.2. Products
- 12.1.1.3. Company Financials
- 12.1.1.4. SWOT Analysis
- 12.1.2 Quectel Wireless Solutions
- 12.1.2.1. Company Overview
- 12.1.2.2. Products
- 12.1.2.3. Company Financials
- 12.1.2.4. SWOT Analysis
- 12.1.3 Qualcomm
- 12.1.3.1. Company Overview
- 12.1.3.2. Products
- 12.1.3.3. Company Financials
- 12.1.3.4. SWOT Analysis
- 12.1.4 MeiG Smart Technology
- 12.1.4.1. Company Overview
- 12.1.4.2. Products
- 12.1.4.3. Company Financials
- 12.1.4.4. SWOT Analysis
- 12.1.5 Huawei
- 12.1.5.1. Company Overview
- 12.1.5.2. Products
- 12.1.5.3. Company Financials
- 12.1.5.4. SWOT Analysis
- 12.1.6 China Telecom
- 12.1.6.1. Company Overview
- 12.1.6.2. Products
- 12.1.6.3. Company Financials
- 12.1.6.4. SWOT Analysis
- 12.1.1 China Unicom
- 12.2. Market Entropy
- 12.2.1 Company's Key Areas Served
- 12.2.2 Recent Developments
- 12.3. Company Market Share Analysis 2025
- 12.3.1 Top 5 Companies Market Share Analysis
- 12.3.2 Top 3 Companies Market Share Analysis
- 12.4. List of Potential Customers
- 13. Research Methodology
List of Figures
- Figure 1: Global 5G RedCap Technology Revenue Breakdown (billion, %) by Region 2025 & 2033
- Figure 2: North America 5G RedCap Technology Revenue (billion), by Application 2025 & 2033
- Figure 3: North America 5G RedCap Technology Revenue Share (%), by Application 2025 & 2033
- Figure 4: North America 5G RedCap Technology Revenue (billion), by Types 2025 & 2033
- Figure 5: North America 5G RedCap Technology Revenue Share (%), by Types 2025 & 2033
- Figure 6: North America 5G RedCap Technology Revenue (billion), by Country 2025 & 2033
- Figure 7: North America 5G RedCap Technology Revenue Share (%), by Country 2025 & 2033
- Figure 8: South America 5G RedCap Technology Revenue (billion), by Application 2025 & 2033
- Figure 9: South America 5G RedCap Technology Revenue Share (%), by Application 2025 & 2033
- Figure 10: South America 5G RedCap Technology Revenue (billion), by Types 2025 & 2033
- Figure 11: South America 5G RedCap Technology Revenue Share (%), by Types 2025 & 2033
- Figure 12: South America 5G RedCap Technology Revenue (billion), by Country 2025 & 2033
- Figure 13: South America 5G RedCap Technology Revenue Share (%), by Country 2025 & 2033
- Figure 14: Europe 5G RedCap Technology Revenue (billion), by Application 2025 & 2033
- Figure 15: Europe 5G RedCap Technology Revenue Share (%), by Application 2025 & 2033
- Figure 16: Europe 5G RedCap Technology Revenue (billion), by Types 2025 & 2033
- Figure 17: Europe 5G RedCap Technology Revenue Share (%), by Types 2025 & 2033
- Figure 18: Europe 5G RedCap Technology Revenue (billion), by Country 2025 & 2033
- Figure 19: Europe 5G RedCap Technology Revenue Share (%), by Country 2025 & 2033
- Figure 20: Middle East & Africa 5G RedCap Technology Revenue (billion), by Application 2025 & 2033
- Figure 21: Middle East & Africa 5G RedCap Technology Revenue Share (%), by Application 2025 & 2033
- Figure 22: Middle East & Africa 5G RedCap Technology Revenue (billion), by Types 2025 & 2033
- Figure 23: Middle East & Africa 5G RedCap Technology Revenue Share (%), by Types 2025 & 2033
- Figure 24: Middle East & Africa 5G RedCap Technology Revenue (billion), by Country 2025 & 2033
- Figure 25: Middle East & Africa 5G RedCap Technology Revenue Share (%), by Country 2025 & 2033
- Figure 26: Asia Pacific 5G RedCap Technology Revenue (billion), by Application 2025 & 2033
- Figure 27: Asia Pacific 5G RedCap Technology Revenue Share (%), by Application 2025 & 2033
- Figure 28: Asia Pacific 5G RedCap Technology Revenue (billion), by Types 2025 & 2033
- Figure 29: Asia Pacific 5G RedCap Technology Revenue Share (%), by Types 2025 & 2033
- Figure 30: Asia Pacific 5G RedCap Technology Revenue (billion), by Country 2025 & 2033
- Figure 31: Asia Pacific 5G RedCap Technology Revenue Share (%), by Country 2025 & 2033
List of Tables
- Table 1: Global 5G RedCap Technology Revenue billion Forecast, by Application 2020 & 2033
- Table 2: Global 5G RedCap Technology Revenue billion Forecast, by Types 2020 & 2033
- Table 3: Global 5G RedCap Technology Revenue billion Forecast, by Region 2020 & 2033
- Table 4: Global 5G RedCap Technology Revenue billion Forecast, by Application 2020 & 2033
- Table 5: Global 5G RedCap Technology Revenue billion Forecast, by Types 2020 & 2033
- Table 6: Global 5G RedCap Technology Revenue billion Forecast, by Country 2020 & 2033
- Table 7: United States 5G RedCap Technology Revenue (billion) Forecast, by Application 2020 & 2033
- Table 8: Canada 5G RedCap Technology Revenue (billion) Forecast, by Application 2020 & 2033
- Table 9: Mexico 5G RedCap Technology Revenue (billion) Forecast, by Application 2020 & 2033
- Table 10: Global 5G RedCap Technology Revenue billion Forecast, by Application 2020 & 2033
- Table 11: Global 5G RedCap Technology Revenue billion Forecast, by Types 2020 & 2033
- Table 12: Global 5G RedCap Technology Revenue billion Forecast, by Country 2020 & 2033
- Table 13: Brazil 5G RedCap Technology Revenue (billion) Forecast, by Application 2020 & 2033
- Table 14: Argentina 5G RedCap Technology Revenue (billion) Forecast, by Application 2020 & 2033
- Table 15: Rest of South America 5G RedCap Technology Revenue (billion) Forecast, by Application 2020 & 2033
- Table 16: Global 5G RedCap Technology Revenue billion Forecast, by Application 2020 & 2033
- Table 17: Global 5G RedCap Technology Revenue billion Forecast, by Types 2020 & 2033
- Table 18: Global 5G RedCap Technology Revenue billion Forecast, by Country 2020 & 2033
- Table 19: United Kingdom 5G RedCap Technology Revenue (billion) Forecast, by Application 2020 & 2033
- Table 20: Germany 5G RedCap Technology Revenue (billion) Forecast, by Application 2020 & 2033
- Table 21: France 5G RedCap Technology Revenue (billion) Forecast, by Application 2020 & 2033
- Table 22: Italy 5G RedCap Technology Revenue (billion) Forecast, by Application 2020 & 2033
- Table 23: Spain 5G RedCap Technology Revenue (billion) Forecast, by Application 2020 & 2033
- Table 24: Russia 5G RedCap Technology Revenue (billion) Forecast, by Application 2020 & 2033
- Table 25: Benelux 5G RedCap Technology Revenue (billion) Forecast, by Application 2020 & 2033
- Table 26: Nordics 5G RedCap Technology Revenue (billion) Forecast, by Application 2020 & 2033
- Table 27: Rest of Europe 5G RedCap Technology Revenue (billion) Forecast, by Application 2020 & 2033
- Table 28: Global 5G RedCap Technology Revenue billion Forecast, by Application 2020 & 2033
- Table 29: Global 5G RedCap Technology Revenue billion Forecast, by Types 2020 & 2033
- Table 30: Global 5G RedCap Technology Revenue billion Forecast, by Country 2020 & 2033
- Table 31: Turkey 5G RedCap Technology Revenue (billion) Forecast, by Application 2020 & 2033
- Table 32: Israel 5G RedCap Technology Revenue (billion) Forecast, by Application 2020 & 2033
- Table 33: GCC 5G RedCap Technology Revenue (billion) Forecast, by Application 2020 & 2033
- Table 34: North Africa 5G RedCap Technology Revenue (billion) Forecast, by Application 2020 & 2033
- Table 35: South Africa 5G RedCap Technology Revenue (billion) Forecast, by Application 2020 & 2033
- Table 36: Rest of Middle East & Africa 5G RedCap Technology Revenue (billion) Forecast, by Application 2020 & 2033
- Table 37: Global 5G RedCap Technology Revenue billion Forecast, by Application 2020 & 2033
- Table 38: Global 5G RedCap Technology Revenue billion Forecast, by Types 2020 & 2033
- Table 39: Global 5G RedCap Technology Revenue billion Forecast, by Country 2020 & 2033
- Table 40: China 5G RedCap Technology Revenue (billion) Forecast, by Application 2020 & 2033
- Table 41: India 5G RedCap Technology Revenue (billion) Forecast, by Application 2020 & 2033
- Table 42: Japan 5G RedCap Technology Revenue (billion) Forecast, by Application 2020 & 2033
- Table 43: South Korea 5G RedCap Technology Revenue (billion) Forecast, by Application 2020 & 2033
- Table 44: ASEAN 5G RedCap Technology Revenue (billion) Forecast, by Application 2020 & 2033
- Table 45: Oceania 5G RedCap Technology Revenue (billion) Forecast, by Application 2020 & 2033
- Table 46: Rest of Asia Pacific 5G RedCap Technology Revenue (billion) Forecast, by Application 2020 & 2033
Frequently Asked Questions
1. What is the projected Compound Annual Growth Rate (CAGR) of the 5G RedCap Technology?
The projected CAGR is approximately 8.41%.
2. Which companies are prominent players in the 5G RedCap Technology?
Key companies in the market include China Unicom, Quectel Wireless Solutions, Qualcomm, MeiG Smart Technology, Huawei, China Telecom.
3. What are the main segments of the 5G RedCap Technology?
The market segments include Application, Types.
4. Can you provide details about the market size?
The market size is estimated to be USD 14.2 billion as of 2022.
5. What are some drivers contributing to market growth?
N/A
6. What are the notable trends driving market growth?
N/A
7. Are there any restraints impacting market growth?
N/A
8. Can you provide examples of recent developments in the market?
N/A
9. What pricing options are available for accessing the report?
Pricing options include single-user, multi-user, and enterprise licenses priced at USD 4900.00, USD 7350.00, and USD 9800.00 respectively.
10. Is the market size provided in terms of value or volume?
The market size is provided in terms of value, measured in billion.
11. Are there any specific market keywords associated with the report?
Yes, the market keyword associated with the report is "5G RedCap Technology," which aids in identifying and referencing the specific market segment covered.
12. How do I determine which pricing option suits my needs best?
The pricing options vary based on user requirements and access needs. Individual users may opt for single-user licenses, while businesses requiring broader access may choose multi-user or enterprise licenses for cost-effective access to the report.
13. Are there any additional resources or data provided in the 5G RedCap Technology report?
While the report offers comprehensive insights, it's advisable to review the specific contents or supplementary materials provided to ascertain if additional resources or data are available.
14. How can I stay updated on further developments or reports in the 5G RedCap Technology?
To stay informed about further developments, trends, and reports in the 5G RedCap Technology, consider subscribing to industry newsletters, following relevant companies and organizations, or regularly checking reputable industry news sources and publications.
Methodology
Step 1 - Identification of Relevant Samples Size from Population Database


Step 2 - Approaches for Defining Global Market Size (Value, Volume* & Price*)

Note*: In applicable scenarios
Step 3 - Data Sources
Primary Research
- Web Analytics
- Survey Reports
- Research Institute
- Latest Research Reports
- Opinion Leaders
Secondary Research
- Annual Reports
- White Paper
- Latest Press Release
- Industry Association
- Paid Database
- Investor Presentations

Step 4 - Data Triangulation
Involves using different sources of information in order to increase the validity of a study
These sources are likely to be stakeholders in a program - participants, other researchers, program staff, other community members, and so on.
Then we put all data in single framework & apply various statistical tools to find out the dynamic on the market.
During the analysis stage, feedback from the stakeholder groups would be compared to determine areas of agreement as well as areas of divergence