

Key Insights
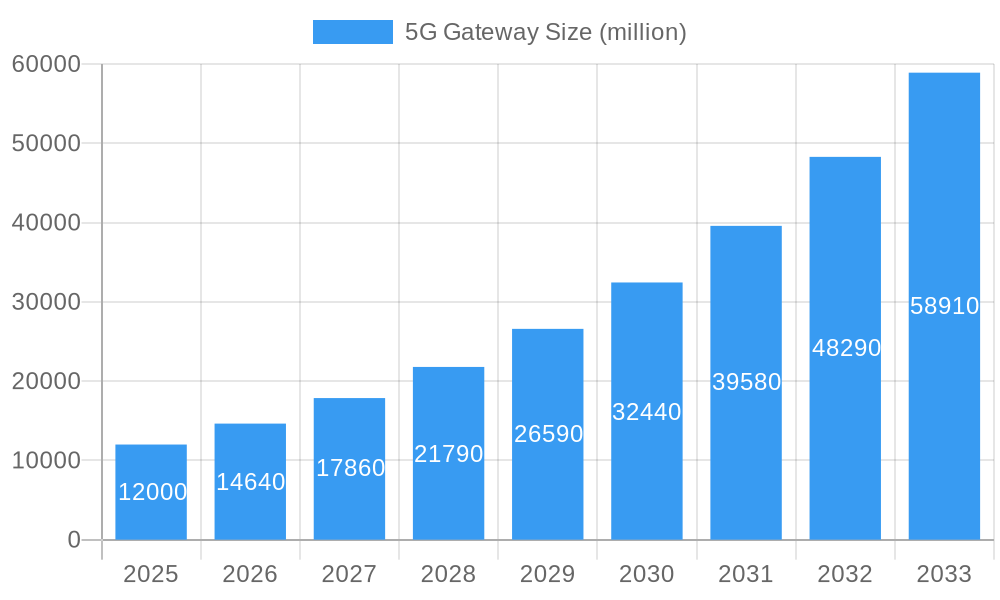
The 5G Gateway market is poised for significant expansion, driven by the accelerating global deployment of 5G infrastructure and the burgeoning demand for high-speed, low-latency connectivity across diverse sectors. Estimated to be valued at approximately $12 billion in 2025, the market is projected to grow at a Compound Annual Growth Rate (CAGR) of around 22% through 2033. This robust growth is fueled by critical applications such as Industrial IoT (IIoT), smart city initiatives, enhanced mobile broadband, and mission-critical communications. The increasing adoption of edge computing, where 5G gateways play a pivotal role in processing data closer to the source, further amplifies market momentum. Leading technology players like Huawei, Nokia, and ZTE Corporation are at the forefront, investing heavily in R&D to deliver advanced gateway solutions that support features like network slicing, ultra-reliable low-latency communication (URLLC), and massive machine-type communication (mMTC). The proliferation of connected devices, coupled with the need for seamless and secure data transfer in both industrial and commercial environments, underpins this positive market outlook.
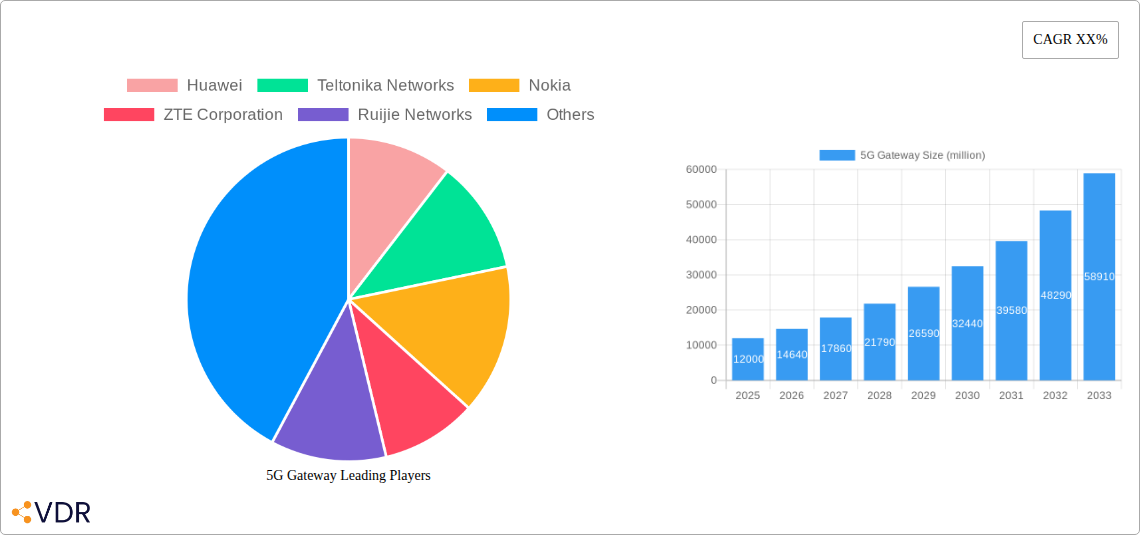
5G Gateway Market Size (In Billion)
However, the market faces certain restraints, including the high initial investment costs associated with 5G network upgrades and gateway deployments, as well as the ongoing challenge of ensuring interoperability and standardization across different vendor solutions. Despite these hurdles, the transformative potential of 5G technology and its ability to unlock new revenue streams and operational efficiencies are expected to outweigh these limitations. The market segmentation reveals a strong preference for Vehicular and Rackmount gateway types, catering to the demands of sophisticated industrial automation and robust network infrastructure respectively. Geographically, the Asia Pacific region, led by China, is expected to dominate the market due to aggressive 5G network rollouts and a vast manufacturing base. North America and Europe are also significant contributors, driven by advancements in smart cities and the enterprise adoption of 5G. Emerging economies in these regions are gradually increasing their market share, signaling a global shift towards 5G-enabled connectivity.
5G Gateway Company Market Share
Report Description: 5G Gateway Market Analysis: Navigating Connectivity, Innovation, and Regional Dominance (2019-2033)
This comprehensive report delves into the dynamic 5G gateway market, providing an in-depth analysis of its current trajectory and future potential. Spanning the historical period of 2019-2024, the base and estimated year of 2025, and a robust forecast period of 2025-2033, this report is an essential resource for industry professionals seeking to understand market concentration, technological innovation drivers, regulatory frameworks, competitive product substitutes, end-user demographics, and merger and acquisition trends. We also explore the evolution of market size, adoption rates, technological disruptions, and consumer behavior shifts, offering critical insights into the growth trends and opportunities in the 5G gateway industry. The analysis extends to identifying the dominant regions, countries, and segments, including Industrial, Commercial, and Other applications, and Vehicular, Rackmount, and Portable types, driving market growth. Furthermore, we detail the 5G gateway product landscape, highlighting innovations, applications, and performance metrics, and dissect the key drivers, barriers, and challenges impacting the sector. Finally, we identify growth accelerators, the key players shaping the 5G gateway market, notable milestones, and an in-depth 5G gateway market outlook. This report is meticulously structured to deliver actionable intelligence for stakeholders navigating this rapidly evolving 5G infrastructure market.
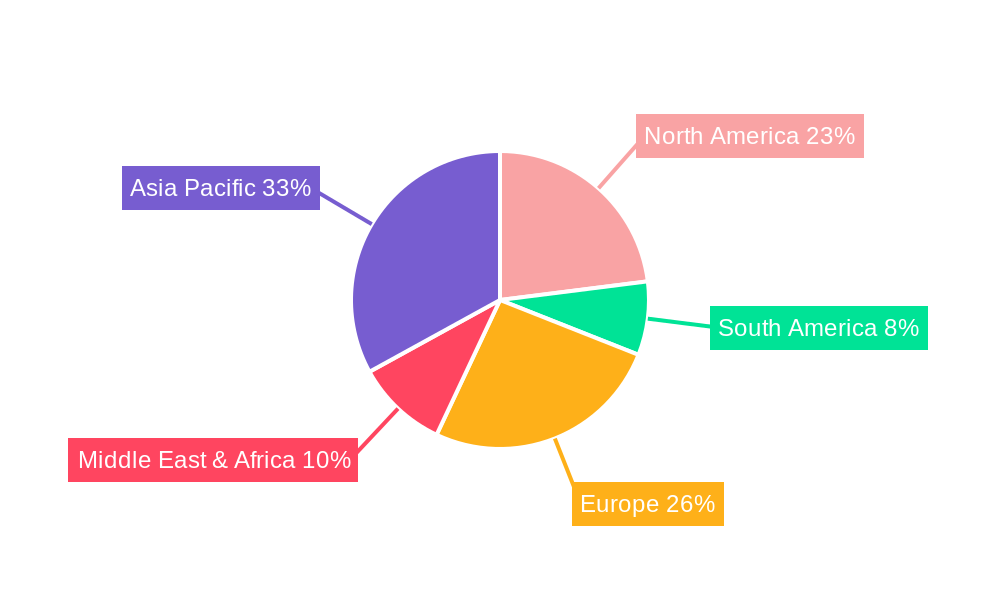
5G Gateway Regional Market Share
5G Gateway Market Dynamics & Structure
The 5G gateway market is characterized by a moderate to high concentration, with key players investing heavily in research and development to drive technological innovation. The rapid rollout of 5G networks globally is a primary innovation driver, enabling advanced functionalities such as edge computing, massive IoT deployments, and ultra-low latency applications. Regulatory frameworks, particularly spectrum allocation and network deployment policies, play a crucial role in shaping market access and adoption rates. Competitive product substitutes, primarily advanced 4G gateways and specialized edge devices, present ongoing challenges, though their capabilities are increasingly outpaced by the performance of 5G solutions. End-user demographics are shifting from early adopters in enterprise and industrial sectors towards broader commercial applications, including smart cities, connected vehicles, and enhanced mobile broadband. Merger and acquisition (M&A) activity, while not at peak levels, is anticipated to increase as larger players seek to consolidate market share and acquire specialized technological capabilities.
- Market Concentration: Dominated by a mix of established telecommunications equipment manufacturers and emerging technology providers.
- Technological Innovation Drivers: 5G network expansion, demand for edge computing, IoT proliferation, low-latency applications, network slicing capabilities.
- Regulatory Frameworks: Spectrum availability, network deployment incentives, security and privacy standards.
- Competitive Product Substitutes: High-performance 4G gateways, specialized edge servers, proprietary networking solutions.
- End-User Demographics: Initial focus on Industrial IoT (IIoT), enterprise private networks, and smart city initiatives, with growing adoption in commercial sectors like retail, logistics, and transportation.
- M&A Trends: Strategic acquisitions by larger companies to gain market share, proprietary technology, or expand into new verticals.
5G Gateway Growth Trends & Insights
The 5G gateway market is poised for substantial growth, driven by the accelerating deployment of 5G infrastructure worldwide and the increasing demand for enhanced connectivity solutions. The market size is projected to expand significantly from an estimated $2500 million in 2025 to over $7000 million by 2033, reflecting a compound annual growth rate (CAGR) of approximately 13.5% during the forecast period. Adoption rates are steadily climbing, particularly within the industrial and commercial sectors, where the promise of low latency, high bandwidth, and massive device connectivity is transforming business operations. Technological disruptions, including the integration of AI and machine learning into gateway functionalities for predictive maintenance and intelligent traffic management, are further fueling adoption. Consumer behavior is also indirectly influenced, as seamless connectivity becomes an expectation for various services, pushing businesses to adopt 5G gateways to meet these evolving demands. The widespread availability of affordable 5G spectrum and favorable government initiatives supporting digital transformation are key enablers of this growth. The convergence of 5G with edge computing is creating new application paradigms, from real-time data processing at the source to enhanced augmented reality experiences, all of which necessitate robust and high-performance 5G gateways. The expanding ecosystem of IoT devices and the growing need for secure, reliable, and high-speed network aggregation points are creating a fertile ground for market expansion. As 5G coverage expands geographically and device compatibility increases, the penetration of 5G gateways across diverse industries will become more profound. The report forecasts a market penetration of approximately 35% for 5G gateways in enterprise environments by 2030, a significant leap from its current nascent stage. This surge is underpinned by the tangible benefits of reduced operational costs, improved efficiency, and the creation of novel revenue streams enabled by 5G connectivity. The transition from pilot projects to large-scale deployments across various verticals, from manufacturing floors to smart city infrastructure, is a defining trend. Furthermore, the development of specialized 5G gateways tailored for specific applications, such as those requiring ruggedization for harsh industrial environments or miniaturization for vehicular use, will broaden the market's appeal. The increasing focus on network security and data privacy is also driving demand for gateways with advanced security features and robust encryption capabilities. The strategic importance of 5G gateways as the critical bridge between the core network and edge devices will ensure their sustained relevance and growth.
Dominant Regions, Countries, or Segments in 5G Gateway
The 5G gateway market is experiencing significant growth, with certain regions and application segments exhibiting pronounced leadership. North America and Asia-Pacific are emerging as the dominant regions, propelled by substantial investments in 5G infrastructure and proactive government initiatives supporting digital transformation and industrial modernization. Specifically, countries like the United States, China, and South Korea are at the forefront of 5G deployment, leading to a higher demand for sophisticated 5G gateways.
Within the Application segment, the Industrial sector is a primary growth driver. The imperative for enhanced automation, real-time data processing, and the proliferation of IoT devices in manufacturing, energy, and logistics fuels the adoption of 5G gateways. These gateways enable mission-critical applications, facilitating predictive maintenance, remote monitoring, and streamlined supply chain operations, with an estimated market share of 45% in 2025. The Commercial segment is rapidly gaining traction, driven by smart city initiatives, retail analytics, and the need for ubiquitous high-speed connectivity in public spaces and enterprises, projecting a share of 35% by 2025. The "Other" applications, encompassing sectors like healthcare and public safety, represent a smaller but growing segment.
Regarding Types, the Rackmount 5G gateways are currently leading the market, accounting for approximately 50% of the market share in 2025. This dominance is attributed to their suitability for data centers, enterprise networks, and industrial control rooms where robust performance and scalability are paramount. Vehicular 5G gateways are experiencing rapid growth due to the increasing adoption of connected car technologies, autonomous driving systems, and in-vehicle infotainment, with an estimated market share of 30% in 2025. The Portable 5G gateway segment, while smaller, is finding applications in mobile hotspots, remote work scenarios, and field services, projecting a share of 20% by 2025.
- Dominant Regions:
- North America: Strong government support, extensive 5G network buildouts, and high adoption of enterprise solutions.
- Asia-Pacific: China's aggressive 5G rollout, technological innovation hub, and significant industrial base drive demand.
- Dominant Countries:
- United States: Advanced technological infrastructure, strong enterprise adoption, and focus on smart city development.
- China: Leading global 5G infrastructure investment, rapid industrial automation, and a vast domestic market.
- South Korea: Early adopter of 5G, focus on connected services and advanced manufacturing.
- Dominant Application Segments:
- Industrial: Critical for IIoT, automation, remote operations, and real-time data analytics.
- Commercial: Enabling smart cities, connected retail, logistics optimization, and enhanced enterprise connectivity.
- Dominant Types:
- Rackmount: Preferred for data centers, enterprise network closets, and industrial control systems.
- Vehicular: Essential for connected vehicles, fleet management, and in-car digital services.
5G Gateway Product Landscape
The 5G gateway product landscape is characterized by continuous innovation, focusing on enhanced performance, miniaturization, and integration of advanced functionalities. Manufacturers are developing gateways with multi-gigabit speeds, ultra-low latency, and support for network slicing, enabling differentiated services. Key product innovations include integrated edge computing capabilities, allowing for local data processing and reducing reliance on cloud infrastructure. Security features are paramount, with advanced encryption protocols, secure boot, and intrusion detection systems becoming standard. Applications range from industrial automation and smart city infrastructure to connected vehicles and enterprise private networks. Performance metrics such as throughput (Gbps), latency (ms), and device connectivity density are key differentiators. Unique selling propositions often lie in the ruggedized designs for harsh environments, compact form factors for mobile or embedded applications, and flexible software platforms supporting diverse use cases. Technological advancements are also focused on interoperability, ease of deployment, and energy efficiency.
Key Drivers, Barriers & Challenges in 5G Gateway
Key Drivers
The 5G gateway market is propelled by several significant drivers. The accelerated global deployment of 5G networks is the primary catalyst, creating a demand for compatible gateway solutions to harness 5G's enhanced speed, low latency, and massive connectivity. The burgeoning Internet of Things (IoT) ecosystem, with its ever-increasing number of connected devices, necessitates robust gateways for aggregation and data management. Furthermore, the growing adoption of edge computing solutions, which require gateways to process data closer to the source, is a major growth factor. Government initiatives and investments in digital transformation and smart infrastructure projects worldwide are also providing substantial impetus.
Barriers & Challenges
Despite the strong growth potential, the 5G gateway market faces several barriers and challenges. The high cost of 5G infrastructure deployment can slow down widespread adoption in certain regions. Interoperability issues between different vendor equipment and legacy systems can create integration complexities. Security concerns related to the vast number of connected devices and the sensitive data they handle remain a significant challenge, demanding robust security features. Furthermore, regulatory hurdles and spectrum availability can vary significantly across different countries, impacting market entry and expansion. Supply chain disruptions, particularly for specialized components, can also pose risks to timely product delivery and impact market stability, with potential impacts on market growth of up to 15% in affected periods.
Emerging Opportunities in 5G Gateway
Emerging opportunities in the 5G gateway market are abundant, driven by the evolving technological landscape and expanding use cases. The integration of AI and machine learning into gateways presents a significant opportunity for intelligent network management, predictive analytics, and enhanced security. The development of specialized gateways for the metaverse and extended reality (XR) applications, requiring extremely low latency and high bandwidth, represents a nascent but promising market. Furthermore, the growing demand for private 5G networks in enterprises for secure and dedicated connectivity is creating a substantial opportunity for tailored 5G gateway solutions. Untapped markets in developing economies with increasing digitalization efforts also offer considerable growth potential.
Growth Accelerators in the 5G Gateway Industry
Several catalysts are accelerating growth within the 5G gateway industry. Technological breakthroughs in chipsets and modem technology are leading to more powerful, efficient, and cost-effective 5G gateways. Strategic partnerships between telecommunications operators, equipment manufacturers, and software providers are crucial for developing integrated solutions and expanding market reach. Market expansion strategies, including the penetration into new vertical markets and geographic regions, are key to sustained growth. The ongoing development of open standards and interoperable platforms will reduce integration barriers and encourage wider adoption. Furthermore, the increasing convergence of 5G with Wi-Fi 6/6E and other wireless technologies will create more sophisticated and comprehensive connectivity solutions.
Key Players Shaping the 5G Gateway Market
- Huawei
- Teltonika Networks
- Nokia
- ZTE Corporation
- Ruijie Networks
- Juniper Networks
- Hangzhou DPtech Technologies
- Digital China Group
- Opzoon Technology
- Symantec
- Chengdu Zongheng Intelligent Control Technology
- Guangzhou Robustel
- Wuhan Wanxiang Aoke Electronics
- Beijing Netinorder Technology
- Shenzhen Hongdian Technologies
Notable Milestones in 5G Gateway Sector
- 2019: Initial commercial rollouts of 5G networks began globally, sparking early development of 5G gateways.
- 2020: Introduction of first-generation 5G gateways with enhanced mobile broadband (eMBB) capabilities.
- 2021: Increased focus on industrial IoT (IIoT) applications and the development of ruggedized 5G gateways.
- 2022: Growing integration of edge computing functionalities within 5G gateways.
- 2023: Significant advancements in low-latency capabilities (URLLC) for critical applications and the emergence of vehicular 5G gateways.
- 2024: Expansion of private 5G network deployments, driving demand for specialized enterprise gateways.
- 2025 (Estimated): Broader market adoption across commercial sectors and continued innovation in AI-driven gateway features.
In-Depth 5G Gateway Market Outlook
The 5G gateway market outlook remains exceptionally strong, driven by the foundational role these devices play in enabling the full potential of 5G connectivity. Future growth will be significantly accelerated by advancements in network slicing, allowing for tailored performance characteristics for diverse applications, and the continued integration of AI for proactive network management and enhanced security. Strategic alliances and ecosystem development will be crucial for delivering comprehensive end-to-end solutions. The expansion into emerging economies and untapped vertical markets, such as advanced healthcare and immersive entertainment, presents substantial untapped potential. The continuous drive for smaller, more power-efficient, and highly secure gateway solutions will cater to the ever-expanding range of connected devices and evolving user demands, solidifying the 5G gateway as an indispensable component of the digital future.
5G Gateway Segmentation
-
1. Application
- 1.1. Industrial
- 1.2. Commercial
- 1.3. Other
-
2. Types
- 2.1. Vehicular
- 2.2. Rackmount
- 2.3. Portable
5G Gateway Segmentation By Geography
-
1. North America
- 1.1. United States
- 1.2. Canada
- 1.3. Mexico
-
2. South America
- 2.1. Brazil
- 2.2. Argentina
- 2.3. Rest of South America
-
3. Europe
- 3.1. United Kingdom
- 3.2. Germany
- 3.3. France
- 3.4. Italy
- 3.5. Spain
- 3.6. Russia
- 3.7. Benelux
- 3.8. Nordics
- 3.9. Rest of Europe
-
4. Middle East & Africa
- 4.1. Turkey
- 4.2. Israel
- 4.3. GCC
- 4.4. North Africa
- 4.5. South Africa
- 4.6. Rest of Middle East & Africa
-
5. Asia Pacific
- 5.1. China
- 5.2. India
- 5.3. Japan
- 5.4. South Korea
- 5.5. ASEAN
- 5.6. Oceania
- 5.7. Rest of Asia Pacific
5G Gateway Regional Market Share
Geographic Coverage of 5G Gateway
5G Gateway REPORT HIGHLIGHTS
| Aspects | Details |
|---|---|
| Study Period | 2020-2034 |
| Base Year | 2025 |
| Estimated Year | 2026 |
| Forecast Period | 2026-2034 |
| Historical Period | 2020-2025 |
| Growth Rate | CAGR of XX% from 2020-2034 |
| Segmentation |
|
Table of Contents
- 1. Introduction
- 1.1. Research Scope
- 1.2. Market Segmentation
- 1.3. Research Objective
- 1.4. Definitions and Assumptions
- 2. Executive Summary
- 2.1. Market Snapshot
- 3. Market Dynamics
- 3.1. Market Drivers
- 3.2. Market Restrains
- 3.3. Market Trends
- 3.4. Market Opportunities
- 4. Market Factor Analysis
- 4.1. Porters Five Forces
- 4.1.1. Bargaining Power of Suppliers
- 4.1.2. Bargaining Power of Buyers
- 4.1.3. Threat of New Entrants
- 4.1.4. Threat of Substitutes
- 4.1.5. Competitive Rivalry
- 4.2. PESTEL analysis
- 4.3. BCG Analysis
- 4.3.1. Stars (High Growth, High Market Share)
- 4.3.2. Cash Cows (Low Growth, High Market Share)
- 4.3.3. Question Mark (High Growth, Low Market Share)
- 4.3.4. Dogs (Low Growth, Low Market Share)
- 4.4. Ansoff Matrix Analysis
- 4.5. Supply Chain Analysis
- 4.6. Regulatory Landscape
- 4.7. Current Market Potential and Opportunity Assessment (TAM–SAM–SOM Framework)
- 4.8. VDR Analyst Note
- 4.1. Porters Five Forces
- 5. Market Analysis, Insights and Forecast 2021-2033
- 5.1. Market Analysis, Insights and Forecast - by Application
- 5.1.1. Industrial
- 5.1.2. Commercial
- 5.1.3. Other
- 5.2. Market Analysis, Insights and Forecast - by Types
- 5.2.1. Vehicular
- 5.2.2. Rackmount
- 5.2.3. Portable
- 5.3. Market Analysis, Insights and Forecast - by Region
- 5.3.1. North America
- 5.3.2. South America
- 5.3.3. Europe
- 5.3.4. Middle East & Africa
- 5.3.5. Asia Pacific
- 5.1. Market Analysis, Insights and Forecast - by Application
- 6. Global 5G Gateway Analysis, Insights and Forecast, 2021-2033
- 6.1. Market Analysis, Insights and Forecast - by Application
- 6.1.1. Industrial
- 6.1.2. Commercial
- 6.1.3. Other
- 6.2. Market Analysis, Insights and Forecast - by Types
- 6.2.1. Vehicular
- 6.2.2. Rackmount
- 6.2.3. Portable
- 6.1. Market Analysis, Insights and Forecast - by Application
- 7. North America 5G Gateway Analysis, Insights and Forecast, 2021-2033
- 7.1. Market Analysis, Insights and Forecast - by Application
- 7.1.1. Industrial
- 7.1.2. Commercial
- 7.1.3. Other
- 7.2. Market Analysis, Insights and Forecast - by Types
- 7.2.1. Vehicular
- 7.2.2. Rackmount
- 7.2.3. Portable
- 7.1. Market Analysis, Insights and Forecast - by Application
- 8. South America 5G Gateway Analysis, Insights and Forecast, 2021-2033
- 8.1. Market Analysis, Insights and Forecast - by Application
- 8.1.1. Industrial
- 8.1.2. Commercial
- 8.1.3. Other
- 8.2. Market Analysis, Insights and Forecast - by Types
- 8.2.1. Vehicular
- 8.2.2. Rackmount
- 8.2.3. Portable
- 8.1. Market Analysis, Insights and Forecast - by Application
- 9. Europe 5G Gateway Analysis, Insights and Forecast, 2021-2033
- 9.1. Market Analysis, Insights and Forecast - by Application
- 9.1.1. Industrial
- 9.1.2. Commercial
- 9.1.3. Other
- 9.2. Market Analysis, Insights and Forecast - by Types
- 9.2.1. Vehicular
- 9.2.2. Rackmount
- 9.2.3. Portable
- 9.1. Market Analysis, Insights and Forecast - by Application
- 10. Middle East & Africa 5G Gateway Analysis, Insights and Forecast, 2021-2033
- 10.1. Market Analysis, Insights and Forecast - by Application
- 10.1.1. Industrial
- 10.1.2. Commercial
- 10.1.3. Other
- 10.2. Market Analysis, Insights and Forecast - by Types
- 10.2.1. Vehicular
- 10.2.2. Rackmount
- 10.2.3. Portable
- 10.1. Market Analysis, Insights and Forecast - by Application
- 11. Asia Pacific 5G Gateway Analysis, Insights and Forecast, 2021-2033
- 11.1. Market Analysis, Insights and Forecast - by Application
- 11.1.1. Industrial
- 11.1.2. Commercial
- 11.1.3. Other
- 11.2. Market Analysis, Insights and Forecast - by Types
- 11.2.1. Vehicular
- 11.2.2. Rackmount
- 11.2.3. Portable
- 11.1. Market Analysis, Insights and Forecast - by Application
- 12. Competitive Analysis
- 12.1. Company Profiles
- 12.1.1 Huawei
- 12.1.1.1. Company Overview
- 12.1.1.2. Products
- 12.1.1.3. Company Financials
- 12.1.1.4. SWOT Analysis
- 12.1.2 Teltonika Networks
- 12.1.2.1. Company Overview
- 12.1.2.2. Products
- 12.1.2.3. Company Financials
- 12.1.2.4. SWOT Analysis
- 12.1.3 Nokia
- 12.1.3.1. Company Overview
- 12.1.3.2. Products
- 12.1.3.3. Company Financials
- 12.1.3.4. SWOT Analysis
- 12.1.4 ZTE Corporation
- 12.1.4.1. Company Overview
- 12.1.4.2. Products
- 12.1.4.3. Company Financials
- 12.1.4.4. SWOT Analysis
- 12.1.5 Ruijie Networks
- 12.1.5.1. Company Overview
- 12.1.5.2. Products
- 12.1.5.3. Company Financials
- 12.1.5.4. SWOT Analysis
- 12.1.6 Juniper Networks
- 12.1.6.1. Company Overview
- 12.1.6.2. Products
- 12.1.6.3. Company Financials
- 12.1.6.4. SWOT Analysis
- 12.1.7 Hangzhou DPtech Technologies
- 12.1.7.1. Company Overview
- 12.1.7.2. Products
- 12.1.7.3. Company Financials
- 12.1.7.4. SWOT Analysis
- 12.1.8 Digital China Group
- 12.1.8.1. Company Overview
- 12.1.8.2. Products
- 12.1.8.3. Company Financials
- 12.1.8.4. SWOT Analysis
- 12.1.9 Opzoon Technology
- 12.1.9.1. Company Overview
- 12.1.9.2. Products
- 12.1.9.3. Company Financials
- 12.1.9.4. SWOT Analysis
- 12.1.10 Symantec
- 12.1.10.1. Company Overview
- 12.1.10.2. Products
- 12.1.10.3. Company Financials
- 12.1.10.4. SWOT Analysis
- 12.1.11 Chengdu Zongheng Intelligent Control Technology
- 12.1.11.1. Company Overview
- 12.1.11.2. Products
- 12.1.11.3. Company Financials
- 12.1.11.4. SWOT Analysis
- 12.1.12 Guangzhou Robustel
- 12.1.12.1. Company Overview
- 12.1.12.2. Products
- 12.1.12.3. Company Financials
- 12.1.12.4. SWOT Analysis
- 12.1.13 Wuhan Wanxiang Aoke Electronics
- 12.1.13.1. Company Overview
- 12.1.13.2. Products
- 12.1.13.3. Company Financials
- 12.1.13.4. SWOT Analysis
- 12.1.14 Beijing Netinorder Technology
- 12.1.14.1. Company Overview
- 12.1.14.2. Products
- 12.1.14.3. Company Financials
- 12.1.14.4. SWOT Analysis
- 12.1.15 Shenzhen Hongdian Technologies
- 12.1.15.1. Company Overview
- 12.1.15.2. Products
- 12.1.15.3. Company Financials
- 12.1.15.4. SWOT Analysis
- 12.1.1 Huawei
- 12.2. Market Entropy
- 12.2.1 Company's Key Areas Served
- 12.2.2 Recent Developments
- 12.3. Company Market Share Analysis 2025
- 12.3.1 Top 5 Companies Market Share Analysis
- 12.3.2 Top 3 Companies Market Share Analysis
- 12.4. List of Potential Customers
- 13. Research Methodology
List of Figures
- Figure 1: Global 5G Gateway Revenue Breakdown (million, %) by Region 2025 & 2033
- Figure 2: Global 5G Gateway Volume Breakdown (K, %) by Region 2025 & 2033
- Figure 3: North America 5G Gateway Revenue (million), by Application 2025 & 2033
- Figure 4: North America 5G Gateway Volume (K), by Application 2025 & 2033
- Figure 5: North America 5G Gateway Revenue Share (%), by Application 2025 & 2033
- Figure 6: North America 5G Gateway Volume Share (%), by Application 2025 & 2033
- Figure 7: North America 5G Gateway Revenue (million), by Types 2025 & 2033
- Figure 8: North America 5G Gateway Volume (K), by Types 2025 & 2033
- Figure 9: North America 5G Gateway Revenue Share (%), by Types 2025 & 2033
- Figure 10: North America 5G Gateway Volume Share (%), by Types 2025 & 2033
- Figure 11: North America 5G Gateway Revenue (million), by Country 2025 & 2033
- Figure 12: North America 5G Gateway Volume (K), by Country 2025 & 2033
- Figure 13: North America 5G Gateway Revenue Share (%), by Country 2025 & 2033
- Figure 14: North America 5G Gateway Volume Share (%), by Country 2025 & 2033
- Figure 15: South America 5G Gateway Revenue (million), by Application 2025 & 2033
- Figure 16: South America 5G Gateway Volume (K), by Application 2025 & 2033
- Figure 17: South America 5G Gateway Revenue Share (%), by Application 2025 & 2033
- Figure 18: South America 5G Gateway Volume Share (%), by Application 2025 & 2033
- Figure 19: South America 5G Gateway Revenue (million), by Types 2025 & 2033
- Figure 20: South America 5G Gateway Volume (K), by Types 2025 & 2033
- Figure 21: South America 5G Gateway Revenue Share (%), by Types 2025 & 2033
- Figure 22: South America 5G Gateway Volume Share (%), by Types 2025 & 2033
- Figure 23: South America 5G Gateway Revenue (million), by Country 2025 & 2033
- Figure 24: South America 5G Gateway Volume (K), by Country 2025 & 2033
- Figure 25: South America 5G Gateway Revenue Share (%), by Country 2025 & 2033
- Figure 26: South America 5G Gateway Volume Share (%), by Country 2025 & 2033
- Figure 27: Europe 5G Gateway Revenue (million), by Application 2025 & 2033
- Figure 28: Europe 5G Gateway Volume (K), by Application 2025 & 2033
- Figure 29: Europe 5G Gateway Revenue Share (%), by Application 2025 & 2033
- Figure 30: Europe 5G Gateway Volume Share (%), by Application 2025 & 2033
- Figure 31: Europe 5G Gateway Revenue (million), by Types 2025 & 2033
- Figure 32: Europe 5G Gateway Volume (K), by Types 2025 & 2033
- Figure 33: Europe 5G Gateway Revenue Share (%), by Types 2025 & 2033
- Figure 34: Europe 5G Gateway Volume Share (%), by Types 2025 & 2033
- Figure 35: Europe 5G Gateway Revenue (million), by Country 2025 & 2033
- Figure 36: Europe 5G Gateway Volume (K), by Country 2025 & 2033
- Figure 37: Europe 5G Gateway Revenue Share (%), by Country 2025 & 2033
- Figure 38: Europe 5G Gateway Volume Share (%), by Country 2025 & 2033
- Figure 39: Middle East & Africa 5G Gateway Revenue (million), by Application 2025 & 2033
- Figure 40: Middle East & Africa 5G Gateway Volume (K), by Application 2025 & 2033
- Figure 41: Middle East & Africa 5G Gateway Revenue Share (%), by Application 2025 & 2033
- Figure 42: Middle East & Africa 5G Gateway Volume Share (%), by Application 2025 & 2033
- Figure 43: Middle East & Africa 5G Gateway Revenue (million), by Types 2025 & 2033
- Figure 44: Middle East & Africa 5G Gateway Volume (K), by Types 2025 & 2033
- Figure 45: Middle East & Africa 5G Gateway Revenue Share (%), by Types 2025 & 2033
- Figure 46: Middle East & Africa 5G Gateway Volume Share (%), by Types 2025 & 2033
- Figure 47: Middle East & Africa 5G Gateway Revenue (million), by Country 2025 & 2033
- Figure 48: Middle East & Africa 5G Gateway Volume (K), by Country 2025 & 2033
- Figure 49: Middle East & Africa 5G Gateway Revenue Share (%), by Country 2025 & 2033
- Figure 50: Middle East & Africa 5G Gateway Volume Share (%), by Country 2025 & 2033
- Figure 51: Asia Pacific 5G Gateway Revenue (million), by Application 2025 & 2033
- Figure 52: Asia Pacific 5G Gateway Volume (K), by Application 2025 & 2033
- Figure 53: Asia Pacific 5G Gateway Revenue Share (%), by Application 2025 & 2033
- Figure 54: Asia Pacific 5G Gateway Volume Share (%), by Application 2025 & 2033
- Figure 55: Asia Pacific 5G Gateway Revenue (million), by Types 2025 & 2033
- Figure 56: Asia Pacific 5G Gateway Volume (K), by Types 2025 & 2033
- Figure 57: Asia Pacific 5G Gateway Revenue Share (%), by Types 2025 & 2033
- Figure 58: Asia Pacific 5G Gateway Volume Share (%), by Types 2025 & 2033
- Figure 59: Asia Pacific 5G Gateway Revenue (million), by Country 2025 & 2033
- Figure 60: Asia Pacific 5G Gateway Volume (K), by Country 2025 & 2033
- Figure 61: Asia Pacific 5G Gateway Revenue Share (%), by Country 2025 & 2033
- Figure 62: Asia Pacific 5G Gateway Volume Share (%), by Country 2025 & 2033
List of Tables
- Table 1: Global 5G Gateway Revenue million Forecast, by Application 2020 & 2033
- Table 2: Global 5G Gateway Volume K Forecast, by Application 2020 & 2033
- Table 3: Global 5G Gateway Revenue million Forecast, by Types 2020 & 2033
- Table 4: Global 5G Gateway Volume K Forecast, by Types 2020 & 2033
- Table 5: Global 5G Gateway Revenue million Forecast, by Region 2020 & 2033
- Table 6: Global 5G Gateway Volume K Forecast, by Region 2020 & 2033
- Table 7: Global 5G Gateway Revenue million Forecast, by Application 2020 & 2033
- Table 8: Global 5G Gateway Volume K Forecast, by Application 2020 & 2033
- Table 9: Global 5G Gateway Revenue million Forecast, by Types 2020 & 2033
- Table 10: Global 5G Gateway Volume K Forecast, by Types 2020 & 2033
- Table 11: Global 5G Gateway Revenue million Forecast, by Country 2020 & 2033
- Table 12: Global 5G Gateway Volume K Forecast, by Country 2020 & 2033
- Table 13: United States 5G Gateway Revenue (million) Forecast, by Application 2020 & 2033
- Table 14: United States 5G Gateway Volume (K) Forecast, by Application 2020 & 2033
- Table 15: Canada 5G Gateway Revenue (million) Forecast, by Application 2020 & 2033
- Table 16: Canada 5G Gateway Volume (K) Forecast, by Application 2020 & 2033
- Table 17: Mexico 5G Gateway Revenue (million) Forecast, by Application 2020 & 2033
- Table 18: Mexico 5G Gateway Volume (K) Forecast, by Application 2020 & 2033
- Table 19: Global 5G Gateway Revenue million Forecast, by Application 2020 & 2033
- Table 20: Global 5G Gateway Volume K Forecast, by Application 2020 & 2033
- Table 21: Global 5G Gateway Revenue million Forecast, by Types 2020 & 2033
- Table 22: Global 5G Gateway Volume K Forecast, by Types 2020 & 2033
- Table 23: Global 5G Gateway Revenue million Forecast, by Country 2020 & 2033
- Table 24: Global 5G Gateway Volume K Forecast, by Country 2020 & 2033
- Table 25: Brazil 5G Gateway Revenue (million) Forecast, by Application 2020 & 2033
- Table 26: Brazil 5G Gateway Volume (K) Forecast, by Application 2020 & 2033
- Table 27: Argentina 5G Gateway Revenue (million) Forecast, by Application 2020 & 2033
- Table 28: Argentina 5G Gateway Volume (K) Forecast, by Application 2020 & 2033
- Table 29: Rest of South America 5G Gateway Revenue (million) Forecast, by Application 2020 & 2033
- Table 30: Rest of South America 5G Gateway Volume (K) Forecast, by Application 2020 & 2033
- Table 31: Global 5G Gateway Revenue million Forecast, by Application 2020 & 2033
- Table 32: Global 5G Gateway Volume K Forecast, by Application 2020 & 2033
- Table 33: Global 5G Gateway Revenue million Forecast, by Types 2020 & 2033
- Table 34: Global 5G Gateway Volume K Forecast, by Types 2020 & 2033
- Table 35: Global 5G Gateway Revenue million Forecast, by Country 2020 & 2033
- Table 36: Global 5G Gateway Volume K Forecast, by Country 2020 & 2033
- Table 37: United Kingdom 5G Gateway Revenue (million) Forecast, by Application 2020 & 2033
- Table 38: United Kingdom 5G Gateway Volume (K) Forecast, by Application 2020 & 2033
- Table 39: Germany 5G Gateway Revenue (million) Forecast, by Application 2020 & 2033
- Table 40: Germany 5G Gateway Volume (K) Forecast, by Application 2020 & 2033
- Table 41: France 5G Gateway Revenue (million) Forecast, by Application 2020 & 2033
- Table 42: France 5G Gateway Volume (K) Forecast, by Application 2020 & 2033
- Table 43: Italy 5G Gateway Revenue (million) Forecast, by Application 2020 & 2033
- Table 44: Italy 5G Gateway Volume (K) Forecast, by Application 2020 & 2033
- Table 45: Spain 5G Gateway Revenue (million) Forecast, by Application 2020 & 2033
- Table 46: Spain 5G Gateway Volume (K) Forecast, by Application 2020 & 2033
- Table 47: Russia 5G Gateway Revenue (million) Forecast, by Application 2020 & 2033
- Table 48: Russia 5G Gateway Volume (K) Forecast, by Application 2020 & 2033
- Table 49: Benelux 5G Gateway Revenue (million) Forecast, by Application 2020 & 2033
- Table 50: Benelux 5G Gateway Volume (K) Forecast, by Application 2020 & 2033
- Table 51: Nordics 5G Gateway Revenue (million) Forecast, by Application 2020 & 2033
- Table 52: Nordics 5G Gateway Volume (K) Forecast, by Application 2020 & 2033
- Table 53: Rest of Europe 5G Gateway Revenue (million) Forecast, by Application 2020 & 2033
- Table 54: Rest of Europe 5G Gateway Volume (K) Forecast, by Application 2020 & 2033
- Table 55: Global 5G Gateway Revenue million Forecast, by Application 2020 & 2033
- Table 56: Global 5G Gateway Volume K Forecast, by Application 2020 & 2033
- Table 57: Global 5G Gateway Revenue million Forecast, by Types 2020 & 2033
- Table 58: Global 5G Gateway Volume K Forecast, by Types 2020 & 2033
- Table 59: Global 5G Gateway Revenue million Forecast, by Country 2020 & 2033
- Table 60: Global 5G Gateway Volume K Forecast, by Country 2020 & 2033
- Table 61: Turkey 5G Gateway Revenue (million) Forecast, by Application 2020 & 2033
- Table 62: Turkey 5G Gateway Volume (K) Forecast, by Application 2020 & 2033
- Table 63: Israel 5G Gateway Revenue (million) Forecast, by Application 2020 & 2033
- Table 64: Israel 5G Gateway Volume (K) Forecast, by Application 2020 & 2033
- Table 65: GCC 5G Gateway Revenue (million) Forecast, by Application 2020 & 2033
- Table 66: GCC 5G Gateway Volume (K) Forecast, by Application 2020 & 2033
- Table 67: North Africa 5G Gateway Revenue (million) Forecast, by Application 2020 & 2033
- Table 68: North Africa 5G Gateway Volume (K) Forecast, by Application 2020 & 2033
- Table 69: South Africa 5G Gateway Revenue (million) Forecast, by Application 2020 & 2033
- Table 70: South Africa 5G Gateway Volume (K) Forecast, by Application 2020 & 2033
- Table 71: Rest of Middle East & Africa 5G Gateway Revenue (million) Forecast, by Application 2020 & 2033
- Table 72: Rest of Middle East & Africa 5G Gateway Volume (K) Forecast, by Application 2020 & 2033
- Table 73: Global 5G Gateway Revenue million Forecast, by Application 2020 & 2033
- Table 74: Global 5G Gateway Volume K Forecast, by Application 2020 & 2033
- Table 75: Global 5G Gateway Revenue million Forecast, by Types 2020 & 2033
- Table 76: Global 5G Gateway Volume K Forecast, by Types 2020 & 2033
- Table 77: Global 5G Gateway Revenue million Forecast, by Country 2020 & 2033
- Table 78: Global 5G Gateway Volume K Forecast, by Country 2020 & 2033
- Table 79: China 5G Gateway Revenue (million) Forecast, by Application 2020 & 2033
- Table 80: China 5G Gateway Volume (K) Forecast, by Application 2020 & 2033
- Table 81: India 5G Gateway Revenue (million) Forecast, by Application 2020 & 2033
- Table 82: India 5G Gateway Volume (K) Forecast, by Application 2020 & 2033
- Table 83: Japan 5G Gateway Revenue (million) Forecast, by Application 2020 & 2033
- Table 84: Japan 5G Gateway Volume (K) Forecast, by Application 2020 & 2033
- Table 85: South Korea 5G Gateway Revenue (million) Forecast, by Application 2020 & 2033
- Table 86: South Korea 5G Gateway Volume (K) Forecast, by Application 2020 & 2033
- Table 87: ASEAN 5G Gateway Revenue (million) Forecast, by Application 2020 & 2033
- Table 88: ASEAN 5G Gateway Volume (K) Forecast, by Application 2020 & 2033
- Table 89: Oceania 5G Gateway Revenue (million) Forecast, by Application 2020 & 2033
- Table 90: Oceania 5G Gateway Volume (K) Forecast, by Application 2020 & 2033
- Table 91: Rest of Asia Pacific 5G Gateway Revenue (million) Forecast, by Application 2020 & 2033
- Table 92: Rest of Asia Pacific 5G Gateway Volume (K) Forecast, by Application 2020 & 2033
Frequently Asked Questions
1. What is the projected Compound Annual Growth Rate (CAGR) of the 5G Gateway?
The projected CAGR is approximately XX%.
2. Which companies are prominent players in the 5G Gateway?
Key companies in the market include Huawei, Teltonika Networks, Nokia, ZTE Corporation, Ruijie Networks, Juniper Networks, Hangzhou DPtech Technologies, Digital China Group, Opzoon Technology, Symantec, Chengdu Zongheng Intelligent Control Technology, Guangzhou Robustel, Wuhan Wanxiang Aoke Electronics, Beijing Netinorder Technology, Shenzhen Hongdian Technologies.
3. What are the main segments of the 5G Gateway?
The market segments include Application, Types.
4. Can you provide details about the market size?
The market size is estimated to be USD XXX million as of 2022.
5. What are some drivers contributing to market growth?
N/A
6. What are the notable trends driving market growth?
N/A
7. Are there any restraints impacting market growth?
N/A
8. Can you provide examples of recent developments in the market?
N/A
9. What pricing options are available for accessing the report?
Pricing options include single-user, multi-user, and enterprise licenses priced at USD 3350.00, USD 5025.00, and USD 6700.00 respectively.
10. Is the market size provided in terms of value or volume?
The market size is provided in terms of value, measured in million and volume, measured in K.
11. Are there any specific market keywords associated with the report?
Yes, the market keyword associated with the report is "5G Gateway," which aids in identifying and referencing the specific market segment covered.
12. How do I determine which pricing option suits my needs best?
The pricing options vary based on user requirements and access needs. Individual users may opt for single-user licenses, while businesses requiring broader access may choose multi-user or enterprise licenses for cost-effective access to the report.
13. Are there any additional resources or data provided in the 5G Gateway report?
While the report offers comprehensive insights, it's advisable to review the specific contents or supplementary materials provided to ascertain if additional resources or data are available.
14. How can I stay updated on further developments or reports in the 5G Gateway?
To stay informed about further developments, trends, and reports in the 5G Gateway, consider subscribing to industry newsletters, following relevant companies and organizations, or regularly checking reputable industry news sources and publications.
Methodology
Step 1 - Identification of Relevant Samples Size from Population Database


Step 2 - Approaches for Defining Global Market Size (Value, Volume* & Price*)

Note*: In applicable scenarios
Step 3 - Data Sources
Primary Research
- Web Analytics
- Survey Reports
- Research Institute
- Latest Research Reports
- Opinion Leaders
Secondary Research
- Annual Reports
- White Paper
- Latest Press Release
- Industry Association
- Paid Database
- Investor Presentations

Step 4 - Data Triangulation
Involves using different sources of information in order to increase the validity of a study
These sources are likely to be stakeholders in a program - participants, other researchers, program staff, other community members, and so on.
Then we put all data in single framework & apply various statistical tools to find out the dynamic on the market.
During the analysis stage, feedback from the stakeholder groups would be compared to determine areas of agreement as well as areas of divergence